
Rationale and Objectives
The aim of this study was to compare different sequences for olfactory bulb volumetry using 3-T magnetic resonance imaging, evaluating reproducibility, repeatability, and systematic biases.
Materials and Methods
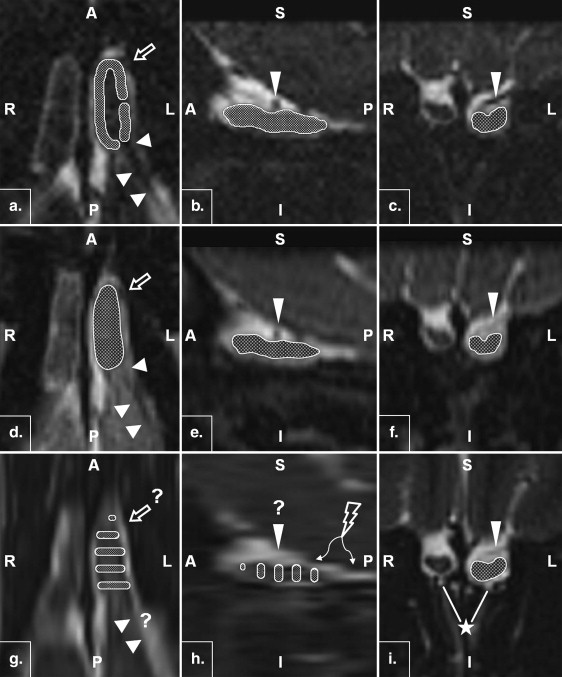
Twenty-two volunteers underwent 3-T magnetic resonance imaging of the frontal skull base in this prospective study. Imaging included constructive interference in steady state (CISS), T2-weighted (T2w) three-dimensional (3D) sampling perfection with application-optimized contrasts using different flip-angle evolutions, and T2w two-dimensional (2D) turbo spin-echo sequences. Two observers independently performed two olfactory bulb volumetric studies per bulb and sequence. Intraobserver and interobserver reliability was assessed using intraclass correlation coefficients. For the evaluation of reproducibility, concordance correlation coefficients were determined, and for repeatability and systematic biases, Bland-Altman plots were analyzed.
Results
Intraclass correlation coefficient analysis of the specialized observer yielded almost perfect results for intraobserver reliability (0.94, 0.85, and 0.93 for the CISS, T2w 3D, and T2w 2D sequences, respectively). For the less experienced observer, the results were 0.86 0.78, and 0.74 for the CISS, T2w 3D, and T2w 2D sequences, respectively. Interobserver reliability showed almost perfect agreement for all sequences (0.92, 0.86, and 0.86, respectively). The CISS sequence yielded the highest concordance correlation coefficient (0.84), precision (0.85), and accuracy (0.99). Bland-Altman plot analyses revealed the lowest repeatability coefficients for the T2w 2D sequence. Volumetric measurements of T2w 2D imaging showed systematically lower volumetric results compared to the CISS sequence (−22.7%) and the T2w 3D sequence (−8.3%).
Conclusions
Comparison of three imaging sequences for olfactory bulb volumetry yielded the best values for the CISS sequence in terms of intraobserver and interobserver reliability, reproducibility, accuracy, and precision. Given that even less experienced observers achieve almost perfect results, the CISS sequence is recommended for olfactory bulb volumetry.
Studies indicate a prevalence of about 20% for olfactory dysfunction in the Western world. Within the field of olfactory dysfunction, olfactory bulb (OB) volumetry is a nascent technique that has already been used as a complementary prognostic tool for radiologic diagnosis to predict outcomes in olfactory disorders . Decreases in OB volume have been identified in all five of the most most frequent etiologies of smelling disorders (ie, sinonasal disease , postinfectious , posttraumatic , neurodegenerative diseases , and idiopathic olfactory disorders ), and a volume increase after successful olfactory rehabilitation in sinonasal diseases has been shown. These dynamic changes are most probably due to the fact that the human OB retained the capability for neuroneogenesis and therefore exhibits high structural plasticity, whereby OB volume is correlated with the afferent neural activity transmitted by the olfactory receptor neurons .
In 1997, Yousem et al described magnetic resonance imaging (MRI) as a feasible method for OB volumetry on the basis of T1-weighted (T1w) sequences at 1.5 T. However, further studies using MRI OB volumetry to evaluate olfactory dysfunction were heterogeneous in the application of sequence types , scanning parameters , and technical equipment used . Until now, a systematic radiologic comparison of volumetric results using various standardized sequences to rule out a systematic bias possibly underestimating or overestimating OB volumes has not been performed, and a reference standard for MRI OB volumetry has not been established. The latter and the limited resolution gained at 1.5 T complicate a comparative quantification of volumetric results of this small paleocortical structure. Further development of MRI techniques and the use of MRI at higher field strengths (ie, at 3 T) could help resolve the aforementioned deficiencies, because the increased signal-to-noise ratio can be invested in better spatial resolution .
Get Radiology Tree app to read full this article<
Materials and methods
Participant Recruitment and Sampling
Get Radiology Tree app to read full this article<
Get Radiology Tree app to read full this article<
Imaging Procedures
Get Radiology Tree app to read full this article<
Data Analysis
Get Radiology Tree app to read full this article<
Get Radiology Tree app to read full this article<
Get Radiology Tree app to read full this article<
Get Radiology Tree app to read full this article<
Get Radiology Tree app to read full this article<
Statistical Analysis
Get Radiology Tree app to read full this article<
Get Radiology Tree app to read full this article<
Get Radiology Tree app to read full this article<
Get Radiology Tree app to read full this article<
CR=1.96×∑ni=1(Vi2−Vi1)2n−1,−−−−−−−−−−√ CR
=
1.96
×
∑
i
=
1
n
(
V
2
i
−
V
1
i
)
2
n
−
1
,
where CR is the coefficient of repeatability; V 2 is the volumetric result on the second pass, and V 1 is the volumetric result on the first pass.
Get Radiology Tree app to read full this article<
Get Radiology Tree app to read full this article<
Get Radiology Tree app to read full this article<
Results
Get Radiology Tree app to read full this article<
Get Radiology Tree app to read full this article<
Get Radiology Tree app to read full this article<
Get Radiology Tree app to read full this article<
Table 1
CCCs, Interobserver Reliability, and Reproducibility (n = 44)
Sequence CCC ρ c 95% CI Pearson’s ρ (Precision) Bias Correction Factor c b (Accuracy) CISS First evaluation 0.81 0.67–0.89 0.82 0.98 Second evaluation 0.75 0.59–0.85 0.76 0.99 Average 0.84 0.73–0.91 0.85 0.99 T2w 3D First evaluation 0.68 0.49–0.81 0.68 0.99 Second evaluation 0.63 0.44–0.76 0.71 0.88 Average 0.76 0.61–0.86 0.79 0.96 T2w 2D First evaluation 0.63 0.44–0.76 0.71 0.88 Second evaluation 0.67 0.48–0.80 0.70 0.95 Average 0.76 0.61–0.85 0.82 0.92
CCC, concordance correlation coefficient; CI, confidence interval; CISS, constructive interference in steady state; 3D, three-dimensional T2w, T2-weighted; 2D, two-dimensional.
Get Radiology Tree app to read full this article<
Get Radiology Tree app to read full this article<
Get Radiology Tree app to read full this article<
Get Radiology Tree app to read full this article<
Table 2
Repeatability and Test-retest Reliability (n = 44)
Limits of Agreement Sequence Arithmetic Mean Bias Lower Limit Upper Limit Coefficient of Repeatability CISS Observer 1 0.95 −15.63 17.54 16.59 Observer 2 −4.16 −25.18 16.87 21.01 T2w 3D Observer 1 2.64 −17.67 22.94 20.31 Observer 2 −3.09 −29.83 23.64 26.74 T2w 2D Observer 1 0.48 −11.40 12.35 11.88 Observer 2 −1.57 −21.77 18.64 20.20
CISS, constructive interference in steady state; 3D, three-dimensional T2w, T2-weighted; 2D, two-dimensional.
Get Radiology Tree app to read full this article<
Get Radiology Tree app to read full this article<
Discussion
Get Radiology Tree app to read full this article<
Get Radiology Tree app to read full this article<
Get Radiology Tree app to read full this article<
Get Radiology Tree app to read full this article<
Get Radiology Tree app to read full this article<
Get Radiology Tree app to read full this article<
Get Radiology Tree app to read full this article<
Get Radiology Tree app to read full this article<
Get Radiology Tree app to read full this article<
Get Radiology Tree app to read full this article<
Get Radiology Tree app to read full this article<
Conclusions
Get Radiology Tree app to read full this article<
References
1. Hoffman H.J., Cruickshanks K.J., Davis B.: Perspectives on population-based epidemiological studies of olfactory and taste impairment. Ann N Y Acad Sci 2009; 1170: pp. 514-530.
2. Vennemann M., Hummel T., Berger K.: The association between smoking and smell and taste impairment in the general population. J Neurol 2008; 255: pp. 1121-1126.
3. Duprez T.P., Rombaux P.: Imaging the olfactory tract (cranial nerve #1). Eur J Radiol 2010; 74: pp. 288-298.
4. Rombaux P., Duprez T., Hummel T.: Olfactory bulb volume in the clinical assessment of olfactory dysfunction. Rhinology 2009; 47: pp. 3-9.
5. Hummel T.: Therapy of olfactory loss [article in German]. Laryngorhinootologie 2003; 82: pp. 552-554.
6. Rombaux P., Potier H., Bertrand B., et. al.: Olfactory bulb volume in patients with sinonasal disease. Am J Rhinol 2008; 22: pp. 598-601.
7. Mueller A., Rodewald A., Reden J., et. al.: Reduced olfactory bulb volume in post-traumatic and post-infectious olfactory dysfunction. Neuroreport 2005; 16: pp. 475-478.
8. Rombaux P., Potier H., Markessis E., et. al.: Olfactory bulb volume and depth of olfactory sulcus in patients with idiopathic olfactory loss. Eur Arch Otorhinolaryngol 2010; 267: pp. 1551-1556.
9. Gudziol V., Buschhuter D., Abolmaali N., et. al.: Increasing olfactory bulb volume due to treatment of chronic rhinosinusitis—a longitudinal study. Brain 2009; 132: pp. 3096-3101.
10. Bédard A., Parent A.: Evidence of newly generated neurons in the human olfactory bulb. Dev Brain Res 2004; 151: pp. 159-168.
11. Abolmaali N., Gudziol V., Hummel T.: Pathology of the olfactory nerve. Neuroimag Clin North Am 2008; 18: pp. 233-242.
12. Yousem D.M., Geckle R.J., Doty R.L., et. al.: Reproducibility and reliability of volumetric measurements of olfactory eloquent structures. Acad Radiol 1997; 4: pp. 264-269.
13. Turetsky B.I., Moberg P.J., Yousem D.M., et. al.: Reduced olfactory bulb volume in patients with schizophrenia. Am J Psychiatry 2000; 157: pp. 828-830.
14. Mueller A., Abolmaali N.D., Hakimi A.R., et. al.: Olfactory bulb volumes in patients with idiopathic Parkinson’s disease a pilot study. J Neural Transm 2005; 112: pp. 1363-1370.
15. Turetsky B.I., Moberg P.J., Arnold S.E., et. al.: Low olfactory bulb volume in first-degree relatives of patients with schizophrenia. Am J Psychiatry 2003; 160: pp. 703-708.
16. Schmitt F., Grosu D., Mohr C., et. al.: 3 Tesla MRI: successful results with higher field strengths [article in German]. Radiologe 2004; 44: pp. 31-47.
17. Burmeister H.P., Baltzer P.A.T., Moslein C., et. al.: Visual grading characteristics (VGC) analysis of diagnostic image quality for high resolution 3 tesla MRI volumetry of the olfactory bulb. Acad Radiol 2011; 18: pp. 634-639.
18. Leblanc A.: Olfactory nerves.Leblanc A.Encephalo-Peripheral Nervous System: Vascularisation, Anatomy, Imaging.2001.Springer-VerlagBerlin, Germany:pp. 1-19.
19. Keros P.: On the practical value of differences in the level of the lamina cribrosa of the ethmoid [article in German]. Z Laryngol Rhinol Otol 1962; 41: pp. 809-813.
20. Vasvari G., Reisch R., Patonay L.: Surgical anatomy of the cribriform plate and adjacent areas. Minim Invasive Neurosurg 2005; 48: pp. 25-33.
21. Rombaux P., Grandin C., Duprez T.: How to measure olfactory bulb volume and olfactory sulcus depth?. B-ENT 2009; 5: pp. 53-60.
22. Yousem D.M., Geckle R.J., Bilker W.B., et. al.: Olfactory bulb and tract and temporal lobe volumes. Normative data across decades. Ann N Y Acad Sci 1998; 855: pp. 546-555.
23. Rombaux P., Mouraux A., Bertrand B., et. al.: Olfactory function and olfactory bulb volume in patients with postinfectious olfactory loss. Laryngoscope 2006; 116: pp. 436-439.
24. Shrout P.E., Fleiss J.L.: Intraclass correlations: uses in assessing rater reliability. Psychol Bull 1979; 86: pp. 420-428.
25. Landis J.R., Koch G.G.: The measurement of observer agreement for categorical data. Biometrics 1977; 33: pp. 159-174.
26. Crawford S.B., Kosinski A.S., Lin H.-M., et. al.: Computer programs for the concordance correlation coefficient. Comput Methods Programs Biomed 2007; 88: pp. 62-74.
27. Lin L.I.: A concordance correlation coefficient to evaluate reproducibility. Biometrics 1989; 45: pp. 255-268.
28. Bland J.M., Altman D.G.: Statistical methods for assessing agreement between two methods of clinical measurement. Lancet 1986; 1: pp. 307-310.
29. Aickin M., Gensler H.: Adjusting for multiple testing when reporting research results: the Bonferroni vs Holm methods. Am J Public Health 1996; 86: pp. 726-728.
30. Negoias S., Croy I., Gerber J., et. al.: Reduced olfactory bulb volume and olfactory sensitivity in patients with acute major depression. Neuroscience 2010; 169: pp. 415-421.
31. Bauknecht H.C., Jach C., Fleiner F., et. al.: Olfactory dysfunction: correlation of olfactory bulb volume on MRI and objective olfactometry [article in German]. Rofo 2010; 182: pp. 163-168.
32. Jack C.R., Bentley M.D., Twomey C.K., et. al.: MR imaging-based volume measurements of the hippocampal formation and anterior temporal lobe: validation studies. Radiology 1990; 176: pp. 205-209.
33. Kohn M.I., Tanna N.K., Herman G.T., et. al.: Analysis of brain and cerebrospinal fluid volumes with MR imaging. Part I. Methods, reliability, and validation. Radiology 1991; 178: pp. 115-122.
34. Blatter D.D., Bigler E.D., Gale S.D., et. al.: Quantitative volumetric analysis of brain MR: normative database spanning 5 decades of life. AJNR Am J Neuroradiol 1995; 16: pp. 241-251.
35. Melhem E.R., Shakir H., Bakthavachalam S., et. al.: Inner ear volumetric measurements using high-resolution 3D T2-weighted fast spin-echo MR imaging: initial experience in healthy subjects. AJNR Am J Neuroradiol 1998; 19: pp. 1819-1822.
36. Burmeister H.P., Bitter T., Baltzer P.A.T., et. al.: Olfactory bulb ventricles as a frequent finding—a myth or reality? Evaluation using high resolution 3 Tesla magnetic resonance imaging. Neuroscience 2011; 172: pp. 547-553.
37. Dietrich O., Reiser M.F., Schoenberg S.O.: Artifacts in 3-T MRI: physical background and reduction strategies. Eur J Radiol 2008; 65: pp. 29-35.
38. Lledo P.-M., Gheusi G.: Olfactory processing in a changing brain. Neuroreport 2003; 14: pp. 1655-1663.
39. Abolmaali N.D., Hietschold V., Vogl T.J., et. al.: MR evaluation in patients with isolated anosmia since birth or early childhood. AJNR Am J Neuroradiol 2002; 23: pp. 157-164.