
Rationale and Objectives
To assess the reproducibility of multidetector-row computed tomography (MDCT)-measured forced expiratory tracheal collapse in healthy volunteers.
Methods and Materials
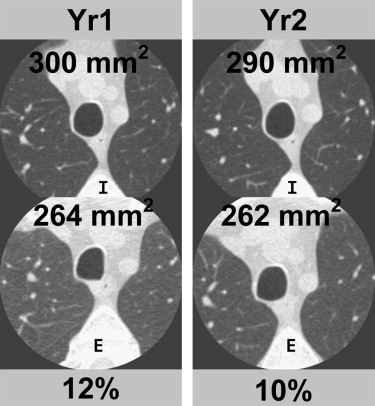
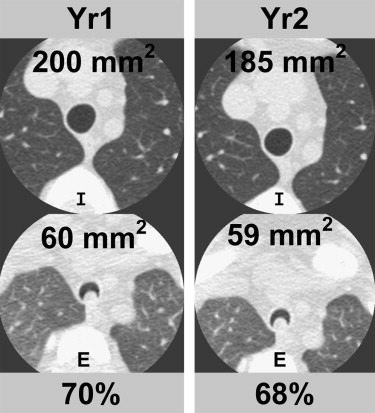
Fourteen healthy, nonsmoking volunteers (6 males, 8 females, mean age 48.7 ± 13.8 years) underwent repeat imaging 1 year after baseline imaging of tracheal dynamics employing the same scanner and technique (64-MDCT, 40 mAs, 120 kVp, and 0.625 mm detector collimation) with spirometric monitoring of total lung capacity and forced exhalation. Cross-sectional area (CSA) of the trachea was measured 1 cm above the aortic arch at end-inspiration and dynamic expiration, and percentage (%) expiratory reduction in tracheal lumen was calculated. Measurements were compared between baseline (Yr1) and repeat imaging (Yr2) using correlation coefficients and Bland-Altman plots.
Results
Mean end-inspiratory CSA was 255.3 ± 56 mm 2 at Yr1 and 255.1 ± 52 mm 2 at Yr2; mean dynamic expiratory CSA was 125.6 ± 60 mm 2 at Yr1 and 132.1 ± 58 mm 2 at Yr2; and mean % expiratory reduction was 51.7 ± 18% at Yr1 and 48.7 ± 19% at Yr2. Mean differences between Yr1 and Yr2 values were 0.2 mm 2 for end-inspiratory CSA, 6.5 mm 2 for dynamic expiratory CSA, and 3.0% for percentage expiratory reduction. There was excellent correlation between the Yr1 and Yr2 measures of end-inspiratory CSA ( r 2 = 0.97, P < .001), dynamic expiratory CSA ( r 2 = 0.89, P < .001), and % expiratory reduction ( r 2 = 0.86, P < .001).
Conclusion
MDCT measurements of forced expiratory tracheal collapse in healthy volunteers are highly reproducible over time.
Multidetector-row computed tomography (MDCT)-paired end-inspiratory and dynamic expiratory imaging has been increasingly used to evaluate expiratory tracheal dynamics in both health and disease . In particular, this technique has been shown to be comparable to the reference standard of bronchoscopy for diagnosing tracheomalacia and has been used to monitor progression and response to treatment of this condition .
The use of MDCT for monitoring progression and response to treatment is based on an assumption that this method is reproducible over time. However, to our knowledge, this assumption has not been previously tested. Therefore, our purpose was to assess the reproducibility of MDCT-measured dynamic expiratory tracheal collapse.
Materials and methods
Study Population
Get Radiology Tree app to read full this article<
Imaging Technique
Get Radiology Tree app to read full this article<
Computed Tomography Analysis
Get Radiology Tree app to read full this article<
Get Radiology Tree app to read full this article<
Statistical Analysis
Get Radiology Tree app to read full this article<
Results
Study Population
Get Radiology Tree app to read full this article<
Table 1
Descriptive Features of the Study Population
Gender 6 males, 8 females Age (y) 49 ± 14 Height (cm) 167 ± 10 Weight (kg) 73 ± 13 FEV1 (% predicted) 105 ± 13 FEV1/FVC (% predicted) 107 ± 8
FEV1, forced expiratory volume in 1 second.
FEV1/FVC, ratio of forced expiratory volume in 1 second to forced vital capacity.
Get Radiology Tree app to read full this article<
CSA of Tracheal Lumen
Get Radiology Tree app to read full this article<
Table 2
Comparison of Cross-sectional Area and Percentage Expiratory Collapse between Measurements at Year 1 (Yr1) and Year 2 (Yr2)
Upper Trachea Yr 1 Yr 2 Mean Difference Inspiration (mm 2 ) 255.3 ± 56 255.1 ± 52 −0.2 Expiration (mm 2 ) 125.6 ± 60 132.1 ± 58 −6.5 Dynamic collapse (%) 51.7 ± 18 48.7 ± 19 −3.0
Get Radiology Tree app to read full this article<
Percentage Expiratory Tracheal Collapse
Get Radiology Tree app to read full this article<
Get Radiology Tree app to read full this article<
Discussion
Get Radiology Tree app to read full this article<
Get Radiology Tree app to read full this article<
Get Radiology Tree app to read full this article<
Get Radiology Tree app to read full this article<
Get Radiology Tree app to read full this article<
Get Radiology Tree app to read full this article<
References
1. Gilkeson R.C., Ciancibello L.M., Hejal R.B., et. al.: Tracheobronchomalacia: dynamic airway evaluation with multidetector CT. AJR Am J Roentgenol 2001; 176: pp. 205-210.
2. Ferretti G.R., Jankowski A., Perrin M.A., et. al.: Multi-detector CT evaluation in patients suspected of tracheobronchomalacia: comparison of end-expiratory with dynamic expiratory volumetric acquisitions. Eur J Radiol 2008; 68: pp. 340-346.
3. Sverzellati N., Rastelli A., Chetta A., et. al.: Airway malacia in chronic obstructive pulmonary disease: prevalence, morphology and relationship with emphysema, bronchiectasis and bronchial wall thickening. Eur Radiol 2009; 19: pp. 1669-1678.
4. Lee K.S., Sun M.E., Ernst A., et. al.: Comparison of dynamic expiratory CT with bronchoscopy in diagnosing airway malacia. Chest 2007; 131: pp. 758-764.
5. Baroni R.H., Ashiku S., Boiselle P.M.: Dynamic-CT evaluation of the central airways in patients undergoing tracheoplasty for tracheobronchomalacia. AJR Am J Roentgenol 2005; 184: pp. 1444-1449.
6. Lee K.S., Ashiku S.K., Ernst A., et. al.: Comparison of expiratory CT abnormalities before and after tracheoplasty surgery for tracheobronchomalacia. J Thorac Imaging 2008; 23: pp. 121-126.
7. Boiselle P.M., O’Donnell C., Bankier A.A., et. al.: Tracheal collapsibility of healthy volunteers during forced expiration: assessment with MDCT. Radiology 2009; 252: pp. 255-262.
8. Zhang J., Hasegawa I., Feller-Kopman D., et. al.: Dynamic expiratory volumetric CT imaging of the central airways: comparison of standard-dose and low-dose techniques. Acad Radiol 2003; 10: pp. 719-724.
9. Baroni R.H., Feller-Kopman D., Nishino M., et. al.: Tracheobronchomalacia: comparison between end-expiratory and dynamic expiratory CT for evaluation of central airway collapse. Radiology 2005; 235: pp. 635-641.
10. Stern E.J., Graham C.M., Webb W.R., et. al.: Normal trachea during forced expiration: dynamic CT measurements. Radiology 1993; 187: pp. 27-31.