
Rationale and Objectives
Lung and lobar volume measurements from computed tomographic (CT) imaging are being used in clinical trials to assess new minimally invasive emphysema treatments aiming to reduce lung volumes. Establishing the reproducibility of lung volume measurements is important if they are to be accepted as treatment planning and outcome variables. The aims of this study were to (1) investigate the correlation between lung volumes assessed on CT imaging and on pulmonary function testing (PFT), (2) compare the two methods’ reproducibility, and (3) assess the reproducibility of CT lobar volumes.
Materials and Methods
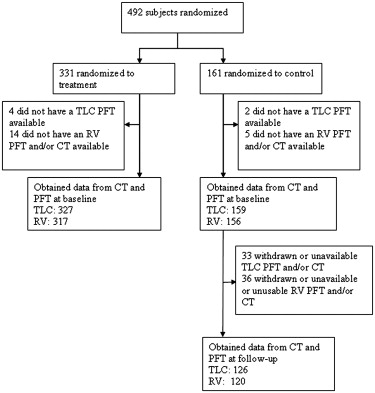
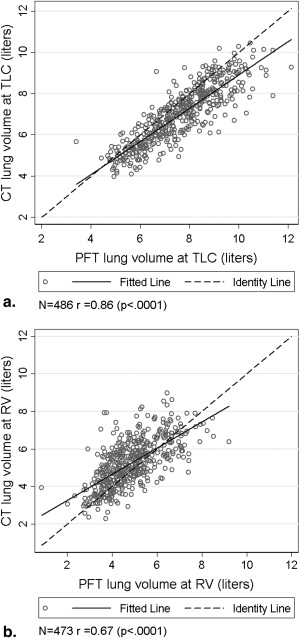
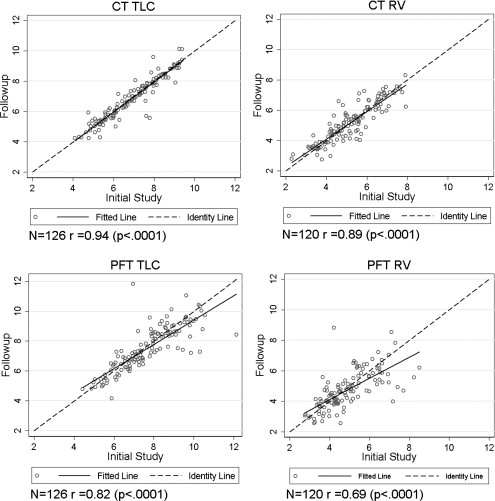
CT imaging and body plethysmography were performed at baseline and after a 9-month interval in multicenter emphysema treatment trials. Lung volumes were measured at total lung capacity (TLC) and at residual volume (RV). Lobar volumes were measured on CT imaging using a semiautomated technique. The correlations between CT and PFT volumes were computed for 486 subjects at baseline. Reproducibility was assessed in terms of the intraclass correlation coefficient (ICC) for 126 subjects from the control group at TLC and 120 subjects at RV.
Results
Correlations between CT and PFT lung volumes were 0.86 at TLC and 0.67 at RV. At TLC, the ICCs were 0.943 for CT imaging and 0.814 for PFT. At RV, the ICCs were 0.886 for CT imaging and 0.683 for PFT. CT lobar volumes showed good reproducibility (all P values < .05).
Conclusion
CT lung and lobar volume measurements could be captured in a multicenter trial setting with high reproducibility and were highly correlated with those obtained on PFT. CT imaging showed significantly better reproducibility than PFT between interval lung volume measurements, offering the potential for designing emphysema treatment trials involving fewer subjects.
Lung volume and density measurements from computed tomographic (CT) imaging play a prominent role in the diagnosis of emphysema . Traditionally, forced expiratory volume in 1 second has been used to measure the progression of emphysema, but destructive changes in lung parenchyma often precede decreases in forced expiratory volume by several years . The quantitative assessment of the lungs using CT imaging provides important complementary information to the results of pulmonary function testing (PFT) because it allows the assessment of single and lobar lung volumes . This ability for the regional measurement of volumes is important in volume reduction treatments for emphysema .
CT lung volumes are playing a key role in clinical trials of new minimally invasive therapies aimed at the reduction of lung volume . These treatments involve placing a one-way valve in the lobar or segmental airway to prevent air from entering these portions of the lung while still allowing air to exit. Reduction in the volume of the treated lobe measured using CT imaging is used to assess atelectasis resulting from the treatment. Therefore, establishing the reproducibility of lung volume measurements is important if they are to be accepted as treatment planning and outcome variables in these trials. In this paper, we report on the reproducibility of CT lung and lobar volume measurements in two parallel multicenter clinical trials. We compared the reproducibility of CT lung volumes against those from PFT.
Materials and methods
Subject Recruitment
Get Radiology Tree app to read full this article<
Get Radiology Tree app to read full this article<
Get Radiology Tree app to read full this article<
Lung Volume Measurements From Body Plethysmography
Get Radiology Tree app to read full this article<
Lung Volume Measurement From CT Imaging
Get Radiology Tree app to read full this article<
Get Radiology Tree app to read full this article<
Get Radiology Tree app to read full this article<
Get Radiology Tree app to read full this article<
Statistical Analysis
Get Radiology Tree app to read full this article<
Get Radiology Tree app to read full this article<
Results
Baseline Characteristics
Get Radiology Tree app to read full this article<
Table 1
Subject Baseline Characteristics
Variable Absolute (Mean ± SD) Range Age (y) 63 ± 7 41–76 PFT TLC (L) 7.62 ± 1.48 3.4–12.14 PFT RV (L) 4.83 ± 1.21 0.86–9.22 CT TLC (L) 6.99 ± 1.38 3.98–10.45 CT RV (L) 5.12 ± 1.26 2.29–8.99 Voxels below −910 HU (%) 56.53 ± 10.30 30.45–81.27
CT, computed tomographic; HU, Hounsfield units; PFT, pulmonary function testing; RV, residual volume; SD, standard deviation; TLC, total lung capacity.
Get Radiology Tree app to read full this article<
Lung Volume Correlations
Get Radiology Tree app to read full this article<
Get Radiology Tree app to read full this article<
Lung Volume Reproducibility
Get Radiology Tree app to read full this article<
Get Radiology Tree app to read full this article<
Get Radiology Tree app to read full this article<
Get Radiology Tree app to read full this article<
Table 2
Summary of the Reproducibility Statistics on Baseline and Follow-Up Lung Volumes From the Control Group From CT Imaging and PFT
CT PFT Parameter Baseline Follow-Up_P_ Difference_r_ ICC Baseline Follow-Up_P_ Difference_r_ ICC TLC volume (L) of control group ( n = 126) 6.93 ± 1.36 6.87 ± 1.42 .18 −0.056 ± 0.467 0.94 ( P < .001) 0.94 7.68 ± 1.50 7.53 ± 1.49 .07 −0.149 ± 0.903 0.82 ( P < .001) 0.81 RV volume (L) of control group ( n = 120) 5.17 ± 1.27 5.16 ± 1.29 .75 −0.018 ± 0.61 0.89 ( P < .001) 0.89 4.90 ± 1.25 4.74 ± 1.25 .0656 −0.17 ± 0.99 0.69 ( P < .001) 0.68
CT, computed tomographic; ICC, intraclass correlation coefficient; PFT, pulmonary function testing; RV, residual volume; TLC, total lung capacity.
Get Radiology Tree app to read full this article<
Get Radiology Tree app to read full this article<
Table 3
Number of Subjects Required to Detect Differences Between Two Visits in TLC Lung Volumes From Two Visits in a Prospective Study with 80% Power at a 5% α Level
Difference in TLC Lung Volume (L) Number of Subjects Required Using CT Imaging Number of Subjects Required Using PFT 0.1 174 641 0.2 45 162 0.3 22 74 0.4 13 42 0.5 9 28
CT, computed tomographic; PFT, pulmonary function testing; TLC, total lung capacity.
Table 4
Study Power When Detecting a Difference in TLC Lung Volume of 0.3 L Between Two Visits for Given Sample Sizes at a 5% α Level
Sample Size Study Power Using CT Lung Volumes Study Power Using PFT Lung Volumes 30 0.9250 0.4206 40 0.9773 0.5356 50 0.9937 0.6342 60 0.9983 0.7161 70 0.9996 0.7825 80 0.9999 0.8353
CT, computed tomographic; PFT, pulmonary function testing.
Get Radiology Tree app to read full this article<
Get Radiology Tree app to read full this article<
Table 5
ICCs Between Lobar Lung Volumes Computed From Two CT Scans at TLC for the RUL, RML, RLL, LUL, and LLL
Lobe Assessed at TLC ICC 95% CI RUL 0.959 0.945–0.973 RML 0.873 0.831–0.914 RLL 0.930 0.907–0.954 LUL 0.970 0.959–0.980 LLL 0.945 0.927–0.964
CI, confidence interval; ICC, intraclass correlation coefficient; LLL, left lower lobe; LUL, left upper lobe; RLL, right lower lobe; RML, right middle lobe; RUL, right upper lobe; TLC, total lung capacity.
Table 6
ICCs Between Lobar Lung Volumes Computed From Two CT Scans at RV for the RUL, RML, RLL, LUL, and LLL
Lobe Assessed at RV ICC 95% CI RUL 0.906 0.874–0.938 RML 0.845 0.794–0.897 RLL 0.913 0.884–0.943 LUL 0.913 0.884–0.943 LLL 0.931 0.908–0.955
CI, confidence interval; ICC, intraclass correlation coefficient; LLL, left lower lobe; LUL, left upper lobe; RLL, right lower lobe; RML, right middle lobe; RUL, right upper lobe; RV, residual volume.
Get Radiology Tree app to read full this article<
Discussion
Get Radiology Tree app to read full this article<
Get Radiology Tree app to read full this article<
Get Radiology Tree app to read full this article<
Get Radiology Tree app to read full this article<
Get Radiology Tree app to read full this article<
Get Radiology Tree app to read full this article<
Get Radiology Tree app to read full this article<
Get Radiology Tree app to read full this article<
Get Radiology Tree app to read full this article<
Get Radiology Tree app to read full this article<
Get Radiology Tree app to read full this article<
Conclusion
Get Radiology Tree app to read full this article<
Get Radiology Tree app to read full this article<
References
1. Muller N.L., Staples C.A., Miller R.R., et. al.: Density mask: an objective method to quantitate emphysema using computed tomography. Chest 1988; 94: pp. 782-787.
2. Uppaluri R., Mitsa T., Sonka M., et. al.: Quantification of pulmonary emphysema from lung computed tomography images. Am J Respir Crit Care Med 1997; 156: pp. 248-254.
3. Kuwano K., Matsuba K., Ikeda T.: The diagnosis of mild centrilobular emphysema: correlation of computed tomography and pathology scores. Am Rev Respir Dis 1990; 141: pp. 169-178.
4. Madani A., Keyzer C., Gevenois P.A.: Quantitative computed tomography assessment of lung structure and function in pulmonary emphysema. Eur Respir J 2001; 18: pp. 720-730.
5. Litmanovich D., Boiselle P.M., Bankier A.A.: CT of pulmonary emphysema-current status, challenges, and future directions. Eur Radiol 2009; 19: pp. 537-551.
6. Gurney J.W., Jones K.K., Robbins R.A., et. al.: Regional distribution of emphysema: correlation of high-resolution CT with pulmonary function tests in unselected smokers. Radiology 1992; 183: pp. 457-463.
7. Brown M.S., McNitt-Gray M.F., Goldin J.G., et. al.: Automated measurement of single and total lung volume from CT. J Comput Assist Tomogr 1999; 23: pp. 632-640.
8. Zhang L., Hoffman E.A., Reinhardt J.M.: Atlas-driven lung lobe segmentation in volumetric x-ray CT images. Proc SPIE 2003; 5032: pp. 309-319.
9. Bae K.T., Slone R.M., Gierada D.S., et. al.: Patients with emphysema: quantitative CT analysis before and after lung volume reduction surgery. Radiology 1997; 203: pp. 207-714.
10. Strange C., Herth F.J., Kovitz K.L., et. al.: Design of the Endobronchial Valve for Emphysema Palliation Trial (VENT): a non-surgical method of lung volume reduction. BMC Pulm Med 2007; 7: pp. 10.
11. Coxson H.O., Nasute Fauerbach P.V., Storness-Bliss C., et. al.: Computed tomography assessment of lung volume changes after bronchial valve treatment. Eur Respir J 2008; 32: pp. 1443-1450.
12. Coxson H.O., Rogers R.M., Whittall K.P., et. al.: The measurement of lung expansion with computed tomography and comparison with quantitative histology. J Appl Physiol 1995; 79: pp. 1525-1530.
13. Brown M.S., McNitt-Gray M.F., Mankovich N.J., et. al.: Method for segmenting chest CT image data using an anatomical model: preliminary results. IEEE Trans Med Imaging 1997; 16: pp. 828-839.
14. Brown M.S., Goldin J.G., McNitt-Gray M.F., et. al.: Knowledge-based segmentation of thoracic CT images for assessment of split lung function. Med Phys 2000; 27: pp. 592-598.
15. Kauczor H.U., Heussel C.P., Fisher B., et. al.: Assessment of lung volumes using helical CT at inspiration and expiration: comparison with pulmonary function tests. AJR Am J Roentgenol 1998; 171: pp. 1091-1095.
16. Pierce R.J., Brown D.J., Denison D.M.: Radiographic, scintigraphic, and gas-dilution estimates of individual lung and lobar volumes in man. Thorax 1980; 35: pp. 773-780.
17. Svanberg L.: Influence of posture on the lung volumes, ventilation and circulation in normals: a spirometric-bronchospirometric investigation. Scand J Clin Lab Invest 1957; 9: pp. 1-195.
18. Bedell G.N., Marshall R., DuBois A., et. al.: Measurement of the volume of gas in the gastrointestinal tract. Values in normal subjects and ambulatory patients. J Clin Invest 1956; 35: pp. 336-345.
19. Clinical Trial to Evaluate the Safety and Effectiveness of the IBV Valve System for the Treatment of Severe Emphysema (IBV Valve). Available at: http://clinicaltrials.gov/ct2/show/NCT00475007 . Accessed July 24, 2009.
20. Gierada D.S., Yusen R.D., Pilgram T.K., et. al.: Repeatability of quantitative CT indexes of emphysema in patients evaluated for lung volume reduction surgery. Radiology 2001; 220: pp. 448-454.
21. Hu S., Hoffman E.A., Reinhardt J.M.: Automatic lung segmentation for accurate quantitation of volumetric x-ray CT images. IEEE Trans Med Imaging 2001; 20: pp. 490-498.
22. Zhou X., Hayashi T., Hara T., et. al.: Automatic segmentation and recognition of anatomical lung structures from high-resolution chest CT images. Comput Med Imaging Graph 2006; 30: pp. 299-313.
23. Aramato S.G., Sensakovic W.F.: Automated lung segmentation for thoracic CT: impact on computer-aided diagnosis. Acad Radiol 2004; 11: pp. 1011-1021.
24. Leader J.K., Zheng B., Rogers R.M., et. al.: Automated lung segmentation in x-ray computed tomography development and evaluation of a heuristic threshold-based scheme. Acad Radiol 2003; 10: pp. 1224-1236.
25. Palagyi K., Tschirren J., Hoffman E., et. al.: Quantitative analysis of pulmonary airway tree structures. Comput Biol Med 2006; 36: pp. 974-976.
26. Tschirren J., Hoffman E., Mclennan G., et. al.: Intrathoracic airway trees: segmentation and airway morphology analysis from low-dose CT scans. IEEE Trans Med Imaging 2005; 24: pp. 1529-1539.
27. Zhang L., Hoffman E.A., Reinhardt J.M.: Atlas-driven lung lobe segmentation in volumetric x-ray CT images. IEEE Trans Med Imaging 2006; 25: pp. 1-16.
28. Revel M.P., Faivre J.B., Remy-Jardin M., et. al.: Automated lobar quantification of emphysema in patients with severe COPD. Eur Radiol 2008; 18: pp. 2723-2730.