
Rationale and Objectives
To evaluate the reproducibility of Modified Response Evaluation Criteria in Solid Tumors (mRECIST) for hepatocellular carcinoma (HCC) after transarterial chemoembolization (TACE) using multiphasic computed tomography.
Materials and methods
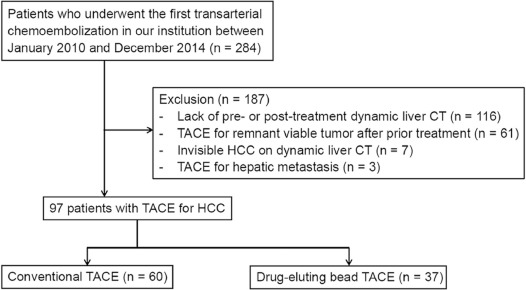
The institutional review board approved this retrospective study. We evaluated 97 patients who underwent TACE (60 conventional TACE [cTACE] and 37 drug-eluting bead TACE [DEB-TACE]) for HCC from 2010 to 2014. Four radiologists evaluated pairs of dynamic liver CTs scanned within 2 months before and after TACE based on mRECIST. Assessment of intra- or interobserver reproducibility for response categorization and sum of long diameter were evaluated using weighted kappa statistics (κ) and intraclass correlation coefficients, respectively. The relationship between concordance of target lesion selection and agreement of target lesion response was evaluated using Fisher exact test.
Results
Intraobserver reproducibility for overall response was moderate to excellent (κ = 0.525–0.865). Interobserver reproducibility was improved on the second review compared to the first review and it was good in both treatment groups (κ = 0.627 for cTACE and 0.602 for DEB-TACE). Between the two treatment methods, intra- or interobserver reproducibility was better after cTACE than DEB-TACE. Intraclass correlation coefficients for sum of long diameter measurement showed excellent intra- or interobserver reproducibility. The concordance rate of target lesion selection was significantly higher for patients with radiologists’ agreement for target lesion response than patients with disagreed response ( P = .003).
Conclusions
The intra- and interobserver reproducibility of mRECIST in patients with HCC after TACE was moderate to excellent, and the reproducibility was slightly better after cTACE than DEB-TACE.
Introduction
Transarterial chemoembolization (TACE) is the standard treatment for patients with hepatocellular carcinoma (HCC) who are classified as Barcelona clinic liver cancer stage B . Conventional transarterial chemoembolization (cTACE) using anticancer drugs with oily radio-opaque contrast medium and drug-eluting bead TACE (DEB-TACE) using beads loaded with chemotherapy agent are the two most commonly performed treatments for the intermediate stage patients with HCC . Treatment response after TACE is usually evaluated based on radiological examinations such as computed tomography (CT) or magnetic resonance imaging . Accurate evaluation of treatment response is important to predict patient prognosis and determine the next treatment methods .
Response Evaluation Criteria in Solid Tumors (RECIST) is the standard method of evaluating treatment response in solid tumors. However, as RECIST is a size-based method and does not take into account tumor necrosis after treatment, limitations in HCC after the locoregional treatments or systemic therapy using molecular-targeting agents were reported, and modified RECIST (mRECIST) was developed . mRECIST is based on tumor viability, which is represented by enhancement on arterial phase imaging, as a decrease in tumor load is more important than a reduction in tumor size in mRECIST.
Get Radiology Tree app to read full this article<
Get Radiology Tree app to read full this article<
Materials and Methods
Patients
Get Radiology Tree app to read full this article<
Get Radiology Tree app to read full this article<
Get Radiology Tree app to read full this article<
Get Radiology Tree app to read full this article<
TACE Protocol
Get Radiology Tree app to read full this article<
Get Radiology Tree app to read full this article<
Get Radiology Tree app to read full this article<
CT Image Acquisition
Get Radiology Tree app to read full this article<
Get Radiology Tree app to read full this article<
Image Analysis
Get Radiology Tree app to read full this article<
Get Radiology Tree app to read full this article<
Data Analyses and Statistical Methods
Get Radiology Tree app to read full this article<
Get Radiology Tree app to read full this article<
Get Radiology Tree app to read full this article<
Get Radiology Tree app to read full this article<
Get Radiology Tree app to read full this article<
Get Radiology Tree app to read full this article<
Get Radiology Tree app to read full this article<
Results
Patient Characteristics
Get Radiology Tree app to read full this article<
TABLE 1
Baseline Characteristics of Patients
All ( n = 97) cTACE ( n = 60) DEB-TACE ( n = 37)P Value Gender (M:F) 72:25 42:18 30:7 .226 Age (mean ± SD) 64.5 ± 10.7 65.9 ± 11.0 64.8 ± 10.3 .615 Etiology (%) .229 HBV 55 (56.7) 35 (58.3) 20 (54.1) HCV 10 (10.3) 3 (5.0) 7 (18.9) Alcohol 13 (13.4) 8 (13.3) 5 (13.5) NANBNC 14 (4.4) 11 (18.3) 3 (8.1) NASH 1 (1.0) 1 (1.7) 0 (0) HBV + alcohol 4 (4.1) 2 (3.3) 2 (5.4) Diagnosis (%) .174 Imaging 87 (89.7) 56 (93.3) 31 (83.8) Biopsy 10 (10.3) 4 (6.7) 6 (16.2) Interval, pre- and post-treatment CT 50.6 ± 18.7 49.9 ± 18.5 51.6 ± 19.3 .674 Interval, pre-treatment CT and treatment 34.8 ± 14.4 34.2 ± 13.9 35.9 ± 15.2 .582 Child-Pugh score 5.5 ± 0.8 5.8 ± 0.8 5.4 ± 0.9 .556 Total bilirubin 1.0 ± 1.0 1.0 ± 1.1 1.0 ± 1.0 .950 Direct bilirubin 0.4 ± 0.7 0.5 ± 0.9 0.3 ± 0.2 .233 AST 55.0 ± 55.1 59.9 ± 45.7 48.7 ± 68.0 .426 ALT 49.3 ± 70.3 47.8 ± 59.3 51.7 ± 86.1 .810 Albumin 4.2 ± 3.7 4.4 ± 4.7 3.9 ± 0.5 .467 Creatinine 1.0 ± 1.0 1.0 ± 0.8 1.1 ± 1.3 .605 WBC 5.3 ± 2.2 5.4 ± 2.2 5.0 ± 2.1 .333 Hemoglobin 13.2 ± 1.9 13.1 ± 1.9 13.5 ± 1.8 .279 Platelet 155.0 ± 78.2 161.6 ± 85.3 144.2 ± 64.6 .258 INR 1.7 ± 1.1 1.1 ± 0.1 1.1 ± 0.1 .546 AFP 2893.6 ± 15279.2 3906.0 ± 19282.5 1251.8 ± 2949.9 .299 PIVKA-II 7236.2 ± 23422.1 10105.7 ± 29257.7 2582.9 ± 4901.4 .125
AFP, alpha fetoprotein; ALT, alanine transaminase; AST, aspartate transaminase; cTACE, conventional transarterial chemoemobolization; DEB-TACE, drug-eluting bead transarterial chemoembolization; HBV, hepatitis B virus; HCV, hepatitis C virus; INR, international normalized ratio; NANBNC, non-A, non-B, non-C hepatitis; PIVKA-II, Protein induced by vitamin K absence or antagonist-II; WBC, white blood cell.
Data are presented as mean ± standard deviation for continuous values and number with proportion in parentheses for categorical values.
P values were calculated using the independent t test or the chi-square test.
Get Radiology Tree app to read full this article<
Intraobserver Reproducibility
Get Radiology Tree app to read full this article<
TABLE 2
Intraobserver Reproducibility
All Patients cTACE DEB-TACE Reader 1 Overall 0.865 0.859 0.872 Target lesion 0.853 0.851 0.847 Nontarget lesion 0.782 0.860 0.600 Reader 2 Overall 0.615 0.588 0.518 Target lesion 0.616 0.547 0.767 Nontarget lesion 0.657 0.651 0 Reader 3 Overall 0.525 0.552 0.471 Target lesion 0.628 0.641 0.564 Nontarget lesion 0.622 0.714 0.333 Reader 4 Overall 0.569 0.648 0.407 Target lesion 0.626 0.683 0.510 Nontarget lesion 0 0 0
Numbers are the weighted kappa values.
cTACE, conventional transarterial chemoemobolization; DEB-TACE, drug-eluting bead transarterial chemoembolization.
TABLE 3
Intraobserver Reproducibility of Sum of Long Diameter (SLD) of Viable Tumor
All Patients cTACE DEB-TACE SLD SLD SLD First Review Second Review ICC \* First Review Second Review ICC \* First Review Second Review ICC \* Reader 1 Pretreatment (cm) 5.96 ± 5.17 5.64 ± 4.80 0.979 6.84 ± 6.14 6.58 ± 5.67 0.980 5.22 ± 2.55 5.08 ± 2.77 0.968 Posttreatment (cm) 2.80 ± 5.58 2.50 ± 5.27 0975 3.54 ± 6.94 3.16 ± 6.72 0.975 1.94 ± 2.10 1.79 ± 2.17 0.967 Change (%) 34.7 ± 41.1 33.2 ± 44.5 0.954 36.6 ± 46.3 29.2 ± 45.6 0.957 35.1 ± 32.5 32.9 ± 37.7 0.946 Reader 2 Pretreatment (cm) 6.74 ± 5.73 6.39 ± 4.28 0.969 7.99 ± 6.89 7.74 ± 5.77 0.970 5.03 ± 2.42 4.91 ± 2.26 0.947 Posttreatment (cm) 3.64 ± 5.90 3.80 ± 5.51 0.971 4.75 ± 7.22 5.26 ± 6.74 0.974 2.07 ± 2.27 1.90 ± 2.33 0.897 Change (%) 40.6 ± 39.7 45.7 ± 41.0 0.890 39.9 ± 39.8 50.1 ± 41.5 0.895 34.9 ± 34.3 33.1 ± 37.7 0.900 Reader 3 Pretreatment (cm) 5.89 ± 4.31 5.92 ± 3.81 0.931 6.60 ± 5.00 6.64 ± 4.33 0.946 4.29 ± 2.16 4.67 ± 2.43 0.777 vPosttreatment (cm) 2.38 ± 4.56 2.42 ± 4.36 0.951 2.95 ± 5.33 2.90 ± 5.15 0.968 1.30 ± 2.11 1.59 ± 2.40 0.762 Change (%) 28.8 ± 38.7 29.6 ± 39.4 0.839 32.7 ± 41.9 30.7 ± 41.6 0.912 25.6 ± 37.6 30.1 ± 38.3 0.685 Reader 4 Pretreatment (cm) 6.20 ± 4.35 6.04 ± 3.88 0.874 7.26 ± 5.08 7.45 ± 4.51 0.866 4.86 ± 2.24 4.98 ± 2.08 0.864 Posttreatment (cm) 3.59 ± 5.26 3.19 ± 4.86 0.882 4.66 ± 6.41 4.02 ± 6.12 0.875 2.13 ± 2.06 2.09 ± 2.03 0.926 Change (%) 45.5 ± 42.7 41.0 ± 41.0 0.858 48.3 ± 47.0 37.3 ± 44.3 0.833 43.0 ± 34.9 39.8 ± 35.8 0.922
cTACE, conventional transarterial chemoembolization; DEB-TACE, drug-eluting beads-transarterial chemoembolization; ICC, intraclass correlation coefficient; SLD, sum of the longest diameter of the target lesions.
Get Radiology Tree app to read full this article<
Get Radiology Tree app to read full this article<
Interobserver Reproducibility
Get Radiology Tree app to read full this article<
TABLE 4
Interobserver Reproducibility of Response Evaluation and SLD Measurement
All cTACE DEB-TACE First Review Second Review First Review Second Review First Review Second Review Overall response categorization 0.577 0.618 0.685 0.627 0.340 0.602 Target lesion response categorization 0.618 0.627 0.638 0.625 0.583 0.643 SLD, Before treatment \* 0.941 0.957 0.939 0.957 0.922 0.924 SLD, After treatment \* 0.947 0.959 0.946 0.968 0.925 0.902 SLD, Change (%) \* 0.907 0.909 0.931 0.946 0.896 0.909 Nontarget lesion response categorization 0.307 0.795 0.323 0.798 0 0.285
cTACE, conventional transarterial chemoembolization; DEB-TACE, drug-eluting beads-transarterial chemoembolization; SLD, sum of the longest diameter of the target lesions.
Reproducibility of response categorization: weighted kappa values.
Reproducibility of SLD: intraclass correlation coefficient.
Get Radiology Tree app to read full this article<
Get Radiology Tree app to read full this article<
Causes of the Variability in Overall Response
Get Radiology Tree app to read full this article<
Get Radiology Tree app to read full this article<
Get Radiology Tree app to read full this article<
Discussion
Get Radiology Tree app to read full this article<
Get Radiology Tree app to read full this article<
Get Radiology Tree app to read full this article<
Get Radiology Tree app to read full this article<
Get Radiology Tree app to read full this article<
Get Radiology Tree app to read full this article<
Get Radiology Tree app to read full this article<
Get Radiology Tree app to read full this article<
Get Radiology Tree app to read full this article<
Acknowledgment
Get Radiology Tree app to read full this article<
Appendix
Get Radiology Tree app to read full this article<
Table A.1
Overall Response Assessment in mRECIST
Target Lesions Nontarget Lesions New Lesions Overall Response CR CR No CR CR IR/SD No PR PR Non-PD No PR SD Non-PD No SD PD Any Yes or no PD Any PD Yes or no PD Any Any Yes PD
mRECIST, modified Response Evaluation Criteria in Solid Tumors; CR, complete response; PR, partial response; IR, incomplete response; SD, stable disease; PD, progressive disease.
Table A.2
Differences in Proportions of Agreement Between Target Lesion, Nontarget Lesion, and Overall Response
Overall response Agreement Disagreement_P_ Value 4 categories (CR, PR, SD, PD) Target Agreement 29 6<.001 Disagreement 4 58 Nontarget Agreement 25 34.047 Disagreement 8 30 New lesion Agreement 10 54 .766 Disagreement 4 29 2 categories (Responder, nonresponder) Target Agreement 60 7<.001 Disagreement 4 26 Nontarget Agreement 49 21 .233 Disagreement 15 12 New lesion Agreement 57 26 .224 Disagreement 7 7
CR, complete response; PR, partial response; SD, stable disease; PD, progressive disease. P values are calculated using the Fisher’s exact test.
Table A.3
Details of Response Assessment From Four Readers for Patients They Disagreed on Showing Overall Response in the Dichotomized Evaluation of the Second Review

Get Radiology Tree app to read full this article<
References
1. Bruix J., Sherman M.: Management of hepatocellular carcinoma: an update. Hepatology 2011; 53: pp. 1020-1022.
2. Casadaban L.C., Minocha J., Bui J.T., et. al.: Conventional ethiodized oil transarterial chemoembolization for treatment of hepatocellular carcinoma: contemporary single-center review of clinical outcomes. AJR Am J Roentgenol 2016; 206: pp. 645-654.
3. Duran R., Chapiro J., Schernthaner R.E., et. al.: Systematic review of catheter-based intra-arterial therapies in hepatocellular carcinoma: state of the art and future directions. Br J Radiol 2015; 88: pp. 20140564.
4. Kallini J.R., Miller F.H., Gabr A., et. al.: Hepatic imaging following intra-arterial embolotherapy. Abdom Radiol (NY) 2016; 41: pp. 600-616.
5. Bruix J., Reig M., Rimola J., et. al.: Clinical decision making and research in hepatocellular carcinoma: pivotal role of imaging techniques. Hepatology 2011; 54: pp. 2238-2244.
6. Gillmore R., Stuart S., Kirkwood A., et. al.: EASL and mRECIST responses are independent prognostic factors for survival in hepatocellular cancer patients treated with transarterial embolization. J Hepatol 2011; 55: pp. 1309-1316.
7. Hyun D., Shin S.W., Cho S.K., et. al.: Efficacy of RECIST and mRECIST criteria as prognostic factors in patients undergoing repeated iodized oil chemoembolization of intermediate stage hepatocellular carcinoma. Acta Radiol 2015; 56: pp. 1437-1445.
8. Kim B.K., Kim K.A., Park J.Y., et. al.: Prospective comparison of prognostic values of modified response evaluation criteria in solid tumours with European Association for the Study of the liver criteria in hepatocellular carcinoma following chemoembolisation. Eur J Cancer 2013; 49: pp. 826-834.
9. Kim D.J., Clark P.J., Heimbach J., et. al.: Recurrence of hepatocellular carcinoma: importance of mRECIST response to chemoembolization and tumor size. Am J Transplant 2014; 14: pp. 1383-1390.
10. Sato Y., Watanabe H., Sone M., et. al.: Tumor response evaluation criteria for HCC (hepatocellular carcinoma) treated using TACE (transcatheter arterial chemoembolization): RECIST (response evaluation criteria in solid tumors) version 1.1 and mRECIST (modified RECIST): JIVROSG-0602. Ups J Med Sci 2013; 118: pp. 16-22.
11. Shim J.H., Han S., Shin Y.M., et. al.: Optimal measurement modality and method for evaluation of responses to transarterial chemoembolization of hepatocellular carcinoma based on enhancement criteria. J Vasc Interv Radiol 2013; 24: pp. 316-325.
12. Yeo D.M., Choi J.I., Lee Y.J., et. al.: Comparison of RECIST, mRECIST, and Choi Criteria for early response evaluation of hepatocellular carcinoma after transarterial chemoembolization using drug-eluting beads. J Comput Assist Tomogr 2014; 38: pp. 391-397.
13. Kim M.N., Kim B.K., Han K.H., et. al.: Evolution from WHO to EASL and mRECIST for hepatocellular carcinoma: considerations for tumor response assessment. Expert Rev Gastroenterol Hepatol 2015; 9: pp. 335-348.
14. Yaghmai V., Besa C., Kim E., et. al.: Imaging assessment of hepatocellular carcinoma response to locoregional and systemic therapy. AJR Am J Roentgenol 2013; 201: pp. 80-96.
15. Shim J.H., Lee H.C., Kim S.O., et. al.: Which response criteria best help predict survival of patients with hepatocellular carcinoma following chemoembolization? A validation study of old and new models. Radiology 2012; 262: pp. 708-718.
16. Lencioni R., Llovet J.M.: Modified RECIST (mRECIST) assessment for hepatocellular carcinoma. Semin Liver Dis 2010; 30: pp. 52-60.
17. Liu Q., Li A., Sun S., et. al.: The true role of mRECIST guideline: does it really estimate viable tumor or merely improve accuracy in hepatocellular carcinoma response evaluation?. J BUON 2014; 19: pp. 398-405.
18. Seyal A.R., Gonzalez-Guindalini F.D., Arslanoglu A., et. al.: Reproducibility of mRECIST in assessing response to transarterial radioembolization therapy in hepatocellular carcinoma. Hepatology 2015; 62: pp. 1111-1121.
19. Kim H.C., Kim A.Y., Han J.K., et. al.: Hepatic arterial and portal venous phase helical CT in patients treated with transcatheter arterial chemoembolization for hepatocellular carcinoma: added value of unenhanced images. Radiology 2002; 225: pp. 773-780.
20. Dioguardi Burgio M., Ronot M., Bruno O., et. al.: Correlation of tumor response on computed tomography with pathological necrosis in hepatocellular carcinoma treated by chemoembolization before liver transplantation. Liver Transpl 2016; 22: pp. 1491-1500.
21. Bargellini I., Bozzi E., Campani D., et. al.: Modified RECIST to assess tumor response after transarterial chemoembolization of hepatocellular carcinoma: CT-pathologic correlation in 178 liver explants. Eur J Radiol 2013; 82: pp. e212-e218.
22. Chiu R.Y., Yap W.W., Patel R., et. al.: Hepatocellular carcinoma post embolotherapy: imaging appearances and pitfalls on computed tomography and magnetic resonance imaging. Can Assoc Radiol J 2016; 67: pp. 158-172.
23. Chung W.S., Lee K.H., Park M.S., et. al.: Enhancement patterns of hepatocellular carcinoma after transarterial chemoembolization using drug-eluting beads on arterial phase CT images: a pilot retrospective study. AJR Am J Roentgenol 2012; 199: pp. 349-359.
24. McErlean A., Panicek D.M., Zabor E.C., et. al.: Intra- and interobserver variability in CT measurements in oncology. Radiology 2013; 269: pp. 451-459.
25. Boatta E., Corona M., Cannavale A., et. al.: Endovascular treatment of hepatocellular carcinoma with drug eluting microparticles (DC-Beads): CT evaluation of response to the treatment. Indian J Radiol Imaging 2013; 23: pp. 126-133.
26. Tacher V., Lin M., Duran R., et. al.: Comparison of existing response criteria in patients with hepatocellular carcinoma treated with transarterial chemoembolization using a 3D quantitative approach. Radiology 2016; 278: pp. 275-284.
27. Donati O.F., Do R.K., Hotker A.M., et. al.: Interreader and inter-test agreement in assessing treatment response following transarterial embolization for hepatocellular carcinoma. Eur Radiol 2015; 25: pp. 2779-2788.
28. Keil S., Barabasch A., Dirrichs T., et. al.: Target lesion selection: an important factor causing variability of response classification in the response evaluation criteria for solid tumors 1.1. Invest Radiol 2014; 49: pp. 509-517.
29. Feinstein A.R., Cicchetti D.V.: High agreement but low kappa: I. The problems of two paradoxes. J Clin Epidemiol 1990; 43: pp. 543-549.
30. Cicchetti D.V., Feinstein A.R.: High agreement but low kappa: II. Resolving the paradoxes. J Clin Epidemiol 1990; 43: pp. 551-558.
31. Bonekamp S., Halappa V.G., Geschwind J.F., et. al.: Unresectable hepatocellular carcinoma: MR imaging after intraarterial therapy. Part II. Response stratification using volumetric functional criteria after intraarterial therapy. Radiology 2013; 268: pp. 431-439.
32. Chapiro J., Wood L.D., Lin M., et. al.: Radiologic-pathologic analysis of contrast-enhanced and diffusion-weighted MR imaging in patients with HCC after TACE: diagnostic accuracy of 3D quantitative image analysis. Radiology 2014; 273: pp. 746-758.