
Rationale and Objectives
We sought to demonstrate the viability of microcomputed tomographic colonography (μCTC) as a tool for monitoring tumorigenesis in mouse models of human colorectal cancer during prospective longitudinal studies. The precision and accuracy of volumetric measurements were determined to assess whether changes in tumor volume over time were readily detectable.
Materials and Methods
All animal studies were conducted under the guidelines set forth by the Institutional Animal Care and Use Committee of the American Association for Assessment and Accreditation of Laboratory Animal Care. μCTC was performed on C57BL/6J (B6) mice carrying the Min allele of Apc , ultimately yielding 18 scans. Assessments of scan quality and tumor volume were both performed once per week over 8 weeks.
Results
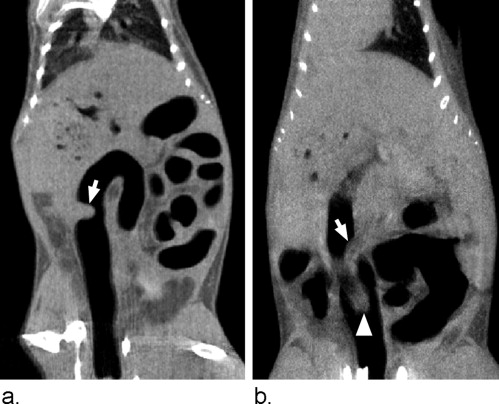
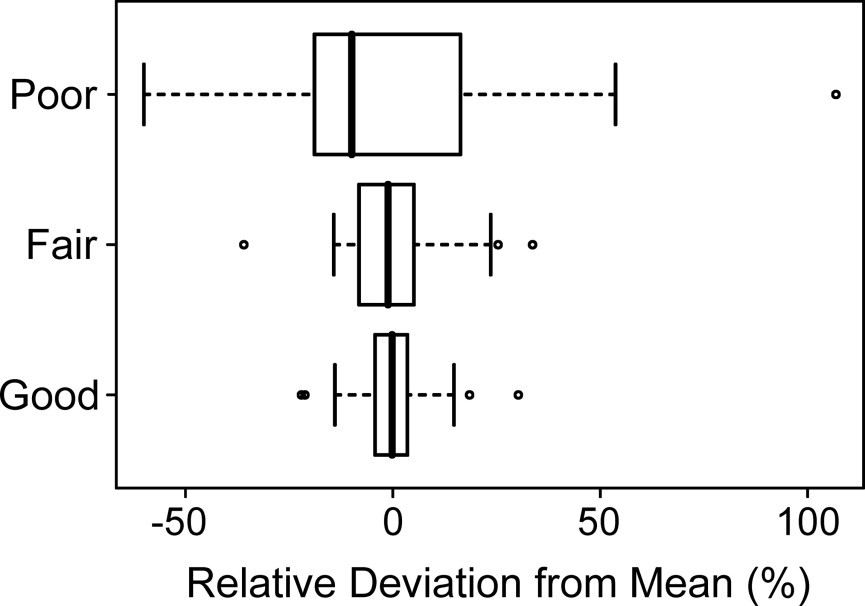
Scans with a good quality rating had a mean standard deviation in tumor volume measurement of 8%. By contrast, scans with a poor quality rating had a mean standard deviation in tumor volume measurement of 35%. Variables affecting μCTC scan quality in living mice included bowel preparation, motion artifact, and tumor morphology. Tumor volume measurements were highly correlated with tumor weight ( r 2 = 0.87).
Conclusions
The reproducibility of tumor volume measurement at μCTC in living mice makes prospective longitudinal evaluation of colonic tumor response feasible. For μCTC scans of good quality, a 16% change in tumor volume can be detected at the 95% confidence level.
Colorectal cancer is the second leading cause of cancer-related mortality in the United States. The American Cancer Society projects 153,760 new cases of colon and rectal cancer for 2007 ( ). Importantly, colorectal cancer is largely preventable if detected early. The 5-year survival rate for a stage I diagnosis is 90% ( ). Unfortunately, only 39% of cases are detected at this stage, owing to low rates of screening and patient compliance ( ). Although optical colonoscopy is the current gold standard for the detection of colorectal neoplasia, computed tomographic colonography (CTC) is rapidly emerging as a viable less invasive alternative. CTC touts the noteworthy advantage of not requiring sedation or pain control. In addition, one study has reported sensitivity comparable to that of optical colonoscopy ( ).
Pickhardt et al described the ability to reliably detect colonic tumors in living mice using microcomputed tomographic colonography (μCTC) ( ). They found that μCTC has good sensitivity (93.3%) and specificity (98.5%) for in vivo detection of polyps with a maximum diameter greater than 2 mm. This experimental platform permits prospective longitudinal evaluation of tumorigenesis in the mammalian colon and has two major advantages over a cross-sectional study design. First, individual tumors can be monitored serially, eliminating animal-to-animal variation and ultimately reducing the number of mice needed to achieve high statistical power ( ). Second, specific tumors can be identified as either responders or nonresponders and then studied ex vivo to assess differences at the molecular level.
Get Radiology Tree app to read full this article<
Get Radiology Tree app to read full this article<
Materials and methods
Mouse Model
Get Radiology Tree app to read full this article<
Bowel Preparation
Get Radiology Tree app to read full this article<
MicroCT Technique
Get Radiology Tree app to read full this article<
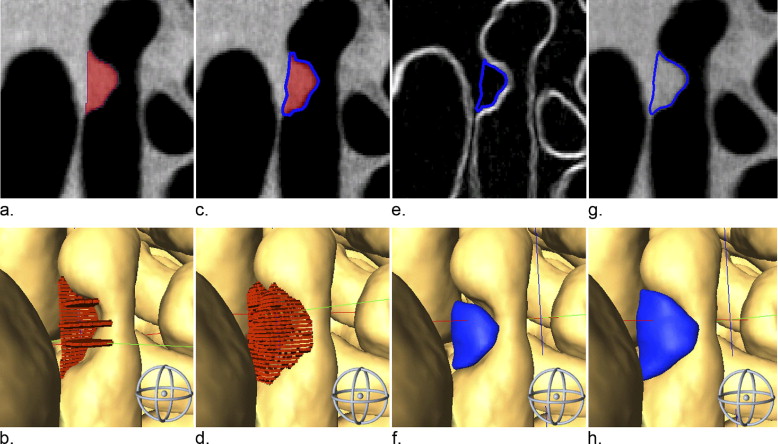
μCTC Scan Analysis
Get Radiology Tree app to read full this article<
Get Radiology Tree app to read full this article<
Table 1
Criteria for Scan Quality Rating of Microcomputed Tomographic Colonography Studies
Rating Criteria Good Meets at least three of the four criteria: good colon distension, no motion artifact, typical polypoid tumor shape, and well-defined tumor margins. Fair Meets two of the four criteria. Poor Meets only one of the four criteria, or else reproducible segmentation is deemed not possible.
Get Radiology Tree app to read full this article<
Get Radiology Tree app to read full this article<
Tumor Volume Measurement
Get Radiology Tree app to read full this article<
Get Radiology Tree app to read full this article<
Get Radiology Tree app to read full this article<
Correlation Coefficient
Get Radiology Tree app to read full this article<
ρX,Y=cov(X,Y)σXσY ρ
X
,
Y
=
cov
(
X
,
Y
)
σ
X
σ
Y
The random variables, X and Y , are volumes defined by two distinct segmentation attempts. The covariance of X and Y is defined by
cov(X,Y)=n∑xyii−∑xi∑yi cov
(
X
,
Y
)
=
n
∑
x
y
i
i
−
∑
x
i
∑
y
i
The product of the sample standard deviations σ X and σ Y is defined by
σXσY=n∑x2i−(∑xi)2.n∑y2i−(∑yi)2 σ
X
σ
Y
=
n
∑
x
i
2
−
(
∑
x
i
)
2
.
n
∑
y
i
2
−
(
∑
y
i
)
2
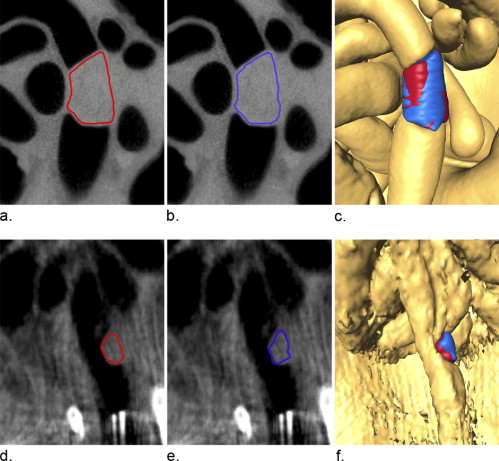
where the sum is from i = 1 to n voxels. The correlation coefficient was an indication of the relative number of voxels in common between two segmented volumes (ie, how well the two volumes match up). A correlation coefficient of 0 indicated no overlap between two volumes in space and a coefficient of 1 indicated perfect alignment with respect to morphology and position.
Get Radiology Tree app to read full this article<
Reader Drift
Get Radiology Tree app to read full this article<
V¯¯¯t=118∑mi=1∑Δj=1Vi,j V
¯
t
=
1
18
∑
i
=
1
m
∑
j
=
1
Δ
V
i
,
j
where t is the trial number or segmentation attempt ranging from 1 through 8, m is the particular mouse, and Δ is the scan number ranging 1 through 18.
Get Radiology Tree app to read full this article<
Recall Bias
Get Radiology Tree app to read full this article<
R¯¯¯t=118∑mi=1∑Δj=1ri,j R
¯
t
=
1
18
∑
i
=
1
m
∑
j
=
1
Δ
r
i
,
j
where t is the segmentation attempt or trial number ranging 1 through 8, m is the particular mouse, and Δ is the scan number ranging 1 through 18.
Get Radiology Tree app to read full this article<
Accuracy
Get Radiology Tree app to read full this article<
Statistical Methods
Get Radiology Tree app to read full this article<
Results
Get Radiology Tree app to read full this article<
Consistency of Scan Rating
Get Radiology Tree app to read full this article<
Table 2
Summary of Reader Consistency in Assessing Scan Quality, Tumor Volume, and Tumor Morphology
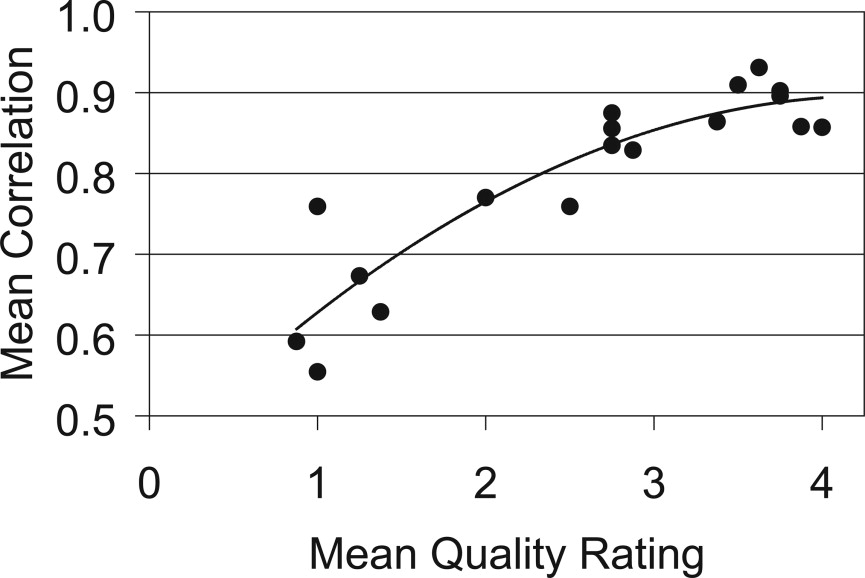
Assessment, Mean ± SD Scan Quality_n_ Quality Rating Tumor Volume (mm 3 ) Correlation Coefficient Good 56 3.7 ± 0.4 16.1 ± 1.3 0.89 ± 0.03 Fair 48 2.6 ± 0.4 11.4 ± 1.6 0.82 ± 0.05 Poor 40 1.1 ± 0.3 8.1 ± 2.6 0.64 ± 0.08
Get Radiology Tree app to read full this article<
Consistency of Tumor Volume Measurement
Get Radiology Tree app to read full this article<
Get Radiology Tree app to read full this article<
Get Radiology Tree app to read full this article<
Table 3
Probability that a Measured Change in Tumor Volume with Good Scans is Real
Measured Change in Tumor Volume (%) Certainty that Change is Real (%) 5% 45% 10 76 15 92 20 98
Get Radiology Tree app to read full this article<
Consistency of Tumor Volume Correlation
Get Radiology Tree app to read full this article<
Get Radiology Tree app to read full this article<
Reader Drift
Get Radiology Tree app to read full this article<
Recall Bias
Get Radiology Tree app to read full this article<
Accuracy of Tumor Volume Measurements
Get Radiology Tree app to read full this article<
Discussion
Get Radiology Tree app to read full this article<
Get Radiology Tree app to read full this article<
Get Radiology Tree app to read full this article<
Get Radiology Tree app to read full this article<
Get Radiology Tree app to read full this article<
References
1. American Cancer Society: Cancer facts & figures 2007.2007.American Cancer SocietyAtlanta, Ga
2. Pickhardt P.J., Choi J.R., Hwang I., et. al.: Computed tomographic virtual colonoscopy to screen for colorectal neoplasia in asymptomatic adults. New Engl J Med 2003; 349: pp. 2191-2200.
3. Pickhardt P.J., Halberg R.B., Taylor A.J., et. al.: Microcomputed tomography colonography for polyp detection in an in vivo mouse tumor model. Proc Natl Acad Sci U S A 2005; 102: pp. 3419-3422.
4. Ware J.H.: Linear models for the analysis of longitudinal studies. Am Stat 1985; 39: pp. 95-101.
5. Yeshwant S.C., Summers R.M., Yao J., et. al.: Polyps: linear and volumetric measurement at CT colonography. Radiology 2006; 241: pp. 802-811.
6. Su L.K., Kinzler K.W., Vogelstein B., et. al.: Multiple intestinal neoplasia caused by a mutation in the murine homolog of the APC gene. Science 1992; 256: pp. 668-670.
7. Quon A., Napel S., Beaulieu C.F., et. al.: “Flying through” and “flying around” a PET/CT scan: pilot study and development of 3D integrated 18F-FDG PET/CT for virtual bronchoscopy and colonoscopy. J Nucl Med 2006; 47: pp. 1081-1087.
8. Magnotta V.A., Heckel D., Andreasen N.C., et. al.: Measurement of brain structures with artificial neural networks: two- and three-dimensional applications. Radiology 1999; 211: pp. 781-790.
9. Heidelberger C., Ansfield F.J.: Experimental and clinical use of fluorinated pyrimidines in cancer chemotherapy. Cancer Res 1963; 23: pp. 1226-1243.