
Rationale and Objectives
To assess the reproducibility of volume computed tomographic perfusion (VPCT) measurements in normal pancreatic tissue using two different kinetic perfusion calculation models at three different time points.
Materials and methods
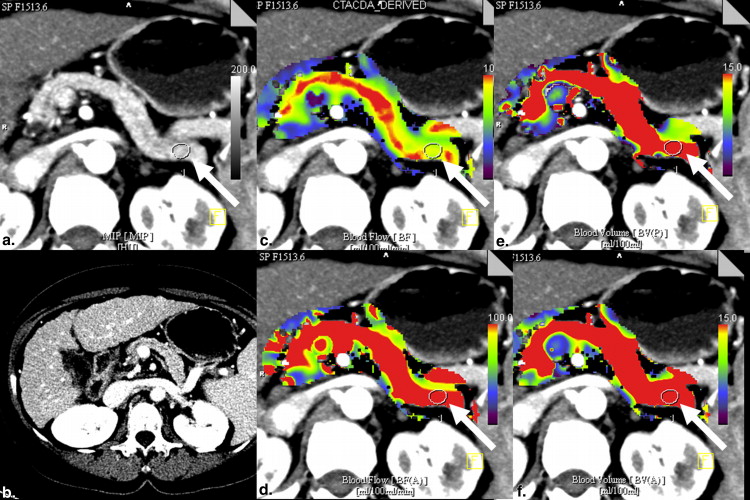
Institutional ethical board approval was obtained for retrospective analysis of pancreas perfusion data sets generated by our prospective study for liver response monitoring to local therapy in patients experiencing unresectable hepatocellular carcinoma, which was approved by the institutional review board. VPCT of the entire pancreas was performed in 41 patients (mean age, 64.8 years) using 26 consecutive volume measurements and intravenous injection of 50 mL of iodinated contrast at a flow rate of 5 mL/s. Blood volume(BV) and blood flow (BF) were calculated using two mathematical methods: maximum slope + Patlak analysis versus deconvolution method. Pancreas perfusion was calculated using two volume of interests. Median interval between the first and the second VPCT was 2 days and between the second and the third VPCT 82 days. Variability was assessed with within-patient coefficients of variation (CVs) and Bland–Altman analyses. Interobserver agreement for all perfusion parameters was calculated using intraclass correlation coefficients (ICCs).
Results
BF and BV values varied widely by method of analysis as did within-patient CVs for BF and BV at the second versus the first VPCT by 22.4%/50.4% (method 1) and 24.6%/24.0% (method 2) measured in the pancreatic head and 18.4%/62.6% (method 1) and 23.8%/28.1% (method 2) measured in the pancreatic corpus and at the third versus the first VPCT by 21.7%/61.8% (method 1) and 25.7%/34.5% (method 2) measured also in the pancreatic head and 19.1%/66.1% (method 1) and 22.0%/31.8% (method 2) measured in the pancreatic corpus, respectively. Interobserver agreement measured with ICC shows fair-to-good reproducibility.
Conclusions
VPCT performed with the presented examinational protocol is reproducible and can be used for monitoring purposes. Best reproducibility was obtained with both methods for BF and with method 2 also for BV data for both follow-up studies.
Volume perfusion computed tomography (VPCT) is an imaging technique enabling the acquisition of functional perfusion-based data complementary to classical morphologic CT diagnostics . Some authors have demonstrated that perfusion measurements can be easily integrated in a normal whole-body CT examinational protocol meant to acquire information about the course of oncologic and inflammatory diseases . For the purpose of performing perfusion-based monitoring of all these disorders, reproducibility of functional parameters is imperative. Some previous reports have dealt with this issue presenting in part contradictory data and emphasizing the role of using standardized examination protocols . Moreover, the calculation kinetic models (compartmental vs. deconvolution) for perfusion quantification differ, and their strengths and limitations have been already reported . These models quantify perfusion parameters and allow pixel-by-pixel calculation of a range of physiological parameters (blood flow [BF], blood volume [BV], mean transit time [MTT], time to peak, and k-trans or flow extraction product, defined as the sum of flow within the microvasculature and capillary permeability) and depiction as parametric maps. The pancreas is a common site for primary and secondary tumors and for inflammatory diseases, therefore, an important anatomic site in which to evaluate appropriate imaging techniques. In addition, the pancreas represents a less mobile organ that allows optimized motion correction and is lying adjacent to the aorta, which is preferentially used, as the arterial input vessel. Our objectives were to assess the variability of perfusion CT measurements in the normal pancreas tissue measured twice by repeat VPCT within 48 hours and once again 3 months later to evaluate the robustness of results delivered by two different kinetic perfusion models.
Materials and methods
Patients and Target Lesions
Our prospective study for liver response monitoring to local therapy in patients experiencing unresectable hepatocellular carcinoma was approved by the institutional review board, written informed consent was obtained from all patients, and the study complied with Health Insurance Portability and Accountability Act regulations. Liver measurements included also the pancreas, so we retrospectively analyzed pancreas perfusion in terms of data reproducibility. Institutional ethical board approval for retrospective analysis of pancreas perfusion was obtained separately for all patients. Inclusion criteria were perfusion of the hole pancreas, normal pancreas function based on the evaluation of amylase and lipase, normal CT morphology, and exclusion of chronic or acute pancreatitis based on laboratory analysis, clinical examination, and CT examination. Exclusion criteria were known chronic or acute pancreatitis, alcohol abuse, elevated amylase and lipase, and morphologic disorders of the pancreas like tumor, fatty, or fibrotic degeneration of the pancreas. Furthermore, patients were excluded from evaluation if the pancreas shows any morphologic disorders or if amylase and lipase showed an increase after transarterial chemoembolisation (TACE). A total of 41 patients (36 men and 5 women; mean age, 64.8 years; range, 37–78 years, respectively) from a cohort of 51 patients were eligible for retrospective perfusion data analysis.
CT Perfusion Scanning Technique
Get Radiology Tree app to read full this article<
CT Perfusion Analysis
Get Radiology Tree app to read full this article<
Get Radiology Tree app to read full this article<
Statistical Analysis
Get Radiology Tree app to read full this article<
Get Radiology Tree app to read full this article<
Results
Get Radiology Tree app to read full this article<
Get Radiology Tree app to read full this article<
Get Radiology Tree app to read full this article<
Get Radiology Tree app to read full this article<
Table 1
Overview of Mean Values Including Ranges and the Within-Patient Coefficient of Variance, Its Confidence Interval, and the ICC (in %) for BF and BV Measured at Three Different Time Points with Two Different Analysis Methods
Location Analysis Method Point of Time BF Within-Patient CV, % (95% CI) ICC, % BV Within-Patient CV, % (95% CI) ICC, % Pancreas head Maximum slope + Patlak 1 73.2 (21.0–116.6) 22.4 (17.1–28.0) 68.3 18.6 (4.2–52.7) 50.4 (37.5–64.5) 61.3 2 75.9 (27.1–112.0) 21.7 (16.6–27.0) 71.5 19.5 (3.4–59.0) 61.8 (45.6–79.8) 54.7 3 71.5 (23.1–120.0) 21.2 (16.1–26.4) 70.6 17.8 (1.73–60.3) 69.8 (51.2–90.6) 50.2 Deconvolution 1 116.4 (57.6–193.9) 24.6 (18.8–30.8) 45.2 22.9 (2.9–41.6) 24.0 (18.3–30.0) 63.5 2 118.0 (72.0–267.9) 25.7 (19.6–32.2) 50.3 22.7 (4.0–36.0) 34.5 (26.5–43.5) 47.4 3 111.3 (41.1–183.2) 28.4 (21.6–35.7) 42.4 23.7 (4.6–37.0) 33.2 (26.1–41.8) 54.1 Pancreas tail Maximum slope + Patlak 1 78.3 (34.0–101.9) 18.4 (14.1–22.9) 63.5 16.5 (1.2–42.3) 62.6 (46.2–80.9) 54.6 2 79.3 (23.8–117.0) 19.1 (14.6–23.7) 70.7 20.6 (4.4–56.0) 66.1 (48.6–85.6) 43.3 3 75.8 (26.2–134.7) 27.0 (20.5–33.8) 53.4 18.4 (2.0–56.0) 74.4 (54.4–97.0) 30.8 Deconvolution 1 123.1 (60.4–192.8) 24.0 (18.3–29.9) 50.2 22.2 (8.3–37.2) 28.1 (21.4–35.3) 51.0 2 125.3 (45.04–237.1) 22.0 (16.8–27.4) 56.7 23.4 (9.5–36.5) 31.8 (24.1–40.0) 48.5 3 112.8 (41.1–183.4) 31.4 (23.7–39.5) 40.8 24.1 (7.1–41.0) 28.7 (21.8–36.1) 46.7
BF, blood flow; BV, blood volume; CI, confidence interval; CV, coefficient of variation; ICC, intraclass correlation coefficient.
Get Radiology Tree app to read full this article<
Results of Maximum Slope and Patlak Kinetic Modeling
Get Radiology Tree app to read full this article<
Get Radiology Tree app to read full this article<
Get Radiology Tree app to read full this article<
Results of Deconvolution Kinetic Method
Get Radiology Tree app to read full this article<
Get Radiology Tree app to read full this article<
Get Radiology Tree app to read full this article<
Discussion
Get Radiology Tree app to read full this article<
Get Radiology Tree app to read full this article<
Get Radiology Tree app to read full this article<
Get Radiology Tree app to read full this article<
Get Radiology Tree app to read full this article<
Get Radiology Tree app to read full this article<
Get Radiology Tree app to read full this article<
Get Radiology Tree app to read full this article<
Conclusion
Get Radiology Tree app to read full this article<
References
1. Ippolito D., Sironi S., Pozzi M., et. al.: Perfusion CT in cirrhotic patients with early stage hepatocellular carcinoma: assessment of tumor-related vascularization. European journal of radiology 2010; 73: pp. 148-152.
2. Spira D., Neumeister H., Spira S.M., et. al.: Assessment of tumor vascularity in lung cancer using volume perfusion CT (VPCT) with histopathologic comparison: a further step toward an individualized tumor characterization. Journal of computer assisted tomography 2013; 37: pp. 15-21.
3. Singh J., Sharma S., Aggarwal N., et. al.: Role of perfusion CT differentiating hemangiomas from malignant hepatic lesions. Journal of clinical imaging science 2014; 4: pp. 10.
4. Soares B.P., Chien J.D., Wintermark M.: MR and CT monitoring of recanalization, reperfusion, and penumbra salvage: everything that recanalizes does not necessarily reperfuse!. Stroke; a journal of cerebral circulation 2009; 40: pp. S24-S27.
5. Delrue L., Blanckaert P., Mertens D., et. al.: Tissue perfusion in pathologies of the pancreas: assessment using 128-slice computed tomography. Abdominal imaging 2012; 37: pp. 595-601.
6. Kandel S., Kloeters C., Meyer H., et. al.: Whole-organ perfusion of the pancreas using dynamic volume CT in patients with primary pancreas carcinoma: acquisition technique, post-processing and initial results. European radiology 2009; 19: pp. 2641-2646.
7. Ketelsen D., Horger M., Buchgeister M., et. al.: Estimation of radiation exposure of 128-slice 4D-perfusion CT for the assessment of tumor vascularity. Korean journal of radiology: official journal of the Korean Radiological Society 2010; 11: pp. 547-552.
8. Lu N., Feng X.Y., Hao S.J., et. al.: 64-slice CT perfusion imaging of pancreatic adenocarcinoma and mass-forming chronic pancreatitis. Academic radiology 2011; 18: pp. 81-88.
9. Spira D., Adam P., Linder C., et. al.: Perfusion and flow extraction product as potential discriminators in untreated follicular and diffuse large B cell lymphomas using volume perfusion CT with attempt at histopathologic explanation. AJR American journal of roentgenology 2012; 198: pp. 1239-1246.
10. Grozinger G., Balletshofer B., Horger M.: Volume perfusion CT image of an inflammatory infrarenal aortic aneurysm. Rheumatology 2013; 52: pp. 459.
11. Lee S.M., Lee H.J., Kim J.I., et. al.: Adaptive 4D volume perfusion CT of lung cancer: effects of computerized motion correction and the range of volume coverage on measurement reproducibility. AJR American journal of roentgenology 2013; 200: pp. W603-W609.
12. Mazzei M.A., Squitieri N.C., Sani E., et. al.: Differences in perfusion CT parameter values with commercial software upgrades: a preliminary report about algorithm consistency and stability. Acta radiologica 2013; 54: pp. 805-811.
13. Ng C.S., Kodama Y., Mullani N.A., et. al.: Tumor blood flow measured by perfusion computed tomography and 15O-labeled water positron emission tomography: a comparison study. Journal of computer assisted tomography 2009; 33: pp. 460-465.
14. Garcia-Figueiras R., Goh V.J., Padhani A.R., et. al.: CT perfusion in oncologic imaging: a useful tool?. AJR American journal of roentgenology 2013; 200: pp. 8-19.
15. Li H.O., Sun C., Xu Z.D., et. al.: Low-dose whole organ CT perfusion of the pancreas: preliminary study. Abdominal imaging 2014; 39: pp. 40-47.
16. Miles K.A., Lee T.Y., Goh V., et. al.: Current status and guidelines for the assessment of tumour vascular support with dynamic contrast-enhanced computed tomography. European radiology 2012; 22: pp. 1430-1441.
17. Rosner B.: Fundamentals of biostatistics.6th2006.Thomson-Brooks/ColeBelmont, CA
18. Ng C.S., Chandler A.G., Wei W., et. al.: Reproducibility of perfusion parameters obtained from perfusion CT in lung tumors. AJR American journal of roentgenology 2011; 197: pp. 113-121.
19. Goh V., Halligan S., Hugill J.A., et. al.: Quantitative assessment of tissue perfusion using MDCT: comparison of colorectal cancer and skeletal muscle measurement reproducibility. AJR Am J Roentgenol 2006; 187: pp. 164-169.
20. Bol A., Melin J.A., Vanoverschelde J.L., et. al.: Direct comparison of [13N]ammonia and [15O]water estimates of perfusion with quantification of regional myocardial blood flow by microspheres. Circulation 1993; 87: pp. 512-525.
21. Gillard J.H., Minhas P.S., Hayball M.P., et. al.: Assessment of quantitative computed tomographic cerebral perfusion imaging with H2(15)O positron emission tomography. Neurological research 2000; 22: pp. 457-464.
22. Mullani N.A., Herbst R.S., O’Neil R.G., et. al.: Tumor blood flow measured by PET dynamic imaging of first-pass 18F-FDG uptake: a comparison with 15O-labeled water-measured blood flow. Journal of nuclear medicine: official publication, Society of Nuclear Medicine 2008; 49: pp. 517-523.
23. Ng C.S., Chandler A.G., Wei W., et. al.: Effect of dual vascular input functions on CT perfusion parameter values and reproducibility in liver tumors and normal liver. Journal of computer assisted tomography 2012; 36: pp. 388-393.
24. Kok M., Mihl C., Mingels A.A., et. al.: Influence of contrast media viscosity and temperature on injection pressure in computed tomographic angiography: a phantom study. Invest Radiol 2014; 49: pp. 217-223.
25. Watanabe S., Katada Y., Gohkyu M., et. al.: Liver perfusion CT during hepatic arteriography for the hepatocellular carcinoma: dose reduction and quantitative evaluation for normal- and ultralow-dose protocol. European journal of radiology 2012; 81: pp. 3993-3997.
26. Tsushima Y., Kusano S.: Age-dependent decline in parenchymal perfusion in the normal human pancreas: measurement by dynamic computed tomography. Pancreas 1998; 17: pp. 148-152.
27. Tsushima Y., Miyazaki M., Taketomi-Takahashi A., et. al.: Feasibility of measuring human pancreatic perfusion in vivo using imaging techniques. Pancreas 2011; 40: pp. 747-752.
28. Sheiman R.G., Sitek A.: Feasibility of measurement of pancreatic perfusion parameters with single-compartment kinetic model applied to dynamic contrast-enhanced CT images. Radiology 2008; 249: pp. 878-882.
29. de Langen A.J., Lubberink M., Boellaard R., et. al.: Reproducibility of tumor perfusion measurements using 15O-labeled water and PET. Journal of nuclear medicine: official publication, Society of Nuclear Medicine 2008; 49: pp. 1763-1768.
30. Fiorella D., Heiserman J., Prenger E., et. al.: Assessment of the reproducibility of postprocessing dynamic CT perfusion data. AJNR American journal of neuroradiology 2004; 25: pp. 97-107.