
Rationale and Objectives
To determine whether response to anti-angiogenic therapy in patients with multiple myeloma can be assessed by noncontrast perfusion magnetic resonance imaging (MRI) (ie, arterial-spin-labeling [ASL]), and diffusion-weighted [DWI] MRI.
Materials and Methods
The study protocol was approved by the local institutional ethic board. Ten consecutive patients (eight men, two women; mean age 60.5 ± 8.5 years) with Stage III multiple myeloma were prospectively included. MRI was performed at baseline, as well as 3 and 8 weeks after onset of antiangiogenic therapy. Functional MRI data were compared with clinical outcome and conventional lesion size and signal-intensity measurements. Differences between baseline and follow-up values for ASL-MRI and DWI-MRI were assessed using a paired Student t -test.
Results
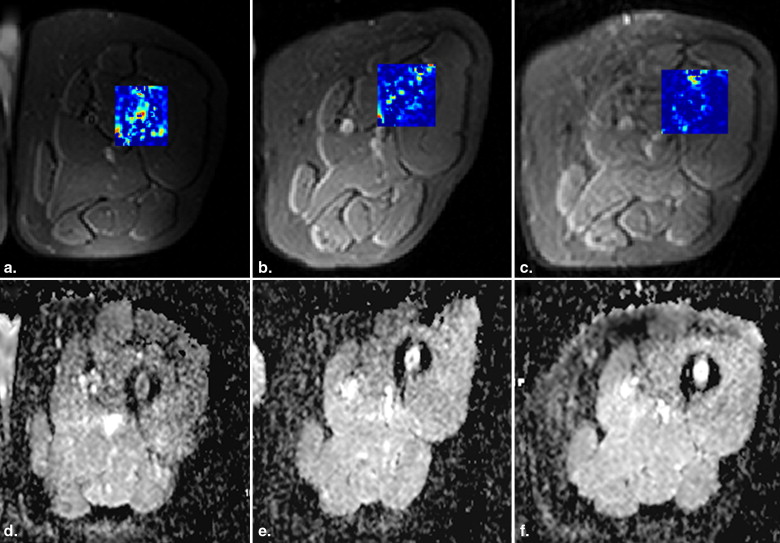
Nine patients responded well to therapy, whereas one patient was classified a nonresponder. Temporary changes in signal intensity between baseline and follow-up examinations were inconsistent on T1-weighted (w) and T2w images. Likewise, determination of lesion size at follow-up proved unreliable. ASL showed a marked decrease in perfusion from baseline (251 ± 159 mL/(min*100g)) to follow-up at 3 weeks (115 ± 85 mL/(min*100g), P = .01) and 8 weeks (101 ± 90 mL/(min*100g, P = .01), respectively. Relative to the baseline examination, mean diffusion increased from 0.68 ± 0.19 × 10 −3 s/mm 2 at baseline to 0.94 ± 0.24 × 10 −3 s/mm 2 after 3 weeks ( P = .04), and 0.96 ± 0.40 × 10 −3 s/mm 2 after 8 weeks ( P = .049). Both methods were able to correctly classify 9/10 patients as responder or nonresponder.
Conclusion
ASL perfusion as well as DWI-MRI provide accurate, clinically relevant information regarding tumor viability and can predict response already early after therapy onset, as opposed to classical lesion size and MRI signal-intensity measurements.
Multiple myeloma is an incurable malignant disease of clonal adult plasma cells that accumulate in the bone marrow displacing normal hematopoietic constituents and causing bone destruction. Tumor angiogenesis plays an important role in myeloma progression , as angiogenesis parallels disease activity and is expected to return to normal state after successful chemotherapy . Although immunohistologic evaluation is considered the “gold standard” for detection and quantification of neovascularization, this method has also limitations (eg, sampling error) and represents an invasive tool, which cannot be implemented for repeated routine therapy response monitoring. Traditionally, therapeutic response has been assessed by using serial tumor size measurements. However, assessment of new therapeutics such as antiangiogenic agents has highlighted the limitations associated with standard morphologic measurements. With these novel agents, tumor response may be better assessed by tissue perfusion, more closely representing vascular supply, rather than size or signal intensity. Therefore, biomarkers for tumor microcirculation, including dynamic contrast–enhanced magnetic resonance imaging (DCE-MRI) or arterial-spin-labeling (ASL) MRI have been tested as noninvasive techniques in tumor patients. Classically, DCE-MRI has been used as a noninvasive method for investigation of microvascular structure and function by tracking the pharmacokinetics of injected contrast agents as they pass through the tumor vasculature. This technique provides a means for the assessment of blood vessel density, vascular flow and permeability, and proved as valuable indicator for assessing tumor angiogenic activity and tumor neovascularization helping to identify patients who would benefit from therapeutics targeting the microcirculation . One major limitation of this technique is the need of intravenous contrast agent administration, which is, given new concerns about the safety of some gadolinium-based preparations in individuals with renal impairment, often contraindicated in myeloma patients. Thus, in a substantial subgroup of patients with multiple myeloma presenting with impaired renal function any alternative noncontrast technique yielding accurate results with respect to myeloma perfusion would be of considerable value.
ASL is a technique that selectively alters the magnetization of inflowing arterial blood and uses this as an endogenous tracer for quantification of tissue perfusion. This approach, therefore, excludes the need for an intravenous bolus contrast material injection and provides important functional information with respect to the viability and vascular supply of the tumor, both of which can not be acquired by means of conventional computed tomography (CT) and MRI. Furthermore, quantitative ASL perfusion measurements proved very robust while reimaging the same subject showing less than 10% change .
Get Radiology Tree app to read full this article<
Get Radiology Tree app to read full this article<
Materials and methods
Subjects
Get Radiology Tree app to read full this article<
Get Radiology Tree app to read full this article<
MRI Examination
Get Radiology Tree app to read full this article<
Get Radiology Tree app to read full this article<
Get Radiology Tree app to read full this article<
Image Analysis
Get Radiology Tree app to read full this article<
Get Radiology Tree app to read full this article<
Get Radiology Tree app to read full this article<
f=λ2TIΔM(TI)M0exp(TIT1) f
=
λ
2
T
I
Δ
M
(
T
I
)
M
0
exp
(
T
I
T
1
)
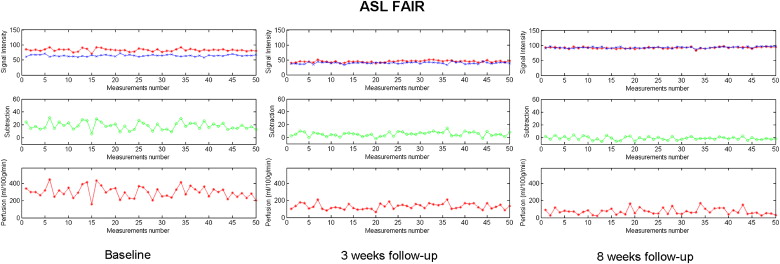
Magnitude images with slice selective and global inversion were collected in two sets. Magnitude images of each set were averaged and the final images were subtracted on a standalone PC using a self-developed routine written in Matlab (The MathWorks, Inc, Natick, MA). Analysis and postprocessing of MRI data were conducted by the same radiologist in all subjects.
Get Radiology Tree app to read full this article<
Get Radiology Tree app to read full this article<
Response to Therapy
Get Radiology Tree app to read full this article<
Get Radiology Tree app to read full this article<
Statistical Analysis
Get Radiology Tree app to read full this article<
Results
Get Radiology Tree app to read full this article<
Table 1
MRI and Hematologic Data in Patients with Multiple Myeloma Receiving Antiangiogenic Therapy (Nine Responders, One Nonresponder)
Baseline 3-week Follow-up 8-week Follow-up Lesion size T 1 (cm 2 ) 1.43 ± 1.13 1.30 ± 1.10 (−9.1%) ns 1.19 ± 1.23 (−16.8%) ns Signal intensity T 1 (a.u.) 235 ± 85 254 ± 115 (8.2%) ns 227 ± 174 (−3.2%) ns Signal intensity T 2 (a.u.) 236 ± 216 206 ± 173 (−12.8%) ns 210 ± 132 (−11.0%) ns Serum IgG/IgA/LC NA NA (−54.7%) NA (−66.5%) β2-microglobulin (mg/dL) 4.10 ± 2.32 2.23 ± 0.72 (−45.6%) ns 2.11 ± 0.90 (−48.5%) ∗ ASL (mL/[min ∗ 100g]) 251 ± 159 115 ± 85 (−54.2%) ∗ 101 ± 90 (−59.8%) ∗ DWI (ADC value) (×10 −3 s/mm 2 ) 0.68 ± 0.19 0.94 ± 0.24 (39.5%) ∗ 0.96 ± 0.40 (42.1%) ∗
a.u., artificial units; ASL, arterial spin labeling; DWI, diffusion weighted imaging; ADC, apparent diffusion coefficient; IgG, immunoglobulin gamma; IgA, immunoglobulin alpha; LC, light chains; NA, not applicable; ns, not significant.
Percent change of mean versus baseline is given in parenthesis. For serum IgG/IgA/LC, no absolute values are given, because those hematologic parameters exhibit different ranges of normal values.
Get Radiology Tree app to read full this article<
Get Radiology Tree app to read full this article<
Missing Data
Get Radiology Tree app to read full this article<
FAIR ASL Perfusion
Get Radiology Tree app to read full this article<
![Figure 1, FAIR ASL perfusion (in mL/[min * 100g]) and ADC values (DWI [×10 –6 s/mm 2 ]) are given as median (middle horizontal line) of the 10 patients for baseline examinations, 3 weeks and 8 weeks after onset of anti-angiogenic therapy. Furthermore, data range ( small horizontal lines ) as well as 95% confidence intervals ( upper and lower boundary of the box plots ) for median values are presented. Statistically significant differences versus baseline are evident after 3 weeks and 8 weeks (* P < .05). FAIR, flow-sensitive alternating inversion recovery; ASL, arterial-spin-labeling; DWI, diffusion weighted imaging; ADC, apparent diffusion coefficient.](https://storage.googleapis.com/dl.dentistrykey.com/clinical/ResponseAssessmentinPatientswithMultipleMyelomaduringAntiangiogenicTherapyusingArterialSpinLabelingandDiffusionWeightedImaging/0_1s20S1076633210004162.jpg)
Get Radiology Tree app to read full this article<
Diffusion Measurements
Get Radiology Tree app to read full this article<
Hematologic Parameters
Get Radiology Tree app to read full this article<
Lesion Size and T1w/T2w Signal Intensity
Get Radiology Tree app to read full this article<
Get Radiology Tree app to read full this article<
Table 2
Functional and Morphologic MRI Data in Comparison to Patient Outcome
Patient No. Patient Data Outcome ASL DWI Lesion Size ∗ SI T 1 w SI T 2 w 1 67, M Response_Increase_
(+21%; NA) Increase
(+218%; NA) Decrease Increase Increase 2 60, M Response Decrease
(−81%; −94%) Increase
(+19%; +97%) Decrease_No change_ Increase 3 65, F Response Decrease
(−31%; −55%) Increase
(+23%; +33%) Decrease Decrease Decrease 4 54, M No response Increase
(−11%; +38%) Decrease
(−38%; −31%)No change Decrease Decrease 5 68, M Response Decrease
(−32%; −81%) Increase
(+122%; +59%)No change Increase_No change_ 6 70, M Response Decrease
(−75%; −73%)Decrease
(−10%; −28%)__No change__No change__No change 7 69, F Response Decrease
(−99%; −99%) Increase
(+110%; +34%) Decrease_No change_ Increase 8 49, M Response Decrease
(−32%; −34%) Increase
(+20%; +43%)No change Decrease Decrease 9 48, M Response Decrease
(−64%; −83%) Increase
(+25%; +72%)No change__No change Decrease 10 55, M Response Decrease
(−39%; −53%) Increase
(+60%; +67%)No change__No change__No change
ASL, arterial spin labeling; DCE, dynamic contrast-enhanced MRI perfusion; DWI, diffusion-weighted imaging; SI, signal intensity; MRI, magnetic resonance imaging.
Noncorrelating MRI parameters are in italic. Percent changes versus baseline are given in parenthesis (3 weeks’ follow-up; 8 weeks’ follow-up).
Get Radiology Tree app to read full this article<
Get Radiology Tree app to read full this article<
Get Radiology Tree app to read full this article<
Discussion
Get Radiology Tree app to read full this article<
Get Radiology Tree app to read full this article<
Get Radiology Tree app to read full this article<
Get Radiology Tree app to read full this article<
Get Radiology Tree app to read full this article<
Get Radiology Tree app to read full this article<
Get Radiology Tree app to read full this article<
Get Radiology Tree app to read full this article<
Get Radiology Tree app to read full this article<
References
1. Hose D., Moreaux J., Meissner T., et. al.: Induction of angiogenesis by normal and malignant plasma cells. Blood 2009; 114: pp. 128-143.
2. Sezer O., Jakob C., Eucker J., et. al.: Serum levels of the angiogenic cytokines basic fibroblast growth factor (bFGF), vascular endothelial growth factor (VEGF) and hepatocyte growth factor (HGF) in multiple myeloma. Eur J Haematol 2001; 66: pp. 83-88.
3. Kumar S., Fonseca R., Dispenzieri A., et. al.: Bone marrow angiogenesis in multiple myeloma: effect of therapy. Br J Haematol 2002; 119: pp. 665-671.
4. Hillengass J., Wasser K., Delorme S., et. al.: Lumbar bone marrow microcirculation measurements from dynamic contrast-enhanced magnetic resonance imaging is a predictor of event-free survival in progressive multiple myeloma. Clin Cancer Res 2007; 13: pp. 475-481.
5. Warmuth C., Gunther M., Zimmer C.: Quantification of blood flow in brain tumors: comparison of arterial spin labeling and dynamic susceptibility-weighted contrast-enhanced MR imaging. Radiology 2003; 228: pp. 523-532.
6. Shih T.T., Hou H.A., Liu C.Y., et. al.: Bone marrow angiogenesis magnetic resonance imaging in patients with acute myeloid leukemia: peak enhancement ratio is an independent predictor for overall survival. Blood 2009; 113: pp. 3161-3167.
7. Tuncbilek N., Kaplan M., Altaner S., et. al.: Value of dynamic contrast-enhanced MRI and correlation with tumor angiogenesis in bladder cancer. Am J Roentgenol 2009; 192: pp. 949-955.
8. Parkes L.M., Rashid W., Chard D.T., et. al.: Normal cerebral perfusion measurements using arterial spin labeling: reproducibility, stability, and age and gender effects. Magn Reson Med 2004; 51: pp. 736-743.
9. Takeuchi M., Matsuzaki K., Nishitani H.: Diffusion-weighted magnetic resonance imaging of endometrial cancer: differentiation from benign endometrial lesions and preoperative assessment of myometrial invasion. Acta Radiol 2009; 50: pp. 947-953.
10. Blade J., Samson D., Reece D., et. al.: Criteria for evaluating disease response and progression in patients with multiple myeloma treated by high-dose therapy and haemopoietic stem cell transplantation. Myeloma Subcommittee of the EBMT. European Group for Blood and Marrow Transplant. Br J Haematol 1998; 102: pp. 1115-1123.
11. Hillengass J., Zechmann C., Bäuerle T., et. al.: Dynamic contrast-enhanced magnetic resonance imaging identifies a subgroup of patients with asymptomatic monoclonal plasma cell disease and pathologic microcirculation. Clin Cancer Res 2009; 15: pp. 3118-3125.
12. Rahmouni A., Montazel J.L., Divine M., et. al.: Bone marrow with diffuse tumor infiltration in patients with lymphoproliferative diseases: dynamic gadolinium-enhanced MR imaging. Radiology 2003; 229: pp. 710-717.
13. Nosàs-Garcia S., Moehler T., Wasser K., et. al.: Dynamic contrast-enhanced MRI for assessing the disease activity of multiple myeloma: a comparative study with histology and clinical markers. J Magn Reson Imaging 2005; 22: pp. 154-162.
14. Raab M.S., Podar K., Breitkreutz I., et. al.: Multiple myeloma. Lancet 2009; 374: pp. 324-339.
15. Baur A., Bartl R., Pellengahr C., et. al.: Neovascularization of bone marrow in patients with diffuse multiple myeloma: a correlative study of magnetic resonance imaging and histopathologic findings. Cancer 2004; 101: pp. 2599-2604.
16. Kwee T.C., Quarles van Ufford H.M., Beek F.J., et. al.: Whole-body MRI, including diffusion-weighted imaging, for the initial staging of malignant lymphoma: comparison to computed tomography. Invest Radiol 2009; 44: pp. 683-690.
17. Silvera S., Oppenheim C., Touze E., et. al.: Spontaneous intracerebral hematoma on diffusion-weighted images: influence of T2-shine-through and T2-blackout effects. AJNR Am J Neuroradiol 2005; 26: pp. 236-241.
18. Noguchia T., Yoshiuraa T., Hiwatashia A., et. al.: Perfusion imaging of brain tumors using arterial spin-labeling: correlation with histopathologic vascular density. AJNR Am J Neuroradiol 2008; 29: pp. 688-693.
19. Durie B.G.M.: The role of anatomic and functional staging in myeloma: description of Durie/Salmon plus staging system. Eur J Cancer 2006; 42: pp. 1539-1543.
20. Dimopoulos M., Terpos E., Comenzo R.L., et. al.: International myeloma working group consensus statement and guidelines regarding the current role of imaging techniques in the diagnosis and monitoring of multiple myeloma. Leukemia 2009; 23: pp. 1545-1556.