
Rationale and Objective
Every year, the American Association of Academic Chief Residents in Radiology conducts a survey of the chief residents in accredited radiology training programs in North America. The survey serves as a tool for gathering information, sharing ideas, and voicing opinions.
Materials and Methods
An online survey was made available to the chief residents from 187 training programs in North America. Questions were presented in multiple-choice and free response formats, designed to address many issues ranging from program structure to on-call policies, changes for the new board examination format and fellowships, and the effects of health care reform on radiology practices. The results of the survey were tabulated and responses to the repeated questions were compared with those from earlier surveys dating to 2003.
Results
Among those surveyed, 185 individual responses representing 135 unique programs were completed, yielding a 73% response rate. Thirty-eight percent of programs responded from the northeast and 17% of programs responded from the southeast. Nineteen percent of responses were from central United States, 14% of responses were from western United States, and 12% of responses were from Canada.
Conclusions
There is an increasing number of programs, which cover more hospitals, during the past decade. There are more programs providing ultrasound and magnetic resonance services after hours, with an associated increase in after-hours attending physician coverage. Many changes are being made for the future board examination format. Health care reform is affecting how residents are preparing themselves for their future practices.
The American Association of Academic Chief Residents in Radiology (A 3 CR 2 ) includes chief residents from all accredited radiology programs, including university, community, and military hospitals. The organization meets annually to discuss issues related to the training of diagnostic radiology residents. In addition, the A 3 CR 2 conducts an annual survey of resident training programs and presents the data at the annual A 3 CR 2 meeting held in conjunction with the Association of University Radiologists meeting .
The survey has been conducted since 1971, and the database is maintained at the Mallinckrodt Institute of Radiology . The survey is intended to not only to analyze trends regarding residency programs but also address the current issues that radiology programs face and provide information regarding the changes that many programs are making in the future . Survey questions are generated by the chief residents at the Mallinckrodt Institute of Radiology. Questions are added or changed by the chief residents and several faculty members of Mallinckrodt to address residency program issues that are discussed at A 3 CR 2 throughout the year. These questions are then proposed to the Steering Committee of the A 3 CR 2 for final changes. Programs with more than one chief resident were asked to select one representative to state their institution’s name and answer program-specific questions. Any duplicate answers from the same institution were removed after responses were collected. The following data represent the results from the survey conducted from February 14–24, 2012, discussing trends in program characteristics, resident benefits, chief resident roles, call structure, the effects of the changing board examination, fellowships, the impact of the current economy and health care reform, and performance and quality improvement projects. In the following sections, unless otherwise noted, there are no changes in the data compared to the previous year’s data.
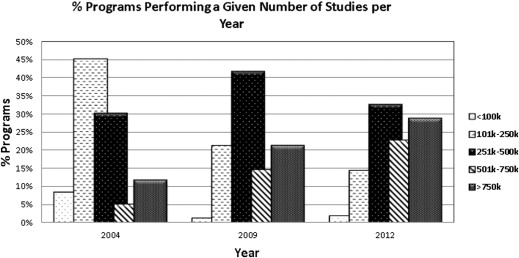
Program information
Get Radiology Tree app to read full this article<
Get Radiology Tree app to read full this article<
Get Radiology Tree app to read full this article<
Get Radiology Tree app to read full this article<
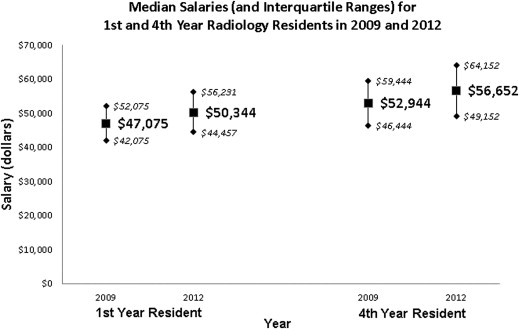
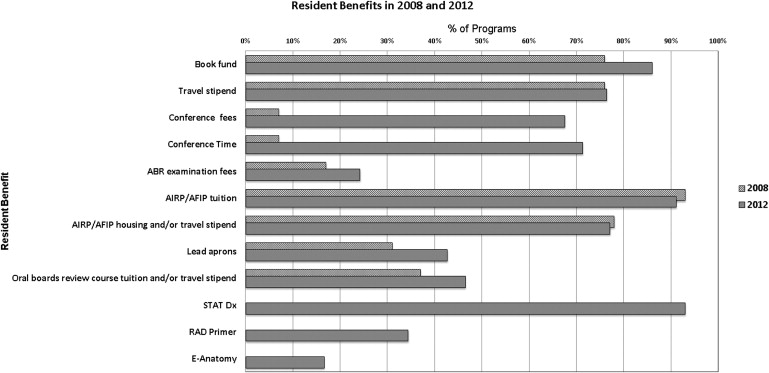
Resident benefits
Get Radiology Tree app to read full this article<
Get Radiology Tree app to read full this article<
Get Radiology Tree app to read full this article<
Get Radiology Tree app to read full this article<
Get Radiology Tree app to read full this article<
Get Radiology Tree app to read full this article<
Get Radiology Tree app to read full this article<
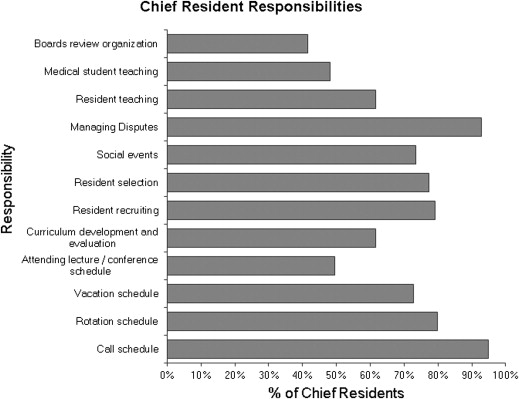
Chief resident
Get Radiology Tree app to read full this article<
Get Radiology Tree app to read full this article<
Get Radiology Tree app to read full this article<
Get Radiology Tree app to read full this article<
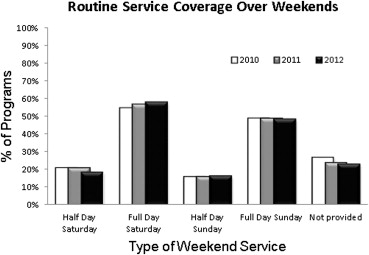
Call structure
Get Radiology Tree app to read full this article<
Get Radiology Tree app to read full this article<
Get Radiology Tree app to read full this article<
Get Radiology Tree app to read full this article<
Get Radiology Tree app to read full this article<
Get Radiology Tree app to read full this article<
Get Radiology Tree app to read full this article<
Get Radiology Tree app to read full this article<
Get Radiology Tree app to read full this article<
Get Radiology Tree app to read full this article<
Get Radiology Tree app to read full this article<
Get Radiology Tree app to read full this article<
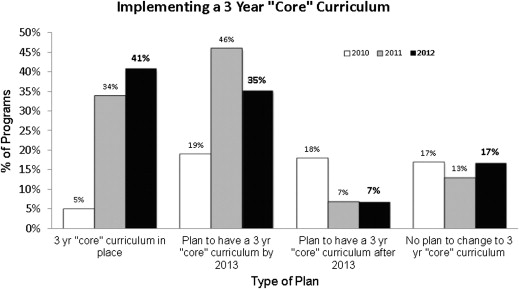
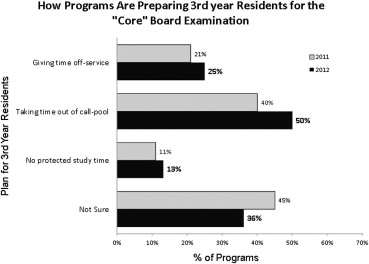
Changing board examination
Get Radiology Tree app to read full this article<
Get Radiology Tree app to read full this article<
Get Radiology Tree app to read full this article<
Get Radiology Tree app to read full this article<
Get Radiology Tree app to read full this article<
Get Radiology Tree app to read full this article<
Get Radiology Tree app to read full this article<
Get Radiology Tree app to read full this article<
Get Radiology Tree app to read full this article<
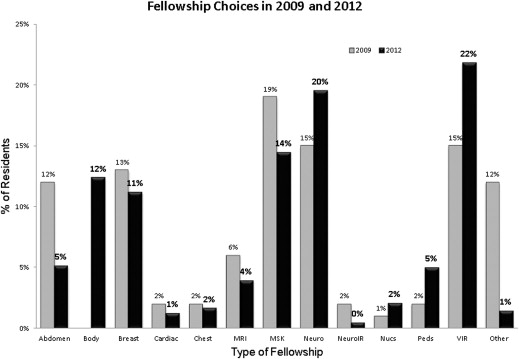
Fellowships
Get Radiology Tree app to read full this article<
Get Radiology Tree app to read full this article<
Get Radiology Tree app to read full this article<
Get Radiology Tree app to read full this article<
Get Radiology Tree app to read full this article<
Get Radiology Tree app to read full this article<
Health care economics and the job market
Get Radiology Tree app to read full this article<
Get Radiology Tree app to read full this article<
Get Radiology Tree app to read full this article<
Get Radiology Tree app to read full this article<
Get Radiology Tree app to read full this article<
Performance and quality improvement projects
Get Radiology Tree app to read full this article<
Discussion
Get Radiology Tree app to read full this article<
Get Radiology Tree app to read full this article<
Get Radiology Tree app to read full this article<
Get Radiology Tree app to read full this article<
Get Radiology Tree app to read full this article<
Get Radiology Tree app to read full this article<
Get Radiology Tree app to read full this article<
Get Radiology Tree app to read full this article<
References
1. Evert M.B., Schertz L.D., Wilson A.J., et. al.: Results of the 1990 survey of the American Association of Academic Chief Residents in Radiology (A3CR2) emphasizing data about chief residents in radiology. Invest Radiol 1991; 26: pp. 773-776.
2. Bower B.L., Engels J.T., Evens R.G.: Results of the 1989 survey of the American Association of Academic Chief Residents in Radiology. Invest Radiol 1991; 26: pp. 99-102.
3. Perry M.A., Smith D.K., Wilson A.J., et. al.: Results of the 1991 survey of the American Association of Academic Chief Residents in Radiology. Invest Radiol 1992; 27: pp. 402-405.
4. Horstman W.G., Kang E., Wilson A.J., et. al.: Results of the 1992 survey of the American Association of Academic Chief Residents in Radiology. Invest Radiol 1993; 28: pp. 96-99.
5. Oser A.B., Baker S.M., Wilson A.J., et. al.: Results of the 1993 survey of the American Association of Academic Chief Residents in Radiology. Acad Radiol 1994; 1: pp. 154-158.
6. Duncan J.R., Derdeyn C.P., Evens R.G.: Results of the 1994 survey of the American Association of Academic Chief Residents in Radiology. Acad Radiol 1996; 3: pp. 72-76.
7. VanWagenen F.K., Weidman E.R., Duncan J.R., et. al.: Results of the 1996 survey of the American Association of Academic Chief Residents in Radiology. Acad Radiol 1997; 4: pp. 132-137.
8. Heck D.V., Vaughan T.E., Duncan J.R., et. al.: Results of the 1997 survey of the American Association of Academic Chief Residents in Radiology. Acad Radiol 1998; 5: pp. 224-231.
9. Ruhs S.A., Fromke M.K., Evens R.G.: Results of and comments on the 1998 survey of the American Association of Academic Chief Residents in Radiology. Acad Radiol 1999; 6: pp. 706-709.
10. Lawler L.P., Fromke J., Jost R.G., et. al.: Results of and comments on the 2000 survey of the American Association of Academic Chief Residents in Radiology. Acad Radiol 2001; 8: pp. 777-781.
11. Evens R.G.: Report on a survey of chief residents in Academic Departments of radiology. Invest Radiol 1972; 7: pp. 61-62.
12. Minocha J., Yaghmai V., Hammond N., et. al.: Cardiac imaging training in radiology residency programs: A survey of radiology chief residents. Acad Radiol 2010; 17: pp. 795-798.
13. Horowitz J.M., Yaghmai V., Miller F.H., et. al.: Will CT ordering practices change if we educate residents about the potential effects of radiation exposure? Experience at a large academic medical center. Acad Radiol 2011; 18: pp. 1447-1452.
14. Chiunda A.B., Mohammed T.L.: Knowledge of ACR thoracic imaging Appropriateness Criteria® among trainees: One institution’s experience. Acad Radiol 2012; 19: pp. 635-639.
15. Petscavage J.M., Paladin A.M., Wang C.L., et. al.: Current status of residency training of allergic-like adverse events to contrast media. Acad Radiol 2012; 19: pp. 252-255.
16. Distribution of residents by specialty, 1999 compared to 2009. (2010). Accessed May 12, 2012, from www.aamc.org .
17. Kerr J.R., Brown J.J.: Costs of a medical education: Comparison with graduate education in law and business. J Am Coll Radiol 2006; 3: pp. 122-130.
18. US Inflation Calculator. (2012) Accessed on May 12, 2012, from http://www.usinflationcalculator.com/ .
19. Alderson P.O., Becker G.J.: The new requirements and testing for American Board of Radiology certification in diagnostic radiology. Radiology 2008; 248: pp. 707-709.
20. Brenner D.J., Hall E.J.: Computed tomography—an increasing source of radiation exposure. N Engl J Med 2007; 357: pp. 2277-2284.