
Rationale and Objectives
The aim of this study was to present and evaluate a fully automated system for emphysema quantification on low-dose computed tomographic images. The platform standardizes emphysema measurements against changes in the reconstruction algorithm and slice thickness.
Materials and Methods
Emphysema was quantified in 149 patients using a fully automatic, in-house developed software (the Robust Automatic On-Line Pulmonary Helper). The accuracy of the system was evaluated against commercial software, and its reproducibility was assessed using pairs of volume-corrected images taken 1 year apart. Furthermore, to standardize quantifications, the effect of changing the reconstruction parameters was modeled using a nonlinear fit, and the inverse of the model function was then applied to the data. The association between quantifications and pulmonary function testing was also evaluated. The accuracy of the in-house software compared to that of commercial software was measured using Spearman’s rank correlation coefficient, the mean difference, and the intrasubject variability. Agreement between the methods was studied using Bland-Altman plots. To assess the reproducibility of the method, intraclass correlation coefficients and Bland-Altman plots were used. The statistical significance of the differences between the standardized data and the reference data (soft-tissue reconstruction algorithm B40f; slice thickness, 1 mm) was assessed using a paired two-sample t test.
Results
The accuracy of the method, measured as intrasubject variability, was 3.86 mL for pulmonary volume, 0.01% for emphysema index, and 0.39 Hounsfield units for mean lung density. Reproducibility, assessed using the intraclass correlation coefficient, was >0.95 for all measurements. The standardization method applied to compensate for variations in the reconstruction algorithm and slice thickness increased the intraclass correlation coefficients from 0.87 to 0.97 and from 0.99 to 1.00, respectively. The correlation of the standardized measurements with pulmonary function testing parameters was similar to that of the reference (for the emphysema index and the obstructive subgroup: forced expiratory volume in 1 second, −0.647% vs −0.615%; forced expiratory volume in 1 second/forced vital capacity, −0.672% vs −0.654%; and diffusing capacity for carbon monoxide adjusted for hemoglobin concentration, −0.438% vs −0.523%).
Conclusions
The new emphysema quantification method presented in this report is accurate and reproducible and, thanks to its standardization method, robust to changes in the reconstruction parameters.
Chronic obstructive pulmonary disease (COPD) is a respiratory disease with significant extrapulmonary consequences. Its pulmonary component is characterized by airflow limitations, and it is not fully reversible. The airflow limitation is associated with an abnormal inflammatory response of the lung to noxious particles or gases . Traditionally, two phenotypes of COPD have been described: obstructive bronchitis and pulmonary emphysema. The former is defined as an inflammation-driven airway obstruction, while the latter is characterized by parenchymal destruction. Both forms of COPD result in significant systemic comorbidity and premature death. Because of current smoking trends and progressive aging of the world population, an increase in COPD prevalence and related mortality is expected in the coming decades . Furthermore, interest in early detection, follow-up, and distinction between those two phenotypes has been recently boosted by the discovery that patients with COPD with emphysema have increased risk for developing lung cancer compared to those affected by airway obstruction alone .
X-ray computed tomographic (CT) imaging is commonly used to detect and measure the extent of emphysema in the lungs . CT quantification of pulmonary emphysema has been shown to be reproducible, especially when the same acquisition protocol is used in all scans and proper correction methods are used to compensate for differences in air inspiration volumes .
Get Radiology Tree app to read full this article<
Get Radiology Tree app to read full this article<
Get Radiology Tree app to read full this article<
Get Radiology Tree app to read full this article<
Materials and methods
Subjects
Get Radiology Tree app to read full this article<
CT Acquisition
Get Radiology Tree app to read full this article<
Get Radiology Tree app to read full this article<
CT Image Analysis
Get Radiology Tree app to read full this article<
Lung Segmentation
Get Radiology Tree app to read full this article<
Trachea Detection
Get Radiology Tree app to read full this article<
Airway Extraction
Get Radiology Tree app to read full this article<
Get Radiology Tree app to read full this article<
Get Radiology Tree app to read full this article<
Assessment of the Accuracy and Reproducibility of CT Quantification
Get Radiology Tree app to read full this article<
Get Radiology Tree app to read full this article<
Assessment of Sensitivity to Confounding Variables for CT Quantification
Get Radiology Tree app to read full this article<
Get Radiology Tree app to read full this article<
Pulmonary Function Testing
Get Radiology Tree app to read full this article<
Correlation Between CT Parameters and Pulmonary Function Testing
Get Radiology Tree app to read full this article<
Statistical Analysis
Get Radiology Tree app to read full this article<
Get Radiology Tree app to read full this article<
Get Radiology Tree app to read full this article<
Get Radiology Tree app to read full this article<
Results
Assessment of the Accuracy and Reproducibility of Quantification
Accuracy
Get Radiology Tree app to read full this article<
![Figure 1, Differences of pulmonary volume and emphysema quantification of Robust Automatic On-Line Pulmonary Helper (RALPH) versus Lung Parenchyma Analysis (LUPA; Siemens Medical Systems, Forchheim, Germany). (a) Bland-Altman plot of total lung volume (bias = 136.8 mL, Kendall's τ = 0.237, standard error [SE] = 2.121). (b) Bland-Altman plot of mean lung density (MLD; bias = 17.7 Hounsfield units [HU], Kendall's τ = 0.572, SE = 0.0003). (c) Log-log Bland-Altman plot of emphysema index (EI; bias = −0.209, Kendall's τ = 0.144, SE = 0.006). Bias is shown as a solid line ; the limits of agreement are shown as dashed lines . A value above the upper limit or below the lower limit has 95% likelihood of representing a real difference between the quantifications obtained using the two methods.](https://storage.googleapis.com/dl.dentistrykey.com/clinical/RobustStandardizedQuantificationofPulmonaryEmphysemainLowDoseCTExams/0_1s20S1076633211003436.jpg)
Table 1
Comparison of VOL, MLD, and EI Measures for RALPH and LUPA
Variable Spearman’s Coefficient Mean Difference Intrasubject Variability VOL (mL) 0.999 136.82 3.86 MLD (HU) 0.994 17.69 0.39 EI (%) 0.997 −1.09 0.01
EI, emphysema index; HU, Hounsfield units; LUPA, Lung Parenchyma Analysis (Siemens Medical Systems, Forchheim, Germany); MLD, mean lung density; RALPH, Robust Automatic On-Line Pulmonary Helper; VOL, total lung volume.
The differences were not statistically significant except for MLD ( P < .01).
Get Radiology Tree app to read full this article<
Reproducibility
Get Radiology Tree app to read full this article<
![Figure 2, Differences in emphysema quantification between baseline and 12-month follow-up scans. (a) Bland-Altman plot of emphysema index (EI) for SR1 (bias = −0.1, Kendall's τ = −0.105, standard error [SE] = 0.17). (b) Bland-Altman plot of EI for BR1 (bias = 0.6, Kendall's τ = −0.101, SE = 0.38). Bias is shown as a solid line ; the limits of agreement are shown as dashed lines . A value above the upper limit or below the lower limit of agreement has a 95% likelihood of representing a real difference between the quantification of the two exams.](https://storage.googleapis.com/dl.dentistrykey.com/clinical/RobustStandardizedQuantificationofPulmonaryEmphysemainLowDoseCTExams/1_1s20S1076633211003436.jpg)
Table 2
ICCs for the Reproducibility of Emphysema Quantification Between Baseline and 12-month Follow-up Scans
Reconstruction Algorithm VOL MLD EI SR 0.97 0.98 0.98 BR 0.96 0.95 0.97
BR, bone reconstruction algorithm; EI, emphysema index; ICC, intraclass correlation coefficient; MLD, mean lung density; SR, soft tissue reconstruction algorithm; VOL, total lung volume.
Get Radiology Tree app to read full this article<
Assessment of Sensitivity to Confounding Variables for CT Quantification of Emphysema
Get Radiology Tree app to read full this article<
![Figure 3, Effect of changing the reconstruction parameters in the quantification of emphysema. (Top row) Three sample transverse computed tomographic slices showing areas of density < −960 Hounsfield units (HU) in yellow . (Bottom row) Front views of the corresponding three-dimensional reconstructions, displaying main airways and lungs in transparent blue and low-density volumes in yellow . The reconstructions were cut with an oblique plane to show the internal distribution of the low-density volumes. All three images correspond to the same acquisition, reconstructed using different parameters (kernel and slice thickness): (left) B40f and 1 mm (total lung volume [VOL], 13,786 mL; mean lung density [MLD], −885 HU; emphysema index [EI], 7.26%); (center) B60f and 1 mm (VOL, 13,778 mL; MLD, −882 HU; EI, 33.20%); (right) B40f and 3 mm (VOL, 1365 mL; MLD, −880 HU; EI, 21.74%).](https://storage.googleapis.com/dl.dentistrykey.com/clinical/RobustStandardizedQuantificationofPulmonaryEmphysemainLowDoseCTExams/2_1s20S1076633211003436.jpg)
Get Radiology Tree app to read full this article<
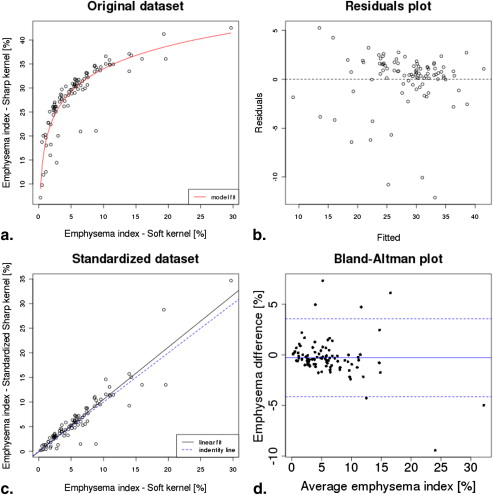
Reduction of the Effect of Changes in the Reconstruction Kernel
Get Radiology Tree app to read full this article<
Get Radiology Tree app to read full this article<
Get Radiology Tree app to read full this article<
Get Radiology Tree app to read full this article<
Get Radiology Tree app to read full this article<
Table 3
Correlations Between Emphysema Indicators Computed from CT Images Reconstructed with a Soft Tissue Reconstruction and Functional Respiratory Tests (n = 65)
Variable Entire Sample ( n = 65) Obstructive ( n = 22) Control ( n = 43) CC_P_ CC_P_ CC_P_ EI FEV 1 (%) −0.469 .00106 −0.615 .004 0.131 .496 FEV 1 /FVC (%) −0.658 <.0001 −0.654 .00217 −0.298 .115 DLCOadj (%) −0.288 .044 −0.523 .018 0.346 .065 MLD FEV 1 (%) 0.251 .081 0.467 .037 −0.182 .344 FEV 1 /FVC (%) 0.528 <.0001 0.630 .002 0.259 .174 DLCOadj (%) −0.023 .871 0.348 .131 −0.430 .019
CC, correlation coefficient; CT, computed tomographic; DLCOadj, diffusing capacity for carbon monoxide after adjusting for concentration of hemoglobin; EI, emphysema index; FEV 1 , forced expiratory volume in 1 second; FVC, forced vital capacity; MLD, mean lung density.
Table 4
Correlation Between Emphysema Indicators Computed from CT Images Reconstructed with a Bone Reconstruction Algorithm and Functional Respiratory Tests
Variable Entire Sample ( n = 65) Obstructive ( n = 22) Control ( n = 43) CC_P_ CC_P_ CC_P_ EI FEV 1 (%) −0.291 .041 −0.574 .008 0.122 .528 FEV 1 /FVC (%) −0.473 .00105 −0.446 .049 −0.288 .129 DLCOadj (%) −0.012 .934 −0.338 .144 0.393 .035 MLD FEV 1 (%) 0.194 .180 0.377 .100 −0.205 .287 FEV 1 /FVC (%) 0.476 .005 0.568 .009 0.237 .213 DLCOadj (%) −0.017 .904 0.364 .114 −0.425 .021
CC, correlation coefficient; CT, computed tomographic; DLCOadj, diffusing capacity for carbon monoxide after adjusting for concentration of hemoglobin; EI, emphysema index; FEV 1 , forced expiratory volume in 1 second; FVC, forced vital capacity; MLD, mean lung density.
Table 5
Correlation Between Emphysema Indicators Computed from CT Images Reconstructed with a Bone Reconstruction Algorithm After Standardization and Functional Respiratory Tests
Variable Entire Sample ( n = 65) Obstructive ( n = 22) Control ( n = 43) CC_P_ CC_P_ CC_P_ EI FEV 1 (%) −0.443 .001 −0.647 .002 0.116 .548 FEV 1 /FVC (%) −0.592 <.0001 −0.672 .001 −0.255 .182 DLCOadj (%) −0.250 .082 −0.438 .05 0.289 .127
CC, correlation coefficient; CT, computed tomographic; DLCOadj, diffusing capacity for carbon monoxide after adjusting for concentration of hemoglobin; EI, emphysema index; FEV 1 , forced expiratory volume in 1 second; FVC, forced vital capacity; MLD, mean lung density.
Get Radiology Tree app to read full this article<
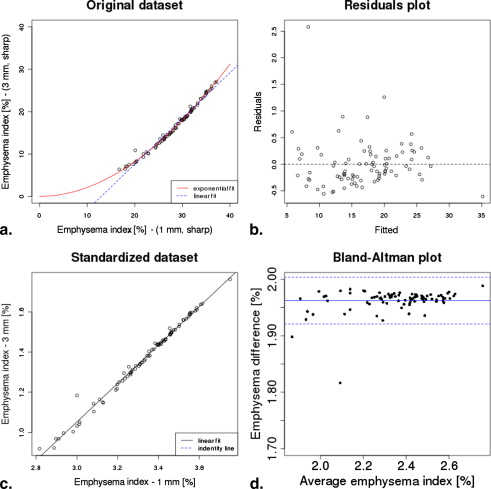
Reduction of the Effect of a Change in Slice Thickness
Get Radiology Tree app to read full this article<
Get Radiology Tree app to read full this article<
Get Radiology Tree app to read full this article<
Get Radiology Tree app to read full this article<
Discussion
Get Radiology Tree app to read full this article<
Get Radiology Tree app to read full this article<
Get Radiology Tree app to read full this article<
Get Radiology Tree app to read full this article<
Get Radiology Tree app to read full this article<
Get Radiology Tree app to read full this article<
Conclusions
Get Radiology Tree app to read full this article<
Acknowledgments
Get Radiology Tree app to read full this article<
Get Radiology Tree app to read full this article<
References
1. Rabe K.F., Hurd S., Anzueto A., et. al.: Global strategy for the diagnosis, management, and prevention of chronic obstructive pulmonary disease: GOLD executive summary. Am J Respir Crit Care 2007; 176: pp. 532-555.
2. Halbert R.J., Isonaka S., George D., et. al.: Interpreting COPD prevalence estimates: what is the true burden of disease?. Chest 2003; 123: pp. 1684-1692.
3. de Torres J.P., Bastarrika G., Wisnivesky J.P., et. al.: Assessing the relationship between lung cancer risk and emphysema detected on low-dose CT of the chest. Chest 2007; 132: pp. 1932-1938.
4. Houghton A.M., Mouded M., Shapiro S.D.: Common origins of lung cancer and COPD. Nat Med 2008; 14: pp. 1023-1024.
5. Swensen S.J., Jett J.R., Sloan J.A.: Screening for lung cancer with low-dose spiral computed tomography. Am J Resp Crit Care 2002; 165: pp. 508-513.
6. Wilson D.O., Weissfeld J.L., Balkan A., et. al.: Association of radiographic emphysema and airflow obstruction with lung cancer. Am J Resp Crit Care 2008; 178: pp. 738-744.
7. Turner M.C., Chen Y., Krewski D., et. al.: Chronic obstructive pulmonary disease is associated with lung cancer mortality in a prospective study of never smokers. Am J Resp Crit Care 2007; 176: pp. 285-290.
8. Muller N.L., Staples C.A., Miller R.R., et. al.: “Density mask.” An objective method to quantitate emphysema using computed tomography. Chest 1988; 94: pp. 782-787.
9. Gevenois P.A., Yernault J.C.: Can computed tomography quantify pulmonary emphysema?. Eur Respir J 1995; 8: pp. 843-848.
10. Madani A., Zanen J., de Maertelaer V., et. al.: Pulmonary emphysema: Objective quantification at multi-detector row CT—comparison with macroscopic and microscopic morphometry. Radiology 2006; 238: pp. 1036-1093.
11. Stern E.J., Frank M.S.: CT of the lung in patients with pulmonary emphysema: diagnosis, quantification, and correlation with pathologic and physiologic findings. AJR Am J Roentgenol 1994; 162: pp. 791-798.
12. Uppaluri R., Mitsa T., Sonka M., et. al.: Quantification of pulmonary emphysema from lung computed tomography images. Am J Resp Crit Care 1997; 156: pp. 248-254.
13. Bastarrika G., Wisnivesky J.P., Pueyo J.C., et. al.: Low-dose volumetric computed tomography for quantification of emphysema in asymptomatic smokers participating in an early lung cancer detection trial. J Thorac Imag 2009; 24: pp. 206-211.
14. Stoel B.C., Stolk J.: Optimization and standardization of lung densitometry in the assessment of pulmonary emphysema. Invest Radiol 2004; 39: pp. 681-688.
15. Temizoz O., Etlik O., Sakarya M., et. al.: Detection and quantification of the parenchymal abnormalities in emphysema using Pulmo-CT. Comput Med Imaging Graphics 2007; 31: pp. 542-548.
16. Achenbach T., Weinheimer O., Buschsieweke C., et. al.: Fully automatic detection and quantification of emphysema on thin section MD-CT of the chest by a new and dedicated software. [article in German] Rofo 2004; 176: pp. 1409-1415.
17. Bellomi M., Rampinelli C., Veronesi G., et. al.: Evolution of emphysema in relation to smoking. Eur Radiol 2010; 20: pp. 286-292.
18. Gietema H.A., Schilham A.M., van Ginneken B., et. al.: Monitoring of smoking-induced emphysema with CT in a lung cancer screening setting: detection of real increase in extent of emphysema. Radiology 2007; 244: pp. 890-897.
19. Kim W.J., Silverman E.K., Hoffman E., et. al., NETT Research Group: CT metrics of airway disease and emphysema in severe COPD. Chest 2009; 136: pp. 396-404.
20. Boedeker K.L., McNitt-Gray M.F., Rogers S.R., et. al.: Emphysema: effect of reconstruction algorithm on CT imaging measures. Radiology 2004; 232: pp. 295-301.
21. Keller B.M., Reeves A.P., Henschke C.I., et. al.: Variation of quantitative emphysema measurements from CT scans. Proc SPIE 2008; 69152I:
22. Madani A., De Maertelaer V., Zanen J., et. al.: Pulmonary emphysema: Radiation dose and section thickness at multidetector CT quantification—comparison with macroscopic and microscopic morphometry. Radiology 2007; 243: pp. 250-257.
23. Gierada D.S., Bierhals A.J., Choong C.K., et. al.: Effects of CT section thickness and reconstruction kernel on emphysema quantification relationship to the magnitude of the CT emphysema index. Acad Radiol 2010; 17: pp. 146-156.
24. Leyzaporozhan J.: Quantitative analysis of emphysema in 3D using MDCT: Influence of different reconstruction algorithms. Eur J Radiol 2008; 65: pp. 228-234.
25. Hu S., Hoffman E., Reinhardt J.: Automatic lung segmentation for accurate quantitation of volumetric x-ray CT images. IEEE Trans Med Imaging 2001; 20: pp. 490-498.
26. Schlathoelter T., Lorenz C., Carlsen I.C., et. al.: Simultaneous segmentation and tree reconstruction of the airways for virtual bronchoscopy. Proc SPIE 2002; 4684: pp. 103-113.
27. Artaechevarria X., Pérez-Martín D., Ceresa M., et. al.: Airway segmentation and analysis for the study of mouse models of lung disease using micro-CT. Phys Med Biol 2009; 54: pp. 7009-7024.
28. Gevenois P.A., Vuyst P.D., de Maertelaer V., et. al.: Comparison of computed density and microscopic morphometry in pulmonary emphysema. Am J Resp Crit Care 1996; 154: pp. 187-192.
29. American Thoracic Society: Standards for the diagnosis and care of patients with chronic obstructive pulmonary disease. Am J Resp Crit Care 1995; 152: pp. S77-S121.
30. Celli R.B., MacNee W.: Standards for the diagnosis and treatment of patients with COPD: a summary of the ATS/ERS position paper. Eur Respir J 2004; 27: pp. 242.
31. Global Initiative for Chronic Obstructive Lung Disease. Global strategy for diagnosis, management and prevention of COPD. Updated 2008. Available at: http://www.goldcopd.com .
32. Bland J.M., Altman D.G.: Statistical methods for assessing agreement between two methods of clinical measurement. Lancet 1986; 327: pp. 307-310.
33. Cronbach L.J.: Coefficient alpha and the internal structure of tests. Psychometrika 1951; 16: pp. 297-334.
34. Stolk J., Putter H., Bakker E.M., et. al.: Progression parameters for emphysema: a clinical investigation. Resp Med 2007; 101: pp. 1924-1930.
35. Heussel C.P., Herth F.J.F., Kappes J., et. al.: Fully automatic quantitative assessment of emphysema in computed tomography: comparison with pulmonary function testing and normal values. Eur Radiol 2009; 19: pp. 2391-2402.
36. Heremans A., Verschakelen J.A., Ven Fraeyenhoven L., et. al.: Measurement of lung density by means of quantitative CT scanning: a study of correlations with pulmonary function tests. Chest 1992; 102: pp. 805-811.
37. Behrendt F.F., Das M., Mahnken A.H., et. al.: Computer-aided measurements of pulmonary emphysema in chest multidetector-row spiral computed tomography: effect of image reconstruction parameters. J Comput Assist Tomo 2008; 32: pp. 899-904.
38. McGregor A., Roberts H.C., Dong Z., et. al.: Repeated low-dose computed tomograhy in current and former smokers for quantification of emphysema. J Comput Assist Tomogr 2010; 34: pp. 933-938.