
Rational and Objectives
Receiver operating characteristic (ROC) analysis is often used to find the optimal combination of biomarkers. When the subject level covariates affect the magnitude and/or accuracy of the biomarkers, the combination rule should take into account of the covariate adjustment. The authors propose two new biomarker combination methods that make use of the covariate information.
Materials and Methods
The first method is to maximize the area under the covariate-adjusted ROC curve (AAUC). To overcome the limitations of the AAUC measure, the authors further proposed the area under covariate-standardized ROC curve (SAUC), which is an extension of the covariate-specific ROC curve. With a series of simulation studies, the proposed optimal AAUC and SAUC methods are compared with the optimal AUC method that ignores the covariates. The biomarker combination methods are illustrated by an example from Alzheimer’s disease research.
Results
The simulation results indicate that the optimal AAUC combination performs well in the current study population. The optimal SAUC method is flexible to choose any reference populations, and allows the results to be generalized to different populations.
Conclusions
The proposed optimal AAUC and SAUC approaches successfully address the covariate adjustment problem in estimating the optimal marker combination. The optimal SAUC method is preferred for practical use, because the biomarker combination rule can be easily evaluated for different population of interest.
In disease screening, a common practice is to obtain various biomarkers from each subject. These biomarkers often reflect diverse aspects of the disease, such as the severity, subtype, etc. Any one of the markers alone may not be a great diagnostic tool, while combining the markers could potentially help achieve better accuracy. The receiver operating characteristic (ROC) curve is a useful tool to evaluate the diagnostic accuracy . Many biomarker combination methods rely on the maximization of the area under ROC curve (AUC). The major advantage of optimal AUC combination is that no distributional assumption is needed for the biomarkers . In addition, it is flexible to incorporate linear or nonlinear combinations.
In practice, individual covariates may be associated with the magnitude and/or accuracy of a biomarker. Covariate adjustment is generally recommended in ROC analysis as long as the decision threshold in diagnosis is dependent on covariates . The unadjusted ROC curve pools all the heterogeneous subjects together, and makes an implicit assumption that the decision threshold for test positivity is constant for everybody. This assumption could be violated in practice. For example, patient’s age often plays an important role in the disease diagnosis. The irrational decision strategy could lead to a nonconcave ROC curve , and the comparison of two subjects with different covariates may not have good scientific meanings. The pooling may also result in the Simpson’s paradox . The idea of covariate adjustment in ROC analysis resembles that in linear regression: the effect of interest is only evaluated with the confounders held fixed. The covariate-specific ROC curve is frequently reported in the diagnostic studies, which examines the accuracy of a marker within a subpopulation stratified by the covariates.
Get Radiology Tree app to read full this article<
Get Radiology Tree app to read full this article<
Materials and methods
Notations
Get Radiology Tree app to read full this article<
Get Radiology Tree app to read full this article<
FX(t)=Pr(T≤t|D=1,X),GX(t)=Pr(T≤t|D=0,X). F
X
(
t
)
=
Pr
(
T
≤
t
|
D
=
1
,
X
)
,
G
X
(
t
)
=
Pr
(
T
≤
t
|
D
=
0
,
X
)
.
Get Radiology Tree app to read full this article<
Get Radiology Tree app to read full this article<
Description of the National Alzheimer’s Coordinating Center Data
Get Radiology Tree app to read full this article<
Table 1
Summary Statistics of the Study Subjects in Their Initial Visit
Not Progressed to Dementia ( n 0 = 3074) Progressed to Dementia ( n 1 = 672) Clinical dementia rating sum of boxes (range: 0–18) 1.1 ± 1.0 2.0 ± 1.4 Mini-Mental State Examination (range: 0–30) 27.6 ± 2.3 26.0 ± 2.6 Age (range: 28.2–104.4) 73.9 ± 9.3 76.1 ± 9.5 Sex (Male) 47.1% 50.6% Education ≤12 years 29.7% 28.9% 13–16 years 40.8% 42.3% ≥17 years 29.5% 28.9% Year ∗ 1.21 ± 0.40 1.25 ± 0.49
Means ± standard deviations and ranges are reported for the continuous variables, and percentages are reported for the categorical variables.
Get Radiology Tree app to read full this article<
Get Radiology Tree app to read full this article<
Existing AUC Measures
Get Radiology Tree app to read full this article<
Table 2
Existing Area Under the Receiver Operating Characteristic Curve (AUC) Measures and Their Mathematical Formula
AUC Measures Formula Unadjusted AUCAUC=∫G(t)dF(t)=∬AUCxydH1(x)dH0(y) A
U
C
=
∫
G
(
t
)
d
F
(
t
)
=
∬
A
U
C
x
y
d
H
1
(
x
)
d
H
0
(
y
) Covariate-specific AUC (AUCx)AUCx=∫Gx(t)dFx(t) A
U
C
x
=
∫
G
x
(
t
)
d
F
x
(
t
) Extended AUCxAUCxy=∫Gx(t)dFy(t) A
U
C
x
y
=
∫
G
x
(
t
)
d
F
y
(
t
) Covariate-adjusted AUC (AAUC)AAUC=∫AUCxdH1(x)=∬x=yAUCxydH1(x)dH1(y) A
A
U
C
=
∫
A
U
C
x
d
H
1
(
x
)
=
∬
x
=
y
A
U
C
x
y
d
H
1
(
x
)
d
H
1
(
y
)
Get Radiology Tree app to read full this article<
Get Radiology Tree app to read full this article<
Get Radiology Tree app to read full this article<
SAUC
Get Radiology Tree app to read full this article<
F∗(t)=∫Fx(t)dH∗(x)G∗(t)=∫Gx(t)dH∗(x), F
∗
(
t
)
=
∫
F
x
(
t
)
d
H
∗
(
x
)
G
∗
(
t
)
=
∫
G
x
(
t
)
d
H
∗
(
x
)
,
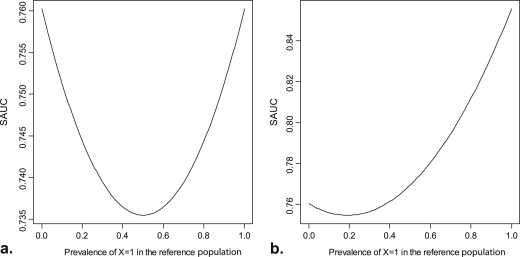
where H ∗ represents the covariates distribution for the reference population. Then, SAUC is expressed similarly as the unadjusted AUC, with F and G replaced by F ∗ and G ∗ , respectively:
SAUC=∫G∗(t)dF∗(t)=∬AUCxydH∗(x)dH∗(y). S
A
U
C
=
∫
G
∗
(
t
)
d
F
∗
(
t
)
=
∬
A
U
C
x
y
d
H
∗
(
x
)
d
H
∗
(
y
)
.
Get Radiology Tree app to read full this article<
Get Radiology Tree app to read full this article<
Get Radiology Tree app to read full this article<
Get Radiology Tree app to read full this article<
Get Radiology Tree app to read full this article<
Get Radiology Tree app to read full this article<
Biomarker Combination
Get Radiology Tree app to read full this article<
Get Radiology Tree app to read full this article<
Get Radiology Tree app to read full this article<
Get Radiology Tree app to read full this article<
Simulation Studies
Get Radiology Tree app to read full this article<
logit{P(D=1|X)}=−1.5+0.4X1+0.5X2. l
o
g
i
t
{
P
(
D
=
1
|
X
)
}
=
−
1.5
+
0.4
X
1
+
0.5
X
2
.
Get Radiology Tree app to read full this article<
Get Radiology Tree app to read full this article<
Tk=βk0+βk1D+βk2X1+βk3X2+βk4D×X1+βk5D×X2+εk T
k
=
β
0
k
+
β
1
k
D
+
β
2
k
X
1
+
β
3
k
X
2
+
β
4
k
D
×
X
1
+
β
5
k
D
×
X
2
+
ε
k
for k = 1, 2, where
(ε1ε2)∼MVN[(00),(1ρρ2)]. (
ε
1
ε
2
)
∼
M
V
N
[
(
0
0
)
,
(
1
ρ
ρ
2
)
]
.
Get Radiology Tree app to read full this article<
Get Radiology Tree app to read full this article<
Get Radiology Tree app to read full this article<
Get Radiology Tree app to read full this article<
Get Radiology Tree app to read full this article<
Results
Simulation Results
Get Radiology Tree app to read full this article<
Table 3
Estimated Combination Rules Maximizing the Area Under the Receiver Operating Characteristic Curve (AUC) (M1), Covariate-Adjusted AUC (AAUC) (M2), Standardized AUC (SAUC) with Reference Population 1 (M3), and SAUC with Reference Population 2 (M4), and Their Out-sample Performance in Populations 1 and 2: Scenario A: (β24,β25)=(−0.6,−0.4) (
β
4
2
,
β
5
2
)
=
(
−
0.6
,
−
0.4
)
ρ_COEF_ ∗ × 100 ( IQR † × 100) Population 1 Population 2AUC × 100AAUC × 100SAUC × 100AUC × 100AAUC × 100SAUC × 100 −0.8 M1 55.4 (43.6)82.5 ‡ 85.3 74.0 87.9 91.9 79.9 M2 62.1 (36.6) 82.485.6 73.8 86.7 91.0 78.0 M3 45.6 (47.3) 82.2 84.573.9 88.892.3 81.6 M4 6.2 (30.9) 76.1 76.0 69.790.6 91.287.7 −0.3 M1 49.2 (49.9)79.278.971.3 85.6 86.4 78.1 M2 49.7 (49.3)79.278.971.3 85.8 86.8 78.5 M3 38.3 (50.5) 78.9 78.6 71.2 86.9 87.7 80.4 M4 −5.8 (31.6) 72.3 72.8 67.089.590.087.7 0.0 M1 44.5 (55.3)77.7 76.570.1 84.7 84.5 77.7 M2 37.8 (53.2) 77.676.670.1 85.9 85.9 79.6 M3 33.2 (53.3) 77.4 76.470.1 86.3 86.3 80.3 M4 −12.9 (31.8) 70.5 71.8 65.889.390.188.2 0.3 M1 39.2 (57.3)76.4 74.869.2 84.0 83.2 77.5 M2 27.1 (55.1) 76.174.9 69.1 86.1 85.9 80.8 M3 26.3 (53.5) 76.174.969.2 86.1 85.7 80.7 M4 −19.8 (30.6) 69.1 71.2 64.989.690.789.2 0.8 M1 26.7 (56.3)74.8 73.1 68.1 84.2 83.0 78.7 M2 6.6 (59.3) 73.5 73.5 67.7 88.0 87.9 84.7 M3 12.2 (51.7) 74.573.768.2 87.1 86.8 83.2 M4 −30.9 (28.1) 67.5 71.6 64.191.392.991.7
Get Radiology Tree app to read full this article<
Get Radiology Tree app to read full this article<
Get Radiology Tree app to read full this article<
Table 4
Estimated Combination Rules by Maximizing the Area Under the Receiver Operating Characteristic Curve (AUC) (M1), Covariate-Adjusted AUC (AAUC) (M2), Standardized AUC (SAUC) with Reference Population 1 (M3), and SAUC with Reference Population 2 (M4), and Their Out-sample Performance in Populations 1 and 2: Scenario B: (β24,β25)=(0.6,0.4) (
β
4
2
,
β
5
2
)
=
(
0.6
,
0.4
)
ρ_COEF_ ∗ × 100 ( IQR † × 100) Population 1 Population 2AUC × 100AAUC × 100SAUC × 100AUC × 100AAUC × 100SAUC × 100 −0.8 M1 54.4 (51.9)82.3 ‡ 86.9 72.4 93.6 97.9 88.3 M2 75.4 (50.6) 82.288.0 71.7 92.998.2 86.6 M3 36.8 (47.3) 81.9 85.172.594.0 97.2 89.4 M4 23.1 (32.5) 80.9 82.3 72.394.0 96.090.3 −0.3 M1 54.4 (60.8)80.2 82.5 70.7 92.0 95.7 86.3 M2 77.7 (65.5) 80.183.1 70.1 91.395.9 84.7 M3 32.8 (50.9) 79.6 81.070.892.5 95.0 87.8 M4 16.8 (33.7) 78.4 78.7 70.692.5 93.888.9 0.0 M1 56.8 (65.4)79.0 80.4 69.7 91.1 94.3 85.2 M2 78.9 (72.1) 78.980.8 69.1 90.494.4 83.6 M3 29.7 (52.3) 78.4 79.170.091.7 93.8 87.0 M4 12.6 (33.7) 77.0 77.0 69.8 91.6 92.588.2 0.3 M1 56.5 (73.7)77.9 78.7 68.8 90.293.0 84.1 M2 80.2 (78.0)77.979.0 68.3 89.593.0 82.6 M3 25.4 (53.5) 77.4 77.569.391.0 92.6 86.5 M4 7.7 (33.2) 75.8 75.6 69.0 90.9 91.587.8 0.8 M1 58.8 (89.8)76.5 76.5 67.7 88.891.0 82.6 M2 91.5 (115.4) 76.476.6 67.2 88.0 90.8 81.0 M3 16.1 (51.6) 75.7 75.568.590.191.0 86.1 M4 −1.7 (30.7) 73.8 74.0 68.2 89.8 90.287.6
Get Radiology Tree app to read full this article<
Get Radiology Tree app to read full this article<
Get Radiology Tree app to read full this article<
Get Radiology Tree app to read full this article<
Get Radiology Tree app to read full this article<
Get Radiology Tree app to read full this article<
Get Radiology Tree app to read full this article<
Get Radiology Tree app to read full this article<
Get Radiology Tree app to read full this article<
NACC Data Example
Get Radiology Tree app to read full this article<
Table 5
The Area Under the Receiver Operating Characteristic Curve (AUC), Covariate-Adjusted AUC (AAUC), and Standardized AUC (SAUC) for Clinical Dementia Rating Sum of Boxes (CDRSB), Mini-Mental State Examination (MMSE), and the Combination
CDRSB MMSE Combined (95% CI) Optimal AUC 0.728 0.686 0.758 (0.739, 0.778) Optimal AAUC 0.733 0.680 0.757 (0.738, 0.778) Optimal SAUC 0.764 0.686 0.781 (0.755, 0.808)
Get Radiology Tree app to read full this article<
Get Radiology Tree app to read full this article<
Get Radiology Tree app to read full this article<
Discussion
Get Radiology Tree app to read full this article<
Get Radiology Tree app to read full this article<
Get Radiology Tree app to read full this article<
Get Radiology Tree app to read full this article<
Get Radiology Tree app to read full this article<
Get Radiology Tree app to read full this article<
Appendix
Relationship between AUC and AUC__xy
Get Radiology Tree app to read full this article<
AUC=∫{∫Gy(t)dH0(y)}d{∫Fx(t)dH1(x)}=∭Gy(t)dFx(t)dH1(x)dH0(y)=∫AUCxydH1(x)dH0(y). A
U
C
=
∫
{
∫
G
y
(
t
)
d
H
0
(
y
)
}
d
{
∫
F
x
(
t
)
d
H
1
(
x
)
}
=
∭
G
y
(
t
)
d
F
x
(
t
)
d
H
1
(
x
)
d
H
0
(
y
)
=
∫
A
U
C
x
y
d
H
1
(
x
)
d
H
0
(
y
)
.
Get Radiology Tree app to read full this article<
Semiparametric Estimation of SAUC
Get Radiology Tree app to read full this article<
T=μ(X,d)+ε, T
=
μ
(
X
,
d
)
+
ε
,
where μ(X,d)=E(T|D=d,X) μ
(
X
,
d
)
=
E
(
T
|
D
=
d
,
X
) and ε ε is the residual whose distribution is left unspecified. A convenient choice of the mean function is a linear model stratified by disease, e.g., μ(X,d)=X′βd. μ
(
X
,
d
)
=
X
′
β
d
. The second step is to estimate the residual distribution empirically:
Rˆd(s)=∑Nj=1I[Tj−μˆ(Xj,d)≤s,Dj=d]∑nj=1I[Dj=d]. R
ˆ
d
(
s
)
=
∑
j
=
1
N
I
[
T
j
−
μ
ˆ
(
X
j
,
d
)
≤
s
,
D
j
=
d
]
∑
j
=
1
n
I
[
D
j
=
d
]
.
Get Radiology Tree app to read full this article<
Get Radiology Tree app to read full this article<
Gˆx(t)=Rˆ1(t−μˆ(x,0))=∑Nj=1I[Tj−μˆ(Xj,d)≤t−μˆ(x,0),Dj=d]∑nj=1I[Dj=d]. G
ˆ
x
(
t
)
=
R
ˆ
1
(
t
−
μ
ˆ
(
x
,
0
)
)
=
∑
j
=
1
N
I
[
T
j
−
μ
ˆ
(
X
j
,
d
)
≤
t
−
μ
ˆ
(
x
,
0
)
,
D
j
=
d
]
∑
j
=
1
n
I
[
D
j
=
d
]
.
Get Radiology Tree app to read full this article<
Get Radiology Tree app to read full this article<
Gˆ∗(t)=∑Mm=1∑Nj=1I[Tj−μˆ(Xj,d)≤t−μˆ(X∗m,0),Dj=d]M×∑Nj=1I[Dj=d]. G
ˆ
∗
(
t
)
=
∑
m
=
1
M
∑
j
=
1
N
I
[
T
j
−
μ
ˆ
(
X
j
,
d
)
≤
t
−
μ
ˆ
(
X
m
∗
,
0
)
,
D
j
=
d
]
M
×
∑
j
=
1
N
I
[
D
j
=
d
]
.
Get Radiology Tree app to read full this article<
Get Radiology Tree app to read full this article<
A Special Case of Maximizing AAUC
Get Radiology Tree app to read full this article<
μT=(X′α1+γ1DX′α2+γ2D),ΣT=(σ21ρσ1σ2ρσ1σ2σ22). μ
T
=
(
X
′
α
1
+
γ
1
D
X
′
α
2
+
γ
2
D
)
,
Σ
T
=
(
σ
1
2
ρ
σ
1
σ
2
ρ
σ
1
σ
2
σ
2
2
)
.
Here μ T does not include any interaction terms of X and D , indicating that the covariates only affect the magnitude of the marker, but not the accuracy of the marker. Consider the linear combination T 1 + λ T 2 , which follows a univariate normal distribution with
μc=X′(α1+λα2)+(γ1+λγ2)D,σ2c=σ21+2ρσ1σ2λ+σ22λ2. μ
c
=
X
′
(
α
1
+
λ
α
2
)
+
(
γ
1
+
λ
γ
2
)
D
,
σ
c
2
=
σ
1
2
+
2
ρ
σ
1
σ
2
λ
+
σ
2
2
λ
2
.
Get Radiology Tree app to read full this article<
Get Radiology Tree app to read full this article<
AAUC=AUCx=Φ(γ1+λγ22σ21+4ρσ1σ2λ+2σ22λ2√). A
A
U
C
=
A
U
C
x
=
Φ
(
γ
1
+
λ
γ
2
2
σ
1
2
+
4
ρ
σ
1
σ
2
λ
+
2
σ
2
2
λ
2
)
.
Get Radiology Tree app to read full this article<
Get Radiology Tree app to read full this article<
(1,λ)∝(γ1,γ2)Σ−1T. (
1
,
λ
)
∝
(
γ
1
,
γ
2
)
Σ
T
−
1
.
Get Radiology Tree app to read full this article<
Get Radiology Tree app to read full this article<
Get Radiology Tree app to read full this article<
Get Radiology Tree app to read full this article<
Get Radiology Tree app to read full this article<
References
1. Metz C.E.: Basic principles of ROC analysis. Semin Nucl Med 1978; 8: pp. 283-298.
2. Pepe M.S., Thompson M.L.: Combining diagnostic test results to increase accuracy. Biostatistics 2000; 1: pp. 123-140.
3. Su J.Q., Liu J.S.: Linear combinations of multiple diagnostic markers. J Am Stat Assoc 1993; 88: pp. 1350-1355.
4. Jiang Y., Metz C.E.: A quadratic model for combining quantitative diagnostic assessments from radiologist and computer in computer-aided diagnosis. Acad Radiol 2006; 13: pp. 140-151.
5. Liu B., Metz C.E., Jiang Y.: Effect of correlation on combining diagnostic information from two images of the same patient. Med Phys 2005; 32: pp. 3329-3338.
6. Liu C., Liu A., Halabi S.: A min−max combination of biomarkers to improve diagnostic accuracy. Statist Med 2011; 30: pp. 2005-2014.
7. Zou K.H., Bhagwat J.G., Carrino J.A.: Statistical combination schemes of repeated diagnostic test data. Acad Radiol 2006; 13: pp. 566-572.
8. Pepe M.S.: The statistical evaluation of medical tests for classification and prediction.2003.Oxford University PressOxford, UK
9. Zhou X.H., Obuchowski N.A., McClish D.K.: Statistical methods in diagnostic medicine.2011.WileyNew York
10. Pesce L.L., Metz C.E., Berbaum K.S.: On the convexity of ROC curves estimated from radiological test results. Acad Radiol 2010; 17: pp. 960-968.
11. Janes H., Pepe M.S.: Adjusting for covariates in studies of diagnostic, screening, or prognostic markers: an old concept in a new setting. Am J Epidemiol 2008; 168: pp. 89-97.
12. Janes H., Pepe M.S.: Adjusting for covariate effects on classification accuracy using the covariate-adjusted receiver operating characteristic curve. Biometrika 2009; 96: pp. 371-382.
13. Liu D., Zhou X.H.: Covariate adjustment in estimating the area under ROC curve with partially missing gold standard. Biometrics 2013; 69: pp. 91-100.
14. Dodd L.E., Pepe M.S.: Semiparametric regression for the area under the receiver operating characteristic curve. J Am Stat Assoc 2003; 98: pp. 409-417.
15. Pepe M.S.: Three approaches to regression analysis of receiver operating characteristic curves for continuous test results. Biometrics 1998; 54: pp. 124-135.
16. Liu D., Zhou X.H.: Semiparametric estimation of the covariate-specific ROC curve in presence of ignorable verification bias. Biometrics 2011; 67: pp. 906-916.