
Rationale and Objectives
The aim of the present study was to test the hypothesis that when a radiologist does not perceive an abnormality in images that contain either extremely subtle abnormalities or no abnormalities, the radiologist cannot distinguish these two types of images and the receiver operating characteristic (ROC) curve reflects that performance.
Materials and Methods
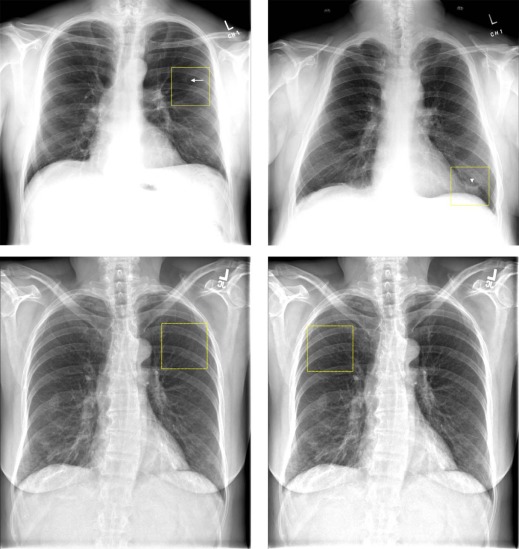
This retrospective study was conducted with approval of our institutional review board. Four general radiologists participated in an observer performance study of 100 chest images, each of which had a 5 × 5 cm region of interest (ROI) drawn (50 containing a lung nodule, and 50 did not, based on computed tomography [CT] confirmation). About half of the lung nodules were extremely subtle. The readers reported their confidence that a nodule was present within the ROI, from which empirical and maximum-likelihood “proper” binormal and conventional binormal ROC curves were estimated. The readers also reported whether they saw an abnormality that could be a nodule within the ROI.
Results
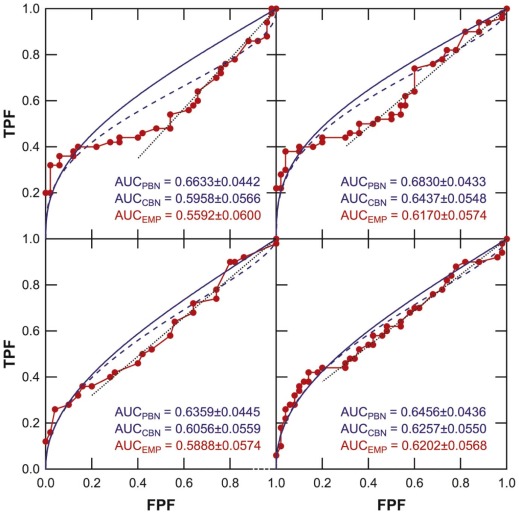
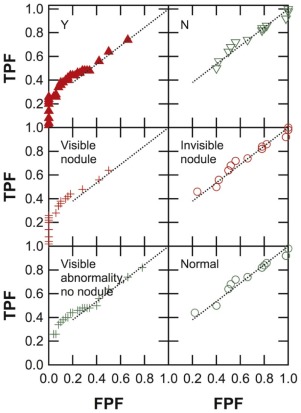
Empirical ROC curves deviated from typical ROC-curve shapes, and a portion of the curve leading to the northeast corner of the ROC space had relatively steep and constant slopes. The readers reported not seeing anything suggestive of a lung nodule in this portion of the ROC curve, which also corresponded to cases that either contained extremely subtle nodules or normal cases. The average area under the ROC curves (mean ± standard deviation) was 0.66 ± 0.02 for proper binormal, 0.62 ± 0.02 for conventional binormal, and 0.60 ± 0.03 for trapezoidal ROC curves.
Conclusions
When a radiologist does not perceive an abnormality in images that contain either extremely subtle abnormalities or no abnormalities, the ROC curve (or a portion thereof) is characterized by a straight line, which is not consistent with conventional ROC theories.
Introduction
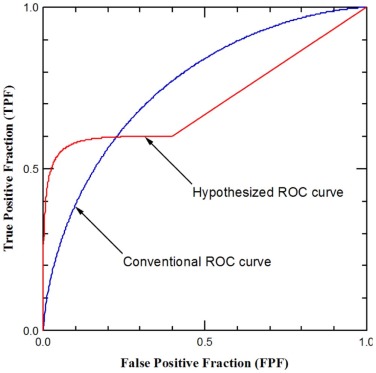
Receiver operating characteristic (ROC) analysis is a cornerstone for the evaluation of diagnostic performance in binary tasks (e.g., cancer present vs. cancer absent) . A fundamental idea of ROC analysis is that the readers could alter, essentially at will, their decision criterion to call a case positive (e.g., cancer-present), thus altering sensitivity and specificity (i.e., ROC operating point) along the readers’ ROC curve . Charles Metz explained in 1978, referring to Bayesian (or ideal observer) decision theory, that: “one can show on theoretical grounds that if the decision maker uses available information in a proper way, the slope of the ROC curve must steadily decrease (i.e., it must become less steep) as one moves up and to the right on the curve” . It is widely accepted that an ROC curve, including that of human observers, must have slopes that decrease monotonically as one moves up and to the right on the curve .
We observed recently that “occult abnormalities” in detection tasks could give rise to human observer empirical ROC curves that deviate from this shape . We defined an occult abnormality as one in an image for which, even in retrospect, when informed of its presence and location in the image, a reader is not able to identify it confidently. In radiology literature, these abnormalities are more commonly known as “extremely subtle”—to the extent that they may be not visible at all in the image 1
Get Radiology Tree app to read full this article<
. We will thus use the term “extremely subtle” here instead of “occult.” We showed in Jiang that depending on frequencies of extremely subtle abnormalities and apparently normal cases (which can be considered a counterpart of extremely subtle abnormalities because they, too, do not contain visible abnormalities), human observers’ ROC curves could have slopes that decrease monotonically (as ROC theory predicts), or remain approximately constant, or even increase—near the northeast corner of the ROC-curve space. In contrast, the ideal observer’s ROC curve always has decreasing slopes .
Get Radiology Tree app to read full this article<
Get Radiology Tree app to read full this article<
Get Radiology Tree app to read full this article<
Get Radiology Tree app to read full this article<
Get Radiology Tree app to read full this article<
Materials and Methods
Study Cases
Get Radiology Tree app to read full this article<
Get Radiology Tree app to read full this article<
Get Radiology Tree app to read full this article<
Observer Study
Get Radiology Tree app to read full this article<
Get Radiology Tree app to read full this article<
Get Radiology Tree app to read full this article<
Data Analysis
Get Radiology Tree app to read full this article<
Results
Get Radiology Tree app to read full this article<
Get Radiology Tree app to read full this article<
Get Radiology Tree app to read full this article<
Get Radiology Tree app to read full this article<
Discussion
Get Radiology Tree app to read full this article<
Get Radiology Tree app to read full this article<
Get Radiology Tree app to read full this article<
Get Radiology Tree app to read full this article<
Get Radiology Tree app to read full this article<
Get Radiology Tree app to read full this article<
Get Radiology Tree app to read full this article<
Get Radiology Tree app to read full this article<
Get Radiology Tree app to read full this article<
Get Radiology Tree app to read full this article<
Acknowledgements
Get Radiology Tree app to read full this article<
Get Radiology Tree app to read full this article<
References
1. Metz C.E.: Basic principles of ROC analysis. Semin Nucl Med 1978; 8: pp. 283-298.
2. Wagner R.F., Metz C.E., Campbell G.: Assessment of medical imaging systems and computer aids: a tutorial review. Acad Radiol 2007; 14: pp. 723-748.
3. Swets J.A., Pickett R.M.: Evaluation of diagnostic systems: methods from signal detection theory.1982.Academic PressNew York
4. Pepe M.S.: The statistical evaluation of medical tests for classification and prediction.2004.Oxford University PressNew York
5. Zhou X.-H., Obuchowski N.A., McClish D.K.: Statistical methods in diagnostic medicine.2002.Wiley-InterscienceNew York
6. Green D.M., Swets J.A.: Signal detection theory and psychophysics.1966.John Wiley and SonsNew York
7. Metz C.E., Pan X.: “Proper” binormal ROC curves: theory and maximum-likelihood estimation. J Math Psychol 1999; 43: pp. 1-33.
8. Dorfman D.D., Berbaum K.S., Metz C.E., et. al.: Proper receiver operating characteristic analysis: the bigamma model. Acad Radiol 1997; 4: pp. 138-149.
9. Pesce L.L., Metz C.E., Berbaum K.S.: On the convexity of ROC curves estimated from radiological test results. Acad Radiol 2010; 17: pp. 960-968.e964.
10. Jiang Y.: On the shape of the population ROC curve. Acad Radiol 2013; 20: pp. 897-907.
11. Armato S.G., McLennan G., Bidaut L., et. al.: The Lung Image Database Consortium (LIDC) and Image Database Resource Initiative (IDRI): a completed reference database of lung nodules on CT scans. Med Phys 2011; 38: pp. 915-931.
12. Available at: http://imaging.cancer.gov/programsandresources/InformationSystems/LIDC Accessed May 1, 2014
13. Wagner R.F., Beiden S.V., Metz C.E.: Continuous versus categorical data for ROC analysis: some quantitative considerations. Acad Radiol 2001; 8: pp. 328-334.
14. Metz C.E., Herman B.A., Shen J.H.: Maximum likelihood estimation of receiver operating characteristic (ROC) curves from continuously-distributed data. Stat Med 1998; 17: pp. 1033-1053.
15. Muhm J.R., Brown L.R., Crowe J.K.: Detection of pulmonary nodules by computed tomography. AJR Am J Roentgenol 1977; 128: pp. 267-270.
16. Henschke C.I., McCauley D.I., Yankelevitz D.F., et. al.: Early lung cancer action project: overall design and findings from baseline screening. Lancet 1999; 354: pp. 99-105.
17. Davis S.D.: CT evaluation for pulmonary metastases in patients with extrathoracic malignancy. Radiology 1991; 180: pp. 1-12.
18. Aberle D.R., Adams A.M., Berg C.D., et. al.: Reduced lung-cancer mortality with low-dose computed tomographic screening. N Engl J Med 2011; 365: pp. 395-409.
19. Sone S., Li F., Yang Z.G., et. al.: Characteristics of small lung cancers invisible on conventional chest radiography and detected by population based screening using spiral CT. Br J Radiol 2000; 73: pp. 137-145.
20. Abbey C.K., Insana M.F., Eckstein M.P., et. al.: A bivariate binormal ROC methodology for comparing new methods to an existing standard for screening applications. Proc SPIE 2007; 6515: pp. 651501-651510.
21. Ransohoff D.F., Feinstein A.R.: Problems of spectrum and bias in evaluating the efficacy of diagnostic tests. N Engl J Med 1978; 299: pp. 926-930.
22. Begg C.B., Greenes R.A.: Assessment of diagnostic tests when disease verification is subject to selection bias. Biometrics 1983; 39: pp. 207-215.
23. Gray R., Begg C.B., Greenes R.A.: Construction of receiver operating characteristic curves when disease verification is subject to selection bias. Med Decis Making 1984; 4: pp. 151-164.
24. Gur D., Rockette H.E., Armfield D.R., et. al.: Prevalence effect in a laboratory environment. Radiology 2003; 228: pp. 10-14.