
Rationale and Objectives
The objective of this study was to quantify the impact of different rounding methods on size measurements of pulmonary nodules and to determine the number of nodules that change management categories as a result of rounding.
Materials and Methods
For this retrospective institutional review board-approved study, we included 503 incidental pulmonary nodules (308 solid and 195 subsolid) from a data repository. Long and short axes were measured. Average diameters were calculated using four different rounding methods (method 1: no rounding; method 2: rounding only the average diameter to the closest millimeter; method 3: rounding only short and long axes; and method 4: rounding short and long axes and the average diameter to the closest millimeter). Nodules were classified for each rounding method according to the 2017 Fleischner Society guideline management categories. Measurements were compared among the four rounding methods using analysis of variance.
Results
Without rounding, the average nodule diameter was 15.67 ± 5.97 mm. This increased between 0.03 and 0.29 mm using rounding methods 2–4 (range: P < 0.001–0.017). The nodule size was more frequently rounded up (range: 52.1%–77.5%) than rounded down (range: 17.7%–42.5%) using rounding methods 2–4, as compared to no rounding. In the 308 solid nodules, up to 2.9% of the nodules changed management category, whereas none of the 195 subsolid nodules changed category.
Conclusions
Rounding methods have a small absolute but statically significant effect on nodule size, impacting management category in less than 3% of the nodules. This suggests that, in clinical practice, any rounding method can be used for determining nodule size without substantially biasing individual nodules toward given management categories.
Introduction
“Rounding” refers to the replacement of a number by another number of approximately the same value, but which is shorter and simpler to use . The newly published 2017 Fleischner Society guidelines for the management of pulmonary nodules recommend expressing nodule size “rounded” to the nearest millimeter . There are, however, different possible approaches to rounding the size of pulmonary nodules , but the guidelines are not explicit as to which of these approaches should be used.
Only one previous study has assessed the impact of rounding on size measurements in pulmonary nodules . Li et al.’s study was conducted in the context of computed tomography (CT) lung cancer screening and focused on the longitudinal evolution of nodule size . No previous study has investigated the influence of rounding on nodule size measurements in the context of managing incidentally detected pulmonary nodules, as described in the newly published 2017 Fleischner Society guidelines . Therefore, the purpose of our study was to quantify the impact of different rounding methods on size measurements of pulmonary nodules and to determine the number of nodules that change management categories as a result of rounding.
Materials and Methods
Study Material
Get Radiology Tree app to read full this article<
CT Acquisition
Get Radiology Tree app to read full this article<
Patient Population
Get Radiology Tree app to read full this article<
Get Radiology Tree app to read full this article<
Nodule Measurements
Get Radiology Tree app to read full this article<
Statistical Analysis
Get Radiology Tree app to read full this article<
Get Radiology Tree app to read full this article<
Get Radiology Tree app to read full this article<
Get Radiology Tree app to read full this article<
Get Radiology Tree app to read full this article<
Get Radiology Tree app to read full this article<
Get Radiology Tree app to read full this article<
Get Radiology Tree app to read full this article<
Get Radiology Tree app to read full this article<
Results
Get Radiology Tree app to read full this article<
TABLE 1
Average Computed Tomography Diameter, Expressed in Millimeter, Among the Four Rounding Methods, Displayed as Means ± Standard Deviations, Together with 95% Confidence Intervals
Method 1 Method 2 Method 3 Method 4P Values All nodules
( n = 503) 15.67 ± 5.97 (15.15–16.19)
Range: 4.30–29.90 15.71 ± 5.97 (15.18–16.23)
Range: 4.00–30.00 15.71 ± 5.98 (15.19–16.24)
Range: 4.50–30.00 15.96 ± 6.01 (15.43–16.49)
Range: 5.00–30.00 M1 vs M2: 0.017
M1 vs M3: <0.001
M1 vs M4: <0.001
M2 vs M3: 0.568
M2 vs M4: <0.001
M3 vs M4: <0.001 Solid nodules
( n = 308) 14.73 ± 5.88 (15.13–16.17)
Range: 4.30–29.90 14.79 ± 5.88 (15.16–16.21)
Range: 4.00–30.00 14.77 ± 5.90 (15.17–16.22)
Range: 4.50–30.00 15.02 ± 5.92 (15.41–16.47)
Range: 5.00–30.00 M1 vs M2: 0.001
M1 vs M3: 0.001
M1 vs M4: <0.001
M2 vs M3: 0.338
M2 vs M4: <0.001
M3 vs M4: <0.001 Subsolid nodules
( n = 195) 17.16 ± 5.83 (16.34–17.98)
Range, 7.10–29.80 17.15 ± 5.83 (16.33–17.98)
Range: 7.00–30.00 17.21 ± 5.82 (16.39–18.03)
Range: 7.00–29.50 17.44 ± 5.87 (16.61–18.27)
Range: 7.00–30.00 M1 vs M2: 0.756
M1 vs M3: 0.004
M1 vs M4: <0.001
M2 vs M3: 0.054
M2 vs M4: <0.001
M3 vs M4: <0.001
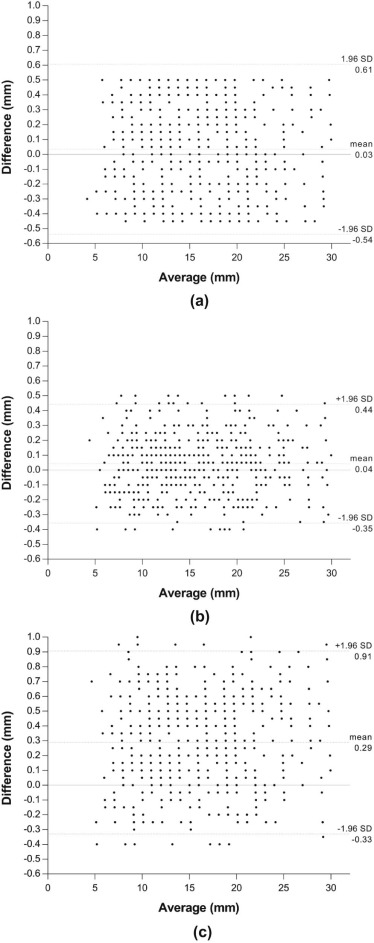
TABLE 2
Distributions of Nodules ( n = 503) That Were Rounded Up, Rounded Down, or with No Change in Nodule Diameter Using Rounding Methods 2–4 with Respect to No Rounding (Method 1)
Nodule Diameter Method 2 Method 3 Method 4 Rounded up 262 (52.1) 271 (53.9) 390 (77.5) Rounded down 214 (42.5) 184 (36.6) 89 (17.7) No change 27 (5.4) 48 (9.5) 24 (4.8)
Numbers in parentheses represent percentages.
Get Radiology Tree app to read full this article<
Get Radiology Tree app to read full this article<
Get Radiology Tree app to read full this article<
Get Radiology Tree app to read full this article<
Get Radiology Tree app to read full this article<
Get Radiology Tree app to read full this article<
TABLE 3
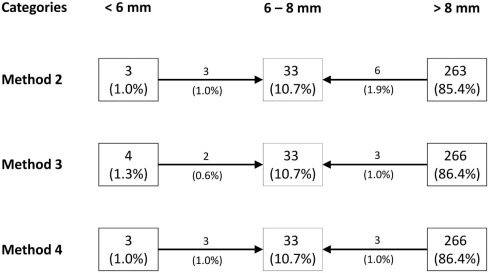
Distribution of Solid Nodules ( n = 308) for Each Rounding Method According to Management Categories in the 2017 Guidelines by the Fleischner Society
Categories Method 1 Method 2 Method 3 Method 4 <6 mm 6 (2.0) 3 (1.0) 4 (1.3) 3 (1.0) 6–8 mm 33 (10.7) 42 (13.6) 38 (12.3) 39 (12.7) >8 mm 269 (87.3) 263 (85.4) 266 (86.4) 266 (86.4)
Numbers in parentheses represent percentages.
Get Radiology Tree app to read full this article<
Discussion
Get Radiology Tree app to read full this article<
Get Radiology Tree app to read full this article<
Get Radiology Tree app to read full this article<
Get Radiology Tree app to read full this article<
Get Radiology Tree app to read full this article<
Get Radiology Tree app to read full this article<
Acknowledgment
Get Radiology Tree app to read full this article<
Get Radiology Tree app to read full this article<
References
1. Aufmann R.N., Lockwood J.S.: Essentials of mathematics: an applied approach.2014.Brooks/ColeBelmont, CA
2. MacMahon H., Naidich D.P., Goo J.M., et. al.: Guidelines for management of incidental pulmonary nodules detected on CT images: from the Fleischner Society. Radiology 2017; 2017: 161659
3. Li K., Yip R., Avila R., et. al.: Size and growth assessment of pulmonary nodules: consequences of the rounding. J Thorac Oncol 2016; 12: pp. 657-662.
4. Heidinger B.H., Anderson K.R., Moriarty E.M., et. al.: Size measurement and T-staging of lung adenocarcinomas manifesting as solid nodules ≤30 mm on CT: radiology-pathology correlation. Acad Radiol 2017;
5. Anderson K.R., Heidinger B.H., Chen Y., et. al.: Measurement bias of gross pathologic compared with radiologic tumor size of resected lung adenocarcinomas: implications for the T-stage revisions in the eighth edition of the American Joint Committee on Cancer Staging Manual. Am J Clin Pathol 2017; 147: pp. 641-648.
6. Heidinger B.H., Anderson K.R., Nemec U., et. al.: Lung adenocarcinoma manifesting as pure ground-glass nodules: correlating CT size, volume, density, and roundness with histopathologic invasion and size. J Thorac Oncol 2017;
7. Nemec U., Heidinger B.H., Anderson K.R., et. al.: Software-based risk stratification of pulmonary adenocarcinomas manifesting as pure ground glass nodules on computed tomography. Eur Radiol 2017;
8. Bluman A.G.: Elementary statistics: a step by step approach.2014.McGraw-Hill EducationNew York, NY
9. Abdi H.: Bonferroni and Šidák corrections for multiple comparisons.Salkind N.Encyclopedia of measurement and statistics.2007.SageThousand Oaks (CA):
10. Bland J.M., Altman D.G.: Statistical methods for assessing agreement between two methods of clinical measurement. Lancet 1986; 1: pp. 307-310.
11. Callister M.E., Baldwin D.R., Akram A.R., et. al.: British thoracic society guidelines for the investigation and management of pulmonary nodules. Thorax 2015; 70: pp. ii1-ii54.
12. Gould M.K., Donington J., Lynch W.R., et. al.: Evaluation of individuals with pulmonary nodules: when is it lung cancer? Diagnosis and management of lung cancer, 3rd ed: American College of Chest Physicians evidence-based clinical practice guidelines. Chest 2013; 143: pp. e93S-120S.
13. Bogot N.R., Kazerooni E.A., Kelly A.M., et. al.: Interobserver and intraobserver variability in the assessment of pulmonary nodule size on CT using film and computer display methods. Acad Radiol 2005; 12: pp. 948-956.
14. Reeves A.P., Biancardi A.M., Apanasovich T.V., et. al.: The Lung Image Database Consortium (LIDC): a comparison of different size metrics for pulmonary nodule measurements. Acad Radiol 2007; 14: pp. 1475-1485.
15. Revel M.P., Bissery A., Bienvenu M., et. al.: Are two-dimensional CT measurements of small noncalcified pulmonary nodules reliable?. Radiology 2004; 231: pp. 453-458.
16. Petkovska I., Brown M.S., Goldin J.G., et. al.: The effect of lung volume on nodule size on CT. Acad Radiol 2007; 14: pp. 476-485.
17. Petrou M., Quint L.E., Nan B., et. al.: Pulmonary nodule volumetric measurement variability as a function of CT slice thickness and nodule morphology. AJR Am J Roentgenol 2007; 188: pp. 306-312.
18. Ravenel J.G., Leue W.M., Nietert P.J., et. al.: Pulmonary nodule volume: effects of reconstruction parameters on automated measurements–a phantom study. Radiology 2008; 247: pp. 400-408.
19. Wang Y., de Bock G.H., van Klaveren R.J., et. al.: Volumetric measurement of pulmonary nodules at low-dose chest CT: effect of reconstruction setting on measurement variability. Eur Radiol 2010; 20: pp. 1180-1187.
20. Goo J.M., Tongdee T., Tongdee R., et. al.: Volumetric measurement of synthetic lung nodules with multi-detector row CT: effect of various image reconstruction parameters and segmentation thresholds on measurement accuracy. Radiology 2005; 235: pp. 850-856.
21. Ko J.P., Rusinek H., Jacobs E.L., et. al.: Small pulmonary nodules: volume measurement at chest CT–phantom study. Radiology 2003; 228: pp. 864-870.
22. Pinsky P.F., Gierada D.S., Black W., et. al.: Performance of Lung-RADS in the National Lung Screening Trial: a retrospective assessment. Ann Intern Med 2015; 162: pp. 485-491.
23. Ridge C.A., Huang J., Cardoza S., et. al.: Comparison of multiplanar reformatted CT lung tumor measurements to axial tumor measurement alone: impact on maximal tumor dimension and T stage. AJR Am J Roentgenol 2013; 201: pp. 959-963.
24. Zhao B., James L.P., Moskowitz C.S., et. al.: Evaluating variability in tumor measurements from same-day repeat CT scans of patients with non-small cell lung cancer. Radiology 2009; 252: pp. 263-272.
25. Bhure U.N., Lardinois D., Kalff V., et. al.: Accuracy of CT parameters for assessment of tumour size and aggressiveness in lung adenocarcinoma with bronchoalveolar elements. Br J Radiol 2010; 83: pp. 841-849.