
Rationale and Objectives
To determine physicians’ preference toward three types of structured imaging reports (basic structured report [BSR], itemized report [IR], and point-and-click report [PCR]) used in emergency radiology.
Materials and Methods
Survey questions were created and considered valid and reliable based on index of item objective congruence from three specialists (>0.75) and a pilot of 25 subjects (Cronbach alpha, 0.83–1.00). Respondents included trainees and attendings in radiology and referring physicians working in the academic emergency department at the time of survey rollout. They were provided report examples of each type and asked to complete a questionnaire consisting of the following five parts: demographics, necessity of imaging report, report quality (content, format and organization, and language), process of reporting, and components of imaging report. For rating scores, the higher value means the higher preference and agreement.
Results
The survey received 79.5% response rate. Respondents included 101 physicians (mean age, 29.4 years; 61 radiology physicians and 40 referring physicians; 81 trainees and 20 attending). Overall, IR was preferred over PCR and BSR by all physicians with scores (out of 10) as follows: IR, 7.62–8.83; PCR, 6.62–8.55; BSR, 5.23–6.65; P < .001. IR received scores (out of 5) of 4.03–4.37, PCR 3.32–4.52, and BSR 2.59–3.86 for report quality. For process of reporting, IR had scores (out of 5) of 3.80–4.56, PCR 2.79–4.09, and BSR 2.32–3.56.
Conclusions
In emergency setting, physicians preferred IR over PCR and BSR. IR and PCR were equal in report quality metrics, but IR was most preferred in the process of reporting. BSR ranked last in both quality and process.
The imaging report is a dominant communication method between radiologists and referring physicians. It helps guide patient care by providing diagnostic information for decision making and reference for further investigations . Quality clinical care provided through the use of imaging reports depends on the reports’ timeliness and accuracy as much as their clarity and consistency. The need for clarity and consistency of imaging reports is a major drive for the radiology practice to change from conventional free-text reporting to structured reporting pattern . All structured reports share three essential attributes: structured format, consistent organization, and standard language . Being structurally formatted with consistent organization and standard language, structured reports are believed to be easier to use, read, and understand by both radiology and referring physicians . Several surveys show a strong preference for these types of reports .
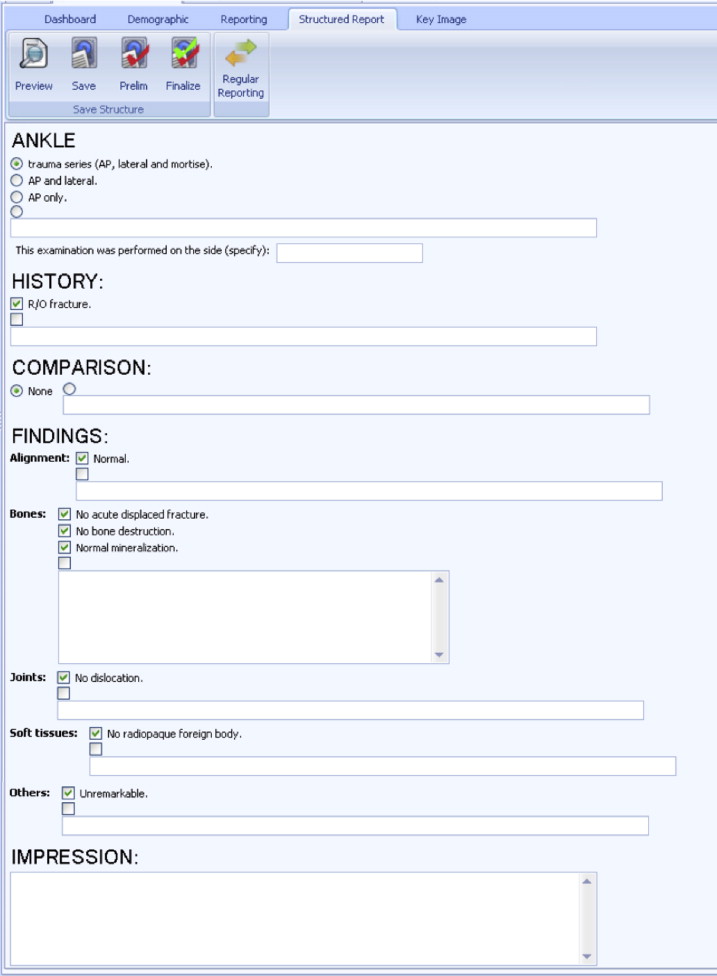
There are three main variations of structured reports: basic structured report (BSR), itemized report (IR), and point-and-click report (PCR). BSR is the rudimentary one consisting only of basic headings such as examination type, clinical information, findings, and conclusion. IR is developed from BSR by adding subheadings under sections. PCR was introduced along with the development of Breast Imaging Reporting and Data System . In PCR, clickable options of standardized texts are added underneath headings and subheadings. This allows the radiologist to point (with a computer mouse) and click on provided checkboxes or drop-down lists of options, instead of having to dictate or type texts. PCR potentially allows more standardized report format, content, language, and improved report clarity and consistency. In 2008, the Radiological Society of North America’s (RSNA) reporting committee initiated a project to create and share PCR templates on the Web site, radreports.org . They believe that these report templates represent best practices that can be adjusted and adopted based on local preferences. However, there are still many controversies on suitability and likeability of different forms of structured report in different imaging settings .
Get Radiology Tree app to read full this article<
Materials and methods
Get Radiology Tree app to read full this article<
Report Definitions and Patterns of Reporting
Get Radiology Tree app to read full this article<
Table 1
Examples of Three Types of Structured Report
Type Report Basic structured report Ultrasound of the upper abdomen
History: A 43-year-old woman presented with acute right upper quadrant pain for 2 days. She was sent to rule out acute cholecystitis.
Comparison: None.
Findings:
The study reveals normal size and diffuse increased parenchymal echopattern of the liver. There is no space-occupying lesion. No biliary ductal dilatation is seen. The CBD is not dilated, measuring about 0.4 cm in diameter. The gallbladder is distended with wall thickening, measuring about 4 mm in thickness. Multiple gallstones at gallbladder neck with bile sludge, measured about 1.6–2.0 cm in size. Sonographic Murphy’s sign is positive. No pericholecystic fluid is detected.
The pancreas appears unremarkable. The spleen is of prominent size without focal lesion.
The right and left kidneys are normal in size and parenchymal echopattern, measuring about 4.3 × 10.8 cm and 4.3 × 9.3 cm in size, respectively. There is no renal stone or cyst. No hydronephrosis is detected.
No free fluid is seen.
Impression:
Itemized report Ultrasound of the upper abdomen
History: A 43-year-old woman presented with acute right upper quadrant pain for 2 days. She was sent to rule out acute cholecystitis.
Comparison: None.
Findings:
Liver: Mild diffuse increased liver echogenicity without space-occupying lesion.
Gallbladder and biliary system: Distended gallbladder with wall thickening, measuring about 4 mm in thickness. Multiple gallstones at gallbladder neck with bile sludge, measured about 1.6–2.0 cm in size. Sonographic Murphy’s sign is positive. No pericholecystic fluid is detected. The common bile duct is not dilated, measuring about 0.4 cm in diameter. There is no intrahepatic ductal dilatation.
Spleen: Prominent in size without focal lesion.
Pancreas: Visualized portions are unremarkable.
Kidneys: No stone, hydronephrosis, or solid mass. Right and left kidneys measure about 10.2 × 5.0 and 10.7 × 5.7 cm in size, respectively.
Aorta: Normal caliber.
Peritoneum: No free fluid.
Impression:
Point-and-click report Ultrasound of the upper abdomen
History: A 43-year-old woman presented with acute right upper quadrant pain for 2 days. She was sent to rule out acute cholecystitis.
Techniques: Routine gray-scale imaging
Comparison: None
Findings:
Liver: Mild diffuse increased liver echogenicity without space-occupying lesion.
Gallbladder: Sonographic Murphy sign positive. Multiple gallstones at gallbladder neck with bile sludge, measured about 1.6–2.0 cm in size. There is gallbladder wall thickening (thickness = 4 mm).
Spleen: Prominent in size.
Visualized pancreas: Visualized portions are unremarkable.
Right kidney: Normal.
Left kidney: Normal.
Abdominal aorta: Normal.
IVC: Normal.
Peritoneal cavity: No free fluid or collection.
Impression:
CBD, common bile duct; IVC, inferior vena cava.
Get Radiology Tree app to read full this article<
Get Radiology Tree app to read full this article<
Get Radiology Tree app to read full this article<
RSNA-Style Point-and-Click Reporting
Get Radiology Tree app to read full this article<
Get Radiology Tree app to read full this article<
Questionnaire Construction
Get Radiology Tree app to read full this article<
Get Radiology Tree app to read full this article<
Study Population, Study Period, and Questionnaire Administration
Get Radiology Tree app to read full this article<
Statistical Analysis
Get Radiology Tree app to read full this article<
Results
Respondents’ Characteristics
Get Radiology Tree app to read full this article<
Table 2
Characteristics of Questionnaire’s Respondents ( n = 101)
Characteristics Radiology Physicians ( n = 61) Referring Physicians ( n = 40) Total ( n = 101) Male gender, n (%) 12 (19.7) 21 (52.5) 33 (32.7) Mean age (SD), years 28.8 (2.6) 30.3 (5.0) 29.4 (3.8) Median years in practice (range) 4 (1–18) 4 (0–20) 4 (0–20) Position: trainee vs. attending 53:8 28:12 81:20 Specialty, n (%) Radiology 61 N/A 61 (60.4) Emergency medicine N/A 33 33 (32.7) Internal medicine N/A 6 6 (5.9) Surgery N/A 1 1 (1) Estimated numbers of emergency US/CT reports read/interpreted per week, n (%) 0–10 reports 23 10 33 (32.7) 11–20 reports 18 15 33 (32.7) 21–30 reports 11 9 20 (19.8) 31–40 reports 4 4 8 (7.9) 41–50 reports 1 1 5 (5) >50 reports 1 1 2 (2) Estimated numbers of emergency radiography reports read/interpreted per week, n (%) 0–10 reports 17 10 27 (26.7) 11–20 reports 8 9 17 (16.8) 21–30 reports 15 10 25 (24.8) 31–40 reports 9 5 14 (13.9) 41–50 reports 6 3 9 (8.9) >50 reports 6 3 9 (8.9)
CT, computed tomography; N/A, not available; SD, standard deviation; US, ultrasound.
Get Radiology Tree app to read full this article<
Overall Satisfaction of Three Types of Imaging Report (BSR, IR, and PCR)
Get Radiology Tree app to read full this article<
Table 3
Comparison of Satisfaction Rating to Three Types of Imaging Report
Mean satisfaction BSR IR PCR_P_ Value Mean satisfaction for US/CT report (SD) All physicians ( n = 101) 6.05 (1.79) 8.70 (1.07) 7.19 (1.93) <.001 ∗ Radiology physicians ( n = 61) 5.67 (1.87) 8.62 (1.14) 6.62 (2.07) Referring physicians ( n = 40) 6.63 (1.51) 8.83 (0.96) 8.05 (1.30) Mean satisfaction for radiography report (SD) All physicians ( n = 74) 6.00 (1.74) 8.66 (1.02) 8.04 (1.68) <.001 ∗ Radiology physicians ( n = 34) 5.23 (1.81) 8.68 (0.94) 7.44 (2.01) Referring physicians ( n = 40) 6.65 (1.41) 8.65 (1.10) 8.55 (1.31)
BSR, basic structured report; CT, computed tomography; IR, itemized report; PCR, point-and-click report; SD, standard deviation; US, ultrasound.
Highest possible score was 10. Higher score represented higher preference.
Get Radiology Tree app to read full this article<
Get Radiology Tree app to read full this article<
Reports Quality (Contents, Format and Organization, Language)
Get Radiology Tree app to read full this article<
Table 4
Mean Agreement Scores for Quality of Three Types of Imaging Report
Report Quality Mean Agreement Scores (SD) for US/CT Report Mean Agreement Scores (SD) for Radiography Report BSR IR PCR_P_ Value BSR IR PCR_P_ Value Content 3.86 (0.70) 4.35 (0.56) 4.03 (0.71) <.001 ∗ 3.61 (0.81) 4.33 (0.59) 4.17 (0.70) <.001 † Format and organization 2.59 (0.92) 4.33 (0.59) 4.38 (0.65) <.001 † 2.69 (1.09) 4.35 (0.61) 4.52 (0.61) <.001 † Language 3.11 (0.95) 4.03 (0.63) 4.17 (0.65) <.001 † 3.17 (1.12) 4.13 (0.66) 4.32 (0.64) <.001 † Process of reporting 3.05 (0.74) 4.34 (0.48) 3.32 (0.87) <.001 ∗ 3.00 (0.89) 4.37 (0.42) 3.47 (0.92) <.001 ‡
BSR, basic structured report; CT, computed tomography; IR, itemized report; PCR, point-and-click report; SD, standard deviation; US, ultrasound.
Highest possible score was 5. Higher score represented higher preference ( n = 101).
Get Radiology Tree app to read full this article<
Get Radiology Tree app to read full this article<
Get Radiology Tree app to read full this article<
Get Radiology Tree app to read full this article<
Get Radiology Tree app to read full this article<
Process of Reporting
Get Radiology Tree app to read full this article<
Table 5
Mean Agreement Scores for Process of Reporting of Three Types of Imaging Report
Questions Mean Agreement Scores (SD) for US/CT Report Mean Agreement Scores (SD) for Radiography Report BSR IR PCR_P_ Value BSR IR PCR_P_ Value Overall process of reporting 3.05 (0.74) 4.34 (0.48) 3.32 (0.87) <.001 ∗ 3.00 (0.89) 4.37 (0.42) 3.47 (0.92) <.001 † I am familiar with using this type of report 3.13 (1.07) 4.46 (0.70) 2.79 (1.02) <.001 ∗ 3.18 (1.14) 4.5 (0.66) 2.91 (1.22) <.001 ∗ I am able to type imaging report easily 3.39 (1.16) 4.56 (0.62) 3.10 (1.17) <.001 ∗ 3.50 (1.24) 4.53 (0.56) 3.35 (1.13) <.001 ∗ I am able to add words/sentence in the imaging report easily 3.56 (1.09) 4.51 (0.60) 2.95 (1.18) <.001 † 3.53 (1.16) 4.56 (0.56) 3.15 (1.05) <.001 ∗ I am able to correct words in imaging report easily 3.54 (0.99) 4.46 (0.65) 2.93 (1.18) <.001 † 3.41 (1.18) 4.38 (0.60) 3.09 (1.19) <.001 ∗ The reporting pattern helps decrease the duration of report creation 2.49 (0.92) 4.28 (0.64) 3.62 (1.23) <.001 † 2.41 (0.99) 4.32 (0.59) 3.68 (1.34) <.001 † The style of imaging reporting is helpful in image interpretation process 2.74 (1.15) 4.33 (0.63) 4.05 (0.85) <.001 ‡ 2.62 (1.28) 4.35 (0.65) 4.09 (0.97) <.001 ‡ The style of imaging reporting is helpful in correct grammar and decreased misspelling 2.53 (0.87) 3.80 (0.70) 3.82 (1.08) <.001 ‡ 2.32 (1.07) 3.91 (0.71) 4.03 (1.03) <.001 ‡
BSR, basic structured report; CT, computed tomography; IR, itemized report; PCR, point-and-click report; SD, standard deviation; US, ultrasound.
Highest possible score was 5. Higher score represented higher preference (only radiology physicians were respondents to this set of questions; n = 61 in US/CT, and n = 34 in plain radiography.)
Get Radiology Tree app to read full this article<
Get Radiology Tree app to read full this article<
Get Radiology Tree app to read full this article<
Get Radiology Tree app to read full this article<
Reports Component
Get Radiology Tree app to read full this article<
Table 6
Components That Should Be Included in Imaging Report According to Questionnaire Respondents ( n = 101)
Report Components Number of Physicians Stating That This Component Should Be Included in Imaging Report (% of Total) Radiology Physicians ( n = 61), n (%) Referring Physicians ( n = 40), n (%) Total, n (%) History 61 (100) 38 (95.0) 99 (98.0) Techniques 59 (96.7) 35 (87.5) 94 (93.1) Route, dose, and brand name of any contrast media used 46 (75.4) 31 (77.5) 77 (76.2) Comparison study 61 (100) 39 (97.5) 100 (99.0) Radiation dose 29 (47.5) 13 (32.5) 42 (41.6) Quality of examination 44 (72.1) 37 (92.5) 81 (80.2) Size of normal organs, eg, kidney 48 (78.7) 36 (90.0) 84 (83.2) Recommendation for further imaging 59 (96.7) 40 (100) 99 (99.0) Recommendation for nonimaging technique, eg, biopsy, ERCP, and tissue diagnosis 48 (78.7) 35 (87.5) 83 (82.2) Recommendations for further treatment, eg, chest drain is advised 25 (41.0) 22 (55.0) 47 (46.5) Recommendation from organization, eg, follow-up lung nodule 55 (90.2) 36 (90.0) 91 (90.1) Document of urgent finding communication 60 (98.4) 39 (97.5) 96 (95.1)
ERCP, Endoscopic retrograde cholangiopancreatography.
Get Radiology Tree app to read full this article<
Get Radiology Tree app to read full this article<
Discussion
Radiology Physicians
Get Radiology Tree app to read full this article<
Get Radiology Tree app to read full this article<
Get Radiology Tree app to read full this article<
Referring Physicians
Get Radiology Tree app to read full this article<
Get Radiology Tree app to read full this article<
Which Format Is Best and Which Components Should Be Included in Emergency Imaging Reports?
Get Radiology Tree app to read full this article<
Get Radiology Tree app to read full this article<
Limitations
Get Radiology Tree app to read full this article<
Get Radiology Tree app to read full this article<
Get Radiology Tree app to read full this article<
Get Radiology Tree app to read full this article<
Future directions and conclusions
Get Radiology Tree app to read full this article<
Acknowledgments
Get Radiology Tree app to read full this article<
Appendix 1
Survey Questionnaires
Get Radiology Tree app to read full this article<
Part I: Personal information Age (years) Gender (male, female) Specialty (Radiology, emergency medicine, internal medicine, surgery, others) Position (resident 1, resident 2, resident 3, fellow, staff) Years after graduation (years) Estimated numbers of emergency US/CT reports read/interpret per week (0–10 reports, 11–20 reports, 21–30 reports, 31–40 reports, 41–50 reports, >50 reports) Estimated numbers of emergency x-ray reports read/interpret per week (0–10 reports, 11–20 reports, 21–30 reports, 31–40 reports, 41–50 reports, >50 reports)Part II: Satisfaction rating of three types of imaging report (basic structured report; BSR, itemized report; IR, point-and-click report; PCR)
Examples of reports in three types are provided. Overall preference for each type of report (score 1–10) Content: (score 1–5) Complete coverage of organs in the study Complete description of abnormalities Complete description of normal structures Adequacy to answer clinical question Format and organization: (score 1–5) Consistent format Easiness to find needed information Brevity with adequate information Language: (score 1–5) Use of standard, easy-to-understand English Consistent pattern Correct English grammar with lack of grammatical errors Additional comments (open-ended question)Part III: Process of reporting (score 1–5) You are familiar with this reporting pattern Easy input of report contents Easy addition of contents Easy editing Reduced reporting time Supporting diagnostic thinking process Correct language use and spellingPart IV: Components in report (should have, should not have) History Techniques Route, dose, and brand name of any contrast media used Comparison study Radiation dose Quality of examination Size of normal organs Recommendation for further imaging Recommendation for non-imaging technique e.g. biopsy, ERCP, tissue diagnosis Recommendation for further treatment e.g. chest drain is advised Recommendation from organization e.g. follow-up lung nodule Document of urgent finding communication
Get Radiology Tree app to read full this article<
Get Radiology Tree app to read full this article<
References
1. Pool F., Goergen S.: Quality of the written radiology report: a review of the literature. J Am Coll Radiol 2010; 7: pp. 634-643.
2. Johnson A.J., Chen M.Y., Swan J.S., et. al.: Cohort study of structured reporting compared with conventional dictation. Radiology 2009; 253: pp. 23-25.
3. Weiss D.L., Langlotz C.P.: Structured reporting: patient care enhancement or productivity nightmare?. Radiology 2008; 249: pp. 739-747.
4. Sistrom C.L., Langlotz C.P.: A framework for improving radiology reporting. J Am Coll Radiol 2005; 2: pp. 159-167.
5. Naik S.S., Hanbidge A., Wilson S.R.: Radiology reports: examining radiologist and clinician preferences regarding style and content. AJR Am J Roentgenol 2001; 176: pp. 591-598.
6. Grieve F.M., Plumb A.A., Khan S.H.: Radiology reporting: a general practitioner’s perspective. Br J Radiol 2010; 83: pp. 17-22.
7. Sistrom C.L., Honeyman-Buck J.: Free text versus structured format: information transfer efficiency of radiology reports. AJR Am J Roentgenol 2005; 185: pp. 804-812.
8. Plumb A.A., Grieve F.M., Khan S.H.: Survey of hospital clinicians’ preferences regarding the format of radiology reports. Clin Radiol 2009; 64: pp. 386-394.
9. Schwartz L.H., Panicek D.M., Berk A.R., et. al.: Improving communication of diagnostic radiology findings through structured reporting. Radiology 2011; 260: pp. 174-184.
10. Kahn C.E., Langlotz C.P., Burnside E.S., et. al.: Toward best practices in radiology reporting. Radiology 2009; 252: pp. 852-856.
11. Radiology Society of North America informatics reporting. Available at URL: http://www.radreport.org . Accessed May 2, 2014.
12. Rovinelli R.J., Hambleton R.K.: On the use of content specialists in the assessment of criterion-referenced test item validity. Dutch J Educ Res 1977; 2: pp. 49-60.
13. Bosmans J.M.L., Weyler J.J., Schepper A.M., et. al.: The radiology report as seen by radiologists and referring clinicians: result of the COVER and ROVER surveys. Radiology 2011; 259: pp. 184-195.
14. McLoughlin R.F., So C.B., Gray R.R., et. al.: Radiology reports: how much descriptive detail is enough?. AJR Am J Roentgenol 1995; 165: pp. 803-806.
15. Clinger N.J., Hunter T.B., Hillman B.J.: Radiology reporting: attitudes of referring physicians. Radiology 1988; 169: pp. 825-826.
16. Barbosa F., Maciel L., Vieira E.M., et. al.: Radiological reports: a comparison between the transmission efficiency of information in free text and in structured reports. Clinics (Sao Paulo) 2010; 65: pp. 15-21.
17. Larson D.B., Towbin A.J., Pryor R.M., et. al.: Improving consistency in radiology reporting through the use of department-wide standardized structured reporting. Radiology 2013; 267: pp. 240-250.
18. European Society of Radiology: Good practice for radiological reporting. Guidelines from European Society of Radiology (ESR). Insights Imaging 2011; 2: pp. 93-96.
19. Gunn A.J., Sahani D.V., Bennette S.E., et. al.: Recent measures to improve radiology reporting: perspectives from primary care physicians. J Am Coll Radiol 2013; 10: pp. 122-127.
20. Coakley F.V., Gould R., Yeh B.M., et. al.: CT radiation dose: what can you do right now in your practice?. AJR Am J Roentgenol 2011; 196: pp. 619-662.
21. Neumann R.D., Bluemke D.A.: Tracking radiation exposure from diagnostic imaging devices at the NIH. J Am Coll Radiol 2010; 7: pp. 87-89.
22. Yu J.P., Kansagra A.P., Naeger D.M., et. al.: Template-driven computed tomography radiation dose reporting: implementation of a radiology housestaff quality improvement project. Acad Radiol 2013; 20: pp. 769-772.
23. California’s Radiation Dose Reporting Law. Available at URL: http://www.leginfo.ca.gov/pub/09-10/bill/sen/sb_1201-1250/sb_1237_bill_20100929_chaptered.html . Accessed May 2, 2014.
24. Gökce S.D., Gökce E., Coskun M.: Radiology residents’ awareness about ionizing radiation dose in imaging studies and their cancer risk during radiological examinations. Korean J Radiol 2012; 13: pp. 202-209.
25. American college of Radiology. Practice guideline for communication of diagnostic imaging findings. Available at URL: http://www.acr.org/∼/media/C5D1443C9EA4424AA12477D1AD1D927D.pdf . Last update 2010. Accessed May 2, 2014.
26. Sistrom C.L., Dreyer K.J., Dang P.P., et. al.: Recommendations for additional imaging in radiology reports: multifactorial analysis of 5.9 million examinations. Radiology 2009; 253: pp. 453-461.