
Rationale and Objectives
Two decades have passed since the publication of laboratory studies of satisfaction of search (SOS) in chest radiography. Those studies were performed using film. The current investigation tests for SOS effects in computed radiography of the chest.
Methods
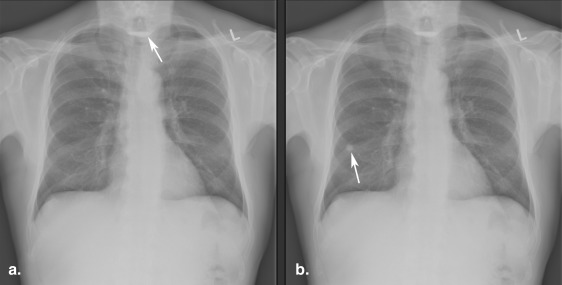
Sixty-four chest computed radiographs half demonstrating various “test” abnormalities were read twice by 20 radiologists, once with and once without the addition of a simulated pulmonary nodule. Receiver-operating characteristic detection accuracy and decision thresholds were analyzed to study the effects of adding the nodule on detecting the test abnormalities. Results of previous studies were reanalyzed using similar modern techniques.
Results
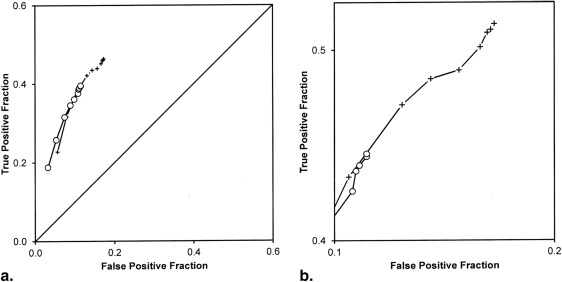
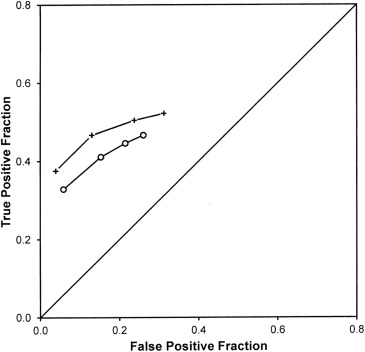
In the present study, adding nodules did not influence detection accuracy for the other abnormalities ( P = .93), but did induce a reluctance to report them ( P < .001). Adding nodules did not affect inspection time ( P = .58) so the reluctance to report was not associated with reduced search. Reanalysis revealed a similar decision threshold shift that had not been recognized in the early studies of SOS in chest radiography ( P < .01) in addition to reduced detection accuracy ( P < .01).
Conclusions
The nature of SOS in chest radiography has changed, but it is not clear why.
Advances in Knowledge
SOS may be changing as a function of changes in radiology education and practice.
Laboratory studies have demonstrated a satisfaction of search (SOS) effect in chest radiography, with reduced accuracy in detecting native abnormalities on chest radiographs in the presence of simulated pulmonary nodules . Various abnormalities were missed when a pulmonary nodule was present (SOS condition), but detected when the nodule was absent (non-SOS condition). The original experiment on SOS effects in chest radiography was conducted 25 years ago and the most recent replication 15 years ago. Both of those studies demonstrated a reduction in detection accuracy as a function of SOS. The practice of radiology has changed significantly in the last 2 decades. Film has given way to digital imaging. The utilization of computed tomography (CT) and magnetic resonance (MR) examinations has dramatically increased, and advanced imaging is often the preferred initial examination. Resolution and quality of those modalities have improved significantly. There have been corresponding changes of emphasis in the training of radiologists.
Get Radiology Tree app to read full this article<
Materials and methods
Experimental Conditions
Get Radiology Tree app to read full this article<
Get Radiology Tree app to read full this article<
Cases and Readers
Get Radiology Tree app to read full this article<
Table 1
Native Abnormalities in Case Sample
Native Abnormality Number Aneurysm, chest 3 Aortic calcification 1 Asbestosis 1 Cardiomegaly 1 Cervical ribs 2 Clavicle fracture 1 Dilated esophagus 1 Free air hemidiaphragm 2 Gallstones 1 Gastric air shadow compressed 1 Hiatal hernia 2 Middle lobe collapse 1 Morgagni hernia 1 Pneumonia 1 Pneumothorax 2 Renal stone 1 Rib fractures 2 Right-sided aortic arch 2 Scapula fracture 1 Tracheal deviation, neck mass 4 Tuberculosis 1 Zenker’s diverticulum 1
Get Radiology Tree app to read full this article<
Get Radiology Tree app to read full this article<
Get Radiology Tree app to read full this article<
Simulation of Pulmonary Nodules on Chest Radiographs
Get Radiology Tree app to read full this article<
Get Radiology Tree app to read full this article<
Get Radiology Tree app to read full this article<
Get Radiology Tree app to read full this article<
“Simulated nodules sometimes may have had steeper edges than native nodules rendering them more detectable. This was not a problem for the current investigation because we measured only the detection of target lesions.” —Page 136
Get Radiology Tree app to read full this article<
Get Radiology Tree app to read full this article<
Image Display
Get Radiology Tree app to read full this article<
Procedure
Get Radiology Tree app to read full this article<
Scoring
Get Radiology Tree app to read full this article<
Get Radiology Tree app to read full this article<
Statistical Analysis
Detection Accuracy
Get Radiology Tree app to read full this article<
Get Radiology Tree app to read full this article<
Shift in Decision Thresholds
Get Radiology Tree app to read full this article<
Get Radiology Tree app to read full this article<
Response Time
Get Radiology Tree app to read full this article<
Results
Get Radiology Tree app to read full this article<
Get Radiology Tree app to read full this article<
Diagnostic Accuracy
Get Radiology Tree app to read full this article<
Table 2
ROC Accuracy
Using All FP Responses Non-SOS Condition SOS Condition Difference F(1,19)P Empirical ROC TP@FP = 0.1 0.329 0.326 0.003 0.01 .9272 Contaminated binormal model ROC curve TP@FP = .1 0.332 0.330 0.002 0.01 .9380
Using only non-nodule FP responses Non-SOS condition SOS condition Difference F(1,19)P Empirical ROC TP@FP = 0.1 0.362 0.376 −0.014 0.21 .6525 Contaminated binormal model ROC curve TP@FP = 0.1 0.382 0.390 −0.008 0.05 .8211
FP, false positive; ROC, receiver-operating characteristic; SOS, satisfaction of search; TP, true positive.
Get Radiology Tree app to read full this article<
Decision Thresholds
Get Radiology Tree app to read full this article<
Get Radiology Tree app to read full this article<
Table 3
Analysis of Thresholds
True Positive Fractions Non-SOS Condition SOS Condition F(1,18)P Significance Level Most conservative threshold 0.225 0.186 5.70 .0282 * Most lenient threshold 0.467 0.395 12.18 .0026 ** Center of range 0.346 0.290 15.60 .0009 *** Width of range 0.242 0.209 1.87 .1888
False-positive fractions reporting non-nodule abnormality Non-SOS condition SOS condition F(1,18)P Significance level Most conservative threshold 0.056 0.033 5.86 .0263 * Most lenient threshold 0.174 0.116 6.71 .0185 * Center of range 0.115 0.075 9.66 .0061 ** Width of range 0.118 0.083 2.45 .1350
False-positive fractions reporting any abnormality Non-SOS condition SOS condition F(1,18)P Significance level Most conservative threshold 0.073 0.046 7.81 .0120 * Most lenient threshold 0.263 0.172 11.38 .0034 ** Center of range 0.168 0.109 13.25 .0019 ** Width of range 0.190 0.126 6.93 .0169 *
SOS, satisfaction of search.
\* P < .05; ** P < .01; *** P < .001.
Get Radiology Tree app to read full this article<
Get Radiology Tree app to read full this article<
Get Radiology Tree app to read full this article<
Inspection Time
Get Radiology Tree app to read full this article<
Discussion
Get Radiology Tree app to read full this article<
Get Radiology Tree app to read full this article<
Get Radiology Tree app to read full this article<
Get Radiology Tree app to read full this article<
Get Radiology Tree app to read full this article<
Get Radiology Tree app to read full this article<
Acknowledgment
Get Radiology Tree app to read full this article<
Appendix A
1990 and 2000 SOS experiments reconsidered
Get Radiology Tree app to read full this article<
Get Radiology Tree app to read full this article<
Get Radiology Tree app to read full this article<
Get Radiology Tree app to read full this article<
Get Radiology Tree app to read full this article<
Table 4
Analysis of Thresholds From 1990 and 2000
True-Positive Fractions Non-SOS Condition SOS Condition F(1,18)P Significance Level Most conservative threshold 0.443 0.389 9.47 .0068 ** Most lenient threshold 0.597 0.519 19.81 .0004 *** Center of range 0.520 0.454 18.67 .0005 *** Width of range 0.154 0.130 2.03 .1727
False-positive fractions reporting non-nodule abnormality Non-SOS condition SOS condition F(1,18)P Significance level Most conservative threshold 0.043 0.053 0.87 .3636 Most lenient threshold 0.328 0.247 8.37 .0101 * Center of range 0.185 0.150 5.52 .0311 * Width of range 0.285 0.195 9.52 .0067 **
SOS, satisfaction of search.
\* P < .05; ** P < .01; *** P < .001.
Get Radiology Tree app to read full this article<
Appendix B
Note on analysis of decision thresholds
Get Radiology Tree app to read full this article<
Table 5
Illustration of Inheritance of Response Probability From More Conservative Operating Points
Patient Type Confidence Rating No Report 10% 20% 30% 40% 50% 60% 70% 80% 90% 100% Observed response frequencies Normal patients (31) 27 0 0 2 1 0 0 1 0 0 0 Abnormal patients (33) 10 1 0 4 2 0 1 3 5 6 1 Observed response probabilities Normal patients 0.87 0.00 0.00 0.06 0.03 0.00 0.00 0.03 0.00 0.00 0.00 Abnormal patients 0.30 0.03 0.00 0.12 0.06 0.00 0.03 0.09 0.15 0.18 0.03 Observed ROC points Normal patients 1.000.130.13 0.13 0.060.030.03 0.03 0.00 0.00 0.00 Abnormal patients 1.00 0.700.67 0.67 0.550.48 0.48 0.45 0.36 0.21 0.03
Values in bold correspond to probabilities of response.
Get Radiology Tree app to read full this article<
References
1. Berbaum K.S., Franken E.A., Dorfman D.D., et. al.: Satisfaction of search in diagnostic radiology. Invest Radiol 1990; 25: pp. 133-140.
2. Berbaum K.S., Dorfman D.D., Franken E.A., et. al.: Proper ROC analysis and joint ROC analysis of the satisfaction of search effect in chest radiography. Acad Radiol 2000; 7: pp. 945-958.
3. Samei E., Flynn M.J., Eyler W.R.: Simulation of subtle lung nodules in projection chest radiography. Radiology 1997; 202: pp. 117-124.
4. Samei E., Flynn M.J., Eyler W.R.: Detection of subtle lung nodules: relative influence of quantum and anatomical noise on chest radiographs. Radiology 1999; 213: pp. 727-734.
5. Schartz K.M., Berbaum K.S., Caldwell R.T., Madsen M.T.: WorkstationJ: Workstation emulation software for medical image perception and technology evaluation research. Proceedings of the International Society for Optical Engineering 2007; 6515: 6515I1–6515I11
6. Berbaum K.S., Schartz K.M., Caldwell R.T., et. al.: Satisfaction of search from detection of pulmonary nodules in computed tomography of the chest. Acad Radiol 2013; 20: pp. 194-201. NIHMSID: NIHMS418413; PMID:23103184
7. Schartz K., Berbaum K., Madsen M., et. al.: Multiple diagnostic task performance in computed tomography examination of the chest. Br J Radiol 2013; 86: pp. 20110799. NIHMSID number: 389609
8. Jiang Y., Metz C.E., Nishikawa R.M.: A receiver operating characteristic partial area index for highly sensitive diagnostic tests. Radiology 1996; 201: pp. 745-750.
9. Dorfman D.D., Berbaum K.S.: A contaminated binormal model for ROC data - Part II. A formal model. Academic Radiology 2000; 7: pp. 427-437.
10. Dorfman D.D., Berbaum K.S., Metz C.E.: Receiver operating characteristic rating analysis: generalization to the population of readers and patients with the jackknife method. Invest Radiol 1992; 27: pp. 723-731.
11. Hillis S.L., Berbaum K.S., Metz C.E.: Recent developments in the Dorfman-Berbaum-Metz procedure for multireader ROC study analysis. Acad Radiol 2008; 15: pp. 647-661.
12. Franken E.A., Berbaum K.S., Lu C.H., et. al.: Satisfaction of search in detection of plain film abnormalities in abdominal contrast examinations. Invest Radiol 1994; 29: pp. 403-409.
13. Berbaum K.S., Franken E.A., Dorfman D.D., et. al.: The cause of satisfaction of search effects in contrast studies of the abdomen. Acad Radiol 1996; 3: pp. 815-826.
14. Berbaum K.S., Franken E.A., Dorfman D.D., et. al.: Can order of report prevent satisfaction of search in abdominal contrast studies?. Acad Radiol 2005; 12: pp. 74-84.
15. Swets J.A., Pickett R.M.: Evaluation of diagnostic systems: methods from signal detection theory.1982.Academic PressNew Yorkpp. 39.
16. 1993.by BMDP Statistical Software, Inc. Statistical Solutions Ltd.Cork, Ireland http://www.statsol.ie
17. Berbaum K.S., Franken E.A., Dorfman D.D., et. al.: Time course of satisfaction of search. Invest Radiol 1991; 26: pp. 640-648.