
Rationale and Objectives
The study aimed to perform a systematic review and meta-analysis for evaluating the diagnostic accuracy of 1.5 Tesla and 3.0 Tesla magnetic resonance imaging (MRI), and magnetic resonance arthrography (MRA), in the detection of scapholunate interosseous ligament (SLIL) injury.
Materials and Methods
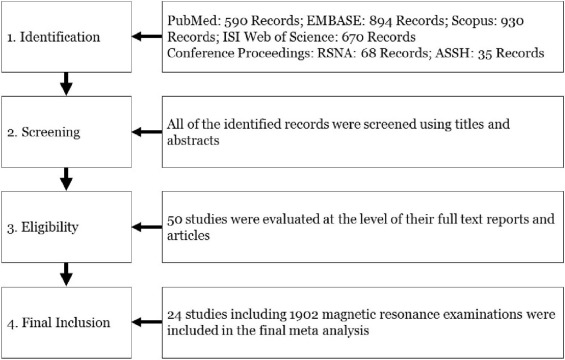
A literature search was performed (until July 2015) using the PubMed (MEDLINE), Embase, ISI Web of Science, Scopus, and conference proceedings. Original studies evaluating the diagnostic accuracy of MRI or MRA in the detection of SLIL injuries using arthroscopy or open surgery as the reference standard were included.
Results
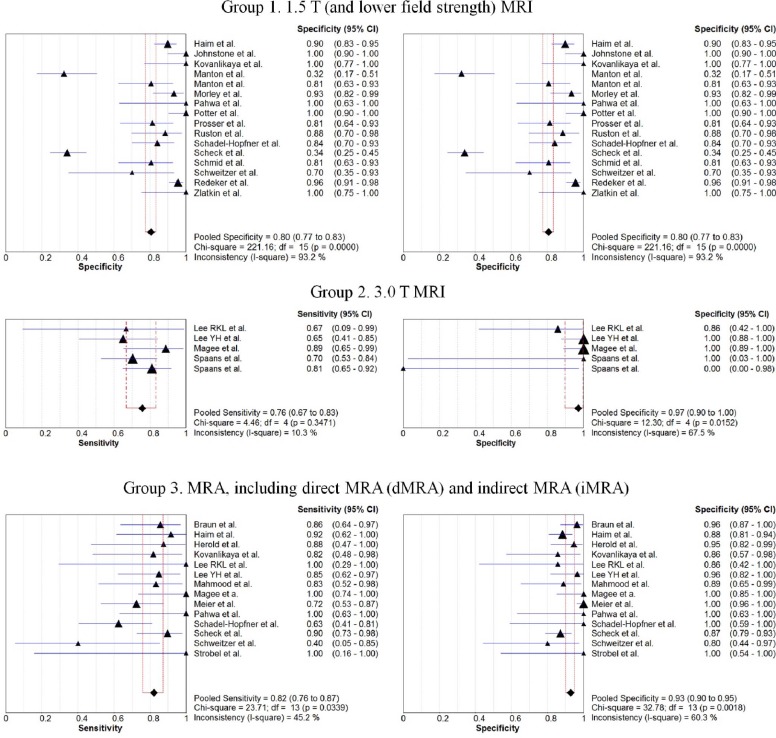
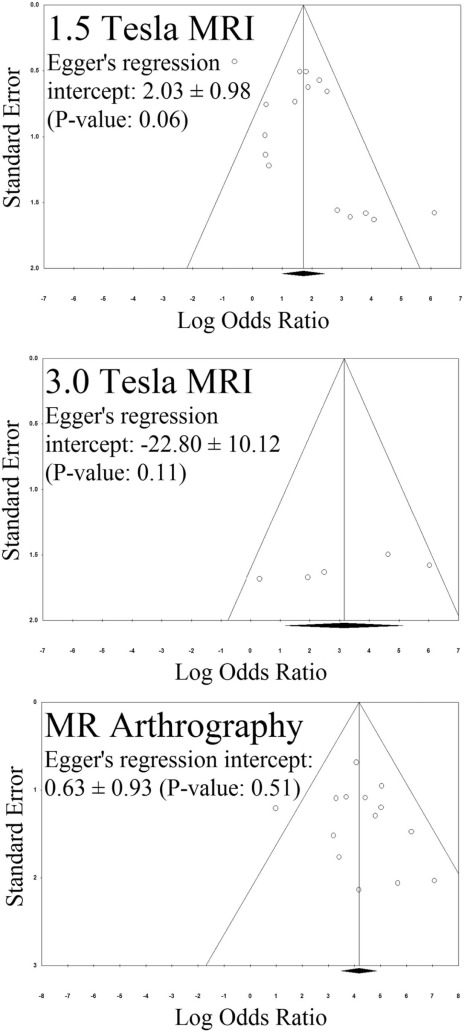
Of the initial 930 published records and 103 conference proceedings, 24 studies (1902 MRI examinations) were included (median SLIL injury prevalence: 33% [interquartile range: 25–42]). Heterogeneity was detected for 1.5 T MRI (chi-square: 47.93, P < 0.001) but not for 3.0 T MRI (chi-square: 8.00, P value: 0.09) and MRA (chi-square: 14.54, P value: 0.34) studies. The sensitivities of 1.5 T MRI, 3.0 T MRI, and MRA for detection of SLIL injury were 45.7% (95% confidence interval: 40.1–51.4), 75.7% (66.8–83.2), and 82.1% (76.1–87.2), respectively. The specificities of 1.5 T MRI, 3.0 T MRI, and MRA for detection of SLIL injury were 80.5% (77.3–83.4), 97.1% (89.8–99.6), and 92.8% (90.2–94.9), respectively. The diagnostic odds ratios of 1.5 T MRI, 3.0 T MRI, and MRA for detection of SLIL injury were 5.56 (2.71–11.39), 23.23 (3.16–171.00), and 65.04 (32.89–128.62) ( P value < 0.001), respectively. The results were consistent after addressing publication bias and sensitivity analyses.
Conclusions
MRA is superior to 3.0 T MRI, and 3.0 T MRI is superior to 1.5 T MRI in terms of diagnostic performance. 3.0 T MRI has the highest specificity for the detection of SLIL injuries.
Introduction
The scapholunate interosseous ligament (SLIL) is a small, intrinsic structure with an essential role in the stability of the proximal carpal row . The SLIL is a frequently injured interosseous ligament, and SLIL tear is the most common cause of chronic wrist ligamentous instability . Compromised function, chronic wrist pain, and ultimately secondary osteoarthritis are some of the most important complications of SLIL injury .
In some patients, diagnosis of wrist instability can be made using clinical examination and plain radiographs . However, noninvasive magnetic resonance imaging (MRI) or minimally invasive magnetic resonance arthrography (MRA) plays a major role in the detection of specific intrinsic ligaments’ injuries and decision-making for surgical management .
Get Radiology Tree app to read full this article<
Get Radiology Tree app to read full this article<
Methods
Literature Search
Get Radiology Tree app to read full this article<
Search Strategy
Get Radiology Tree app to read full this article<
Get Radiology Tree app to read full this article<
Study Selection—Eligibility
Get Radiology Tree app to read full this article<
Study Selection—Final Inclusion
Get Radiology Tree app to read full this article<
Data Collection
Get Radiology Tree app to read full this article<
Quality Assessment
Get Radiology Tree app to read full this article<
Statistical Analysis
Get Radiology Tree app to read full this article<
Get Radiology Tree app to read full this article<
Get Radiology Tree app to read full this article<
Results
Study Selection
Get Radiology Tree app to read full this article<
Get Radiology Tree app to read full this article<
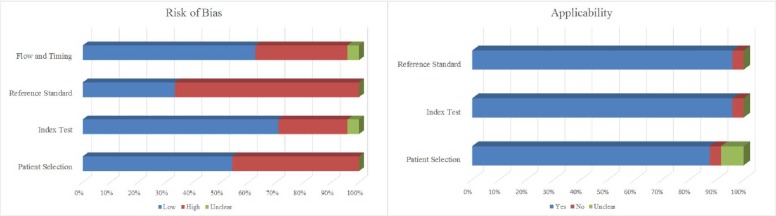
Study Characteristics and Risk of Bias
Get Radiology Tree app to read full this article<
Table 1
Summary of the Included Studies Evaluating the Diagnostic Accuracy of 1.5 T (and Lower Field Strength), 3.0 T, and MRA in Detecting SLIL Injury
Study Publication Year Study Years Modality Number Prospective Versus Retrospective Reference Standard Blinded Age, Mean (Range) Gender (F:M) Country Institution (Department) 1 Zlatkin et al. 1989 N/A 1.5 T (GE) 20 Retrospective Arthroscopy and open surgery Yes N/A N/A United States University of Pennsylvania (R) 2 Schweitzer et al. 1992 N/A 1.5 T MRA (GE) 15, 14 Retrospective Arthroscopy Yes N/A N/A United States University of California, San Diego (R) 3 Johnstone et al. 1997 N/A 0.5 T (GE) 43 Prospective Arthroscopy—in 3 months N/A 30 (14–62) 26:17 United Kingdom Royal Cornwall Hospitals (O) 4 Kovanlikaya et al. 1997 N/A 1.0 T MRA (Siemens) 25 Prospective Arthroscopy and open surgery Yes (18–55) 16:9 Turkey Dokuz Eylul University (R) 5 Potter et al. 1997 1993–1996 1.5 T (GE) 53 Prospective Arthroscopy—in average 7 weeks Yes 36 (13–70) 25:52 United States Hospital for Special Surgery (R) 6 Scheck et al. 1997 1994–1996 1.5 T dMRA (Siemens) 41 Prospective Arthroscopy N/A 34 18:23 Germany Ludwig-Maximilian-University (R) 7 Herold et al. 2001 N/A iMRA (Siemens) 45 Prospective Arthroscopy—6 weeks N/A 32 (16–77) 23:22 Germany University of Regensburg (R) 8 Manton et al. 2001 N/A 1.5 T (GE) 50 Retrospective Arthroscopy—in 3 months Yes 40 (20–62) 23:27 United States Thomas Jefferson University (R) 9 Morley et al. 2001 1996–1999 1.5 T (Siemens) 54 Prospective Arthroscopy Yes 31 (15–63) 29:25 United Kingdom Southern General Hospital (O) 10 Schadel-Hopfner et al. 2001 1996–1998 1.0 T iMRA (Siemens) 72, 31 Prospective Arthroscopy—in 48 hours N/A 38 (14–76) 48:55 Germany University Hospital, Marburg (T) 11 Meier et al. 2002 2000 dMRA (Siemens) 125 Prospective Arthroscopy—in 24 hours Yes 37 (±12) 45:80 Germany Klinik für Handchirurgie, Bad Neustadt an der Saale (H) 12 Braun et al. 2003 N/A dMRA 75 Retrospective Arthroscopy Yes 38 25:50 Germany Universität Würzburg (R) 13 Haim et al. 2003 6 years iMRA 1.5 T (GE) 41 Retrospective Arthroscopy—in 10 months Yes 37 (7–57) 20:21 United States Yale University (R) 45 39 (12–62) 19:26 14 Schmid et al. 2005 2003 1.5 T (GE) 9 Cadaver study Open surgery or gross pathology Yes 83 (65–99) 4:4 Switzerland Balgrist University Hospital (R) 15 Magee et al. 2009 2007 3.0 T dMRA (GE) 49, 35 Retrospective Arthroscopy—in 75 days Yes 32 (14–58) 18:31 United States Neuroskeletal Imaging Institutem, FL (R) 16 Redeker et al. 2009 1998–2002 1.5 T and lower 217 Retrospective Arthroscopy N/A 36 (13–63) 105:112 Germany Medizinische Hochschule Hannover (P) 17 Prosser et al. 2011 2005–2009 N/A (low res) 55 Prospective Arthroscopy—in 3 weeks Yes N/A N/A Australia Sydney Hand Therapy and Rehabilitation Centre 18 Mahmood et al. 2012 2006–2009 dMRA (Philips) 30 Retrospective Arthroscopy—in 7 months N/A 42 (20–70) 20:10 United Kingdom Macclesfield District General Hospital 19 Lee RKL et al. 2013 2012 3.0 T dMRA (Philips) 10 Cadaver study Arthroscopy—in 1 week Yes 50 (26–59) 0:10 Hong Kong The Chinese University of Hong Kong (R) 20 Lee YH et al. 2013 2009–2010 dMRA 3.0 T (Philips) 48 Retrospective Arthroscopy—in 30 days Yes 34 (14–58) 20:28 South Korea Yonsei University (R) 21 Ruston et al. 2013 N/A N/A (low res) 38 Retrospective Arthroscopy N/A 35 (10–68) N/A United Kingdom University College London Hospital 22 Spaans et al. 2013 2006–2010 3.0 T (Philips) 38 Retrospective Open surgery Yes N/A N/A The Netherlands Universital Medical Center, Utrecht (P) 23 Pahwa et al. 2014 2007–2009 1.5 T dMRA (Siemens) 16 Prospective Arthroscopy—in 3 weeks Yes 29 (18–60) 18:35 India All India Institute of Medical Sciences (O) 24 Strobel et al. 2014 2011–2012 dMRA (Philips) 8 Prospective Open surgery Yes 43 (22–66) N/A Switzerland Lucerne Cantonal Hospital (R)
dMRA, direct MRA; GE, General Electric; iMRA, indirect MRA; MRA, magnetic resonance arthrography; N/A, not available; SLIL, scapholunate interosseous ligament.
Department of the first author is indicated as: H, hand surgery; O, orthopedic surgery; P, plastic and reconstruction surgery; R, radiology; T, traumatology.
Get Radiology Tree app to read full this article<
Synthesis of Results
Get Radiology Tree app to read full this article<
Table 2
Summary of the Examinations Evaluating the Diagnostic Accuracy of 1.5 T (and Lower Field Strength), 3.0 T, and MRA in Detecting SLIL Injury
Study MRI Reader True Positives True Negatives False Positives False Negatives Prevalence (%) Sensitivity (%) Specificity (%) 1.5 Tesla (and lower) MRI 1 Haim et al. 1.5 T 1, 2, and 3 11 97 11 16 20 41 90 2 Johnstone et al. 0.5 T 1 3 35 0 5 19 37 100 3 Kovanlikaya et al. 1.0 T 1 4 14 0 7 44 36 100 4 Manton et al. 1.5 T 1 10 11 23 3 28 77 32 5 Manton et al. 1.5 T 2 6 25 6 6 28 50 81 6 Morley et al. 1.5 T 1 1 42 3 8 17 11 93 7 Pahwa et al. 1.5 T 1, 2, and 3 5 8 0 3 50 62 100 8 Potter et al. 1.5 T 1 15 36 0 2 32 88 100 9 Prosser et al. 1.5 T or lower 1 17 26 6 6 42 74 81 10 Ruston et al. 1.5 T or lower 1 2 23 3 10 32 17 88 11 Schadel-Hopfner et al. 1.0 T 1, 2, and 3 18 37 7 10 39 64 84 12 Scheck et al. 1.5 T 1 and 2 15 32 62 14 24 52 34 13 Schmid et al. 1.5 T 1 and 2 14 25 6 9 43 61 81 14 Schweitzer et al. 1.5 T 1 and 2 2 7 3 3 33 40 70 15 Redeker et al. 1.5 T or lower 1 15 130 6 66 37 19 96 16 Zlatkin et al. 1.5 T N/A 5 13 0 2 35 71 100 3.0 Tesla MRI 1 Lee RKL et al. 3.0 T 1 and 2 2 6 1 1 30 66 86 2 Lee YH et al. 3.0 T 1 13 28 0 7 42 65 100 3 Magee et al. 3.0 T 1 and 2 16 31 0 2 37 89 100 4 Spaans et al. 3.0 T 1 26 1 0 11 97 70 100 5 Spaans et al. 3.0 T 2 30 0 1 7 97 81 0 MRA 1 Braun et al. dMRA 1 and 2 18 52 2 3 28 86 96 2 Haim et al. iMRA 1, 2, and 3 11 98 13 1 10 92 88 3 Herold et al. iMRA N/A 7 35 2 1 18 87 95 4 Kovanlikaya et al. dMRA 1 9 12 2 2 44 82 86 5 Lee RKL et al. dMRA 1 and 2 3 6 1 0 30 100 86 6 Lee YH et al. dMRA 1 17 27 1 3 42 85 96 7 Mahmood et al. dMRA 1 10 16 2 2 40 83 89 8 Magee et a. dMRA 1 and 2 12 23 0 0 34 100 100 9 Meier et al. dMRA 1 21 96 0 8 23 72 100 10 Pahwa et al. dMRA 1, 2, and 3 8 8 0 0 50 100 100 11 Schadel-Hopfner et al. iMRA 1, 2, and 3 15 7 0 9 77 62 100 12 Scheck et al. dMRA 1 and 2 26 82 12 3 24 90 87 13 Schweitzer et al. dMRA 1 and 2 2 8 2 3 33 40 80 14 Strobel et al. dMRA 1 2 6 0 0 25 100 100
dMRA, direct MRA; iMRA, indirect MRA; MRA, magnetic resonance arthrography; MRI, magnetic resonance imaging; N/A, not available; SLIL, scapholunate interosseous ligament.
Get Radiology Tree app to read full this article<
Get Radiology Tree app to read full this article<
Table 3
Summary of the Pooled Statistics Evaluating the Diagnostic Accuracy of 1.5 T (and Lower Field Strength), 3.0 T, and MRA in Detecting SLIL Injury
1.5 T (or Lower Field Strength) 3.0 T dMRA and iMRA Pooled estimates Sensitivity (%) 45.7(40.1–51.4) 75.7(66.8–83.2) 82.1(76.1–87.2) Specificity (%) 80.5(77.3–83.4) 97.1(89.8–99.6) 92.8(90.2–94.9) Summary: Random effect (DerSimonian–Laird) Positive likelihood ratio 3.07(1.79–5.26) 6.84(0.65–72.16) 9.19(5.96–14.19) Negative likelihood ratio 0.65(0.52–0.87) 0.33(0.22–0.51) 0.21(0.14–0.34) Diagnostic odds ratio 5.56(2.71–11.39) 23.23(3.16–171.00) 65.04(32.89–128.62) \* I-square 68.7% † 50.0% 10.6% Heterogeneity chi-square ( P value) 47.93( P < 0.001) 8.00( P :0.092) 14.54( P :0.337) Publication bias: trim and fill Diagnostic odds ratio adjusted for publication bias 3.93(1.88–8.20) 23.28(3.22–168.15) 49.97(24.57–101.62)
dMRA, direct MRA; iMRA, indirect MRA; MRA, magnetic resonance arthrography; MRI, magnetic resonance imaging; SLIL, scapholunate interosseous ligament.
Diagnostic odds ratio (DOR) is a measure of test performance that is independent of the prevalence(unlike the accuracy).
Get Radiology Tree app to read full this article<
Get Radiology Tree app to read full this article<
Get Radiology Tree app to read full this article<
Risk of Publication Bias
Get Radiology Tree app to read full this article<
Get Radiology Tree app to read full this article<
Sensitivity Analysis
Get Radiology Tree app to read full this article<
Table 4
Sensitivity Analysis: Estimating the Diagnostic Odds Ratios with the Exclusion of Specific Subgroups
Including Studies with: 1.5 T (or Lower Field Strength) 3.0 T MRA Relative DOR More than 10 examinations 5.56 23.23 65.43 4.15 (2.71–11.39) (3.16–171.00) (31.73–134.91) (2.45–7.05)P value < 0.001 Single readings \* 6.29 46.41 65.04 4.12 (2.74–14.42) (7.23–298.01) (32.89–128.62) (2.27–7.47)P value < 0.001 Human samples (excluding cadaver studies) 5.58 26.84 67.41 4.27 (2.56–12.15) (2.17–332.43) (32.71–138.92) (2.44–7.47)P value < 0.001 Blinding 6.87 23.23 75.64 3.55 (3.29–14.38) (3.16–171.00) (26.42–216.58) (1.93–6.55)P value < 0.001 Information on age/gender 5.64 83.31 82.64 5.19 (2.43–13.08) (11.53–601.80) (42.65–160.14) (3.11–8.68)P value < 0.001 1.5 T versus 3.0 T versus MRA (excluding lower field strength MRIs) 4.79 23.23 65.04 4.45 (1.70–13.50) (3.16–171.00) (32.89–128.62) (2.62–7.55)P value < 0.001 1.5 T versus 3.0 T versus indirect MRA 5.56 23.23 65.43 4.14 (2.71–11.39) (3.16–171.00) (27.29–156.87) (2.32–7.39)P value < 0.001 1.5 T versus 3.0 T versus direct MRA 5.56 23.23 70.84 4.54 (2.71–11.39) (3.16–171.00) (16.97–295.69) (1.82–11.37)P value < 0.001
DOR, diagnostic odds ratio; MRA, magnetic resonance arthrography; MRI, magnetic resonance imaging.
Get Radiology Tree app to read full this article<
Get Radiology Tree app to read full this article<
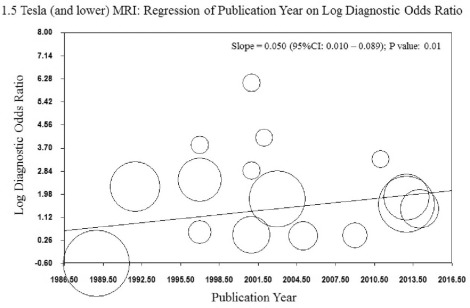
Heterogeneity and Meta-regression
Get Radiology Tree app to read full this article<
Get Radiology Tree app to read full this article<
Discussion
Get Radiology Tree app to read full this article<
Get Radiology Tree app to read full this article<
Get Radiology Tree app to read full this article<
Get Radiology Tree app to read full this article<
Get Radiology Tree app to read full this article<
Get Radiology Tree app to read full this article<
Conclusions
Get Radiology Tree app to read full this article<
Supplementary Data
Get Radiology Tree app to read full this article<
Appendix S1
Get Radiology Tree app to read full this article<
Get Radiology Tree app to read full this article<
Get Radiology Tree app to read full this article<
Figure S1
Get Radiology Tree app to read full this article<
Get Radiology Tree app to read full this article<
Get Radiology Tree app to read full this article<
References
1. Pappou I.P., Basel J., Deal D.N.: Scapholunate ligament injuries: a review of current concepts. Hand 2013; 8: pp. 146-156.
2. Kitay A., Wolfe S.W.: Scapholunate instability: current concepts in diagnosis and management. J Hand Surg Am 2012; 37: pp. 2175-2196.
3. Zanetti M., Saupe N., Nagy L.: Role of MR imaging in chronic wrist pain. Eur Radiol 2007; 17: pp. 927-938.
4. Andersson J.K., Andernord D., Karlsson J., et. al.: Efficacy of magnetic resonance imaging and clinical tests in diagnostics of wrist ligament injuries: a systematic review. Arthroscopy 2015; 31: pp. 2014-2020. e2
5. Ahsan Z.S., Yao J.: Complications of wrist arthroscopy. Arthroscopy 2012; 28: pp. 855-859.
6. Liberati A., Altman D.G., Tetzlaff J., et. al.: The PRISMA statement for reporting systematic reviews and meta-analyses of studies that evaluate health care interventions: explanation and elaboration. Ann Intern Med 2009; 151: pp. W65-W94.
7. Whiting P.F., Rutjes A.W., Westwood M.E., et. al.: QUADAS-2: a revised tool for the quality assessment of diagnostic accuracy studies. Ann Intern Med 2011; 155: pp. 529-536.
8. Borenstein M., Hedges L.V., Higgins J.P., et. al.: A basic introduction to fixed-effect and random-effects models for meta-analysis. Res Synth Methods 2010; 1: pp. 97-111.
9. Duval S., Tweedie R.: Trim and fill: a simple funnel-plot-based method of testing and adjusting for publication bias in meta-analysis. Biometrics 2000; 56: pp. 455-463.
10. Zamora J., Abraira V., Muriel A., et. al.: Meta-DiSc: a software for meta-analysis of test accuracy data. BMC Med Res Methodol 2006; 6: pp. 31.
11. Herold T., Lenhart M., Held P., et. al.: [Indirect MR arthrography of the wrist in the diagnosis of TFCC-lesions]. Rofo 2001; 173: pp. 1006-1011.
12. Braun H., Kenn W., Schneider S., et. al.: [Direct MR arthrography of the wrist-value in detecting complete and partial defects of intrinsic ligaments and the TFCC in comparison with arthroscopy]. Rofo 2003; 175: pp. 1515-1524.
13. Haims A.H., Schweitzer M.E., Morrison W.B., et. al.: Internal derangement of the wrist: indirect MR arthrography versus unenhanced MR imaging. Radiology 2003; 227: pp. 701-707.
14. Johnstone D.J., Thorogood S., Smith W.H., et. al.: A comparison of magnetic resonance imaging and arthroscopy in the investigation of chronic wrist pain. J Hand Surg Am 1997; 22: pp. 714-718.
15. Kovanlikaya I., Camli D., Cakmakci H., et. al.: Diagnostic value of MR arthrography in detection of intrinsic carpal ligament lesions: use of cine-MR arthrography as a new approach. Eur Radiol 1997; 7: pp. 1441-1445.
16. Lee R.K., Ng A.W., Tong C.S., et. al.: Intrinsic ligament and triangular fibrocartilage complex tears of the wrist: comparison of MDCT arthrography, conventional 3-T MRI, and MR arthrography. Skeletal Radiol 2013; 42: pp. 1277-1285.
17. Lee Y.H., Choi Y.R., Kim S., et. al.: Intrinsic ligament and triangular fibrocartilage complex (TFCC) tears of the wrist: comparison of isovolumetric 3D-THRIVE sequence MR arthrography and conventional MR image at 3 T. Magn Reson Imaging 2013; 31: pp. 221-226.
18. Magee T.: Comparison of 3-T MRI and arthroscopy of intrinsic wrist ligament and TFCC tears. AJR Am J Roentgenol 2009; 192: pp. 80-85.
19. Mahmood A., Fountain J., Vasireddy N., et. al.: Wrist MRI arthrogram v wrist arthroscopy: what are we finding?. Open Orthop J 2012; 6: pp. 194-198.
20. Manton G.L., Schweitzer M.E., Weishaupt D., et. al.: Partial interosseous ligament tears of the wrist: difficulty in utilizing either primary or secondary MRI signs. J Comput Assist Tomogr 2001; 25: pp. 671-676.
21. Meier R., Schmitt R., Christopoulos G., et. al.: [Scapholunate ligament tears in MR arthrography compared with wrist arthroscopy]. Handchir Mikrochir Plast Chir 2002; 34: pp. 381-385.
22. Morley J., Bidwell J., Bransby-Zachary M.: A comparison of the findings of wrist arthroscopy and magnetic resonance imaging in the investigation of wrist pain. J Hand Surg Am 2001; 26: pp. 544-546.
23. Pahwa S., Srivastava D.N., Sharma R., et. al.: Comparison of conventional MRI and MR arthrography in the evaluation wrist ligament tears: a preliminary experience. Indian J Radiol Imaging 2014; 24: pp. 259-267.
24. Potter H.G., Asnis-Ernberg L., Weiland A.J., et. al.: The utility of high-resolution magnetic resonance imaging in the evaluation of the triangular fibrocartilage complex of the wrist. J Bone Joint Surg Am 1997; 79: pp. 1675-1684.
25. Prosser R., Harvey L., Lastayo P., et. al.: Provocative wrist tests and MRI are of limited diagnostic value for suspected wrist ligament injuries: a cross-sectional study. J Physiother 2011; 57: pp. 247-253.
26. Redeker J., Meyer-Marcotty M., Urbanek F., et. al.: [Diagnostic value of unspecific requested and implemented MRI for detecting intracarpal lesions, compared to arthroscopic findings at 217 patients]. Handchir Mikrochir Plast Chir 2009; 41: pp. 129-134.
27. Ruston J., Konan S., Rubinraut E., et. al.: Diagnostic accuracy of clinical examination and magnetic resonance imaging for common articular wrist pathology. Acta Orthop Belg 2013; 79: pp. 375-380.
28. Schadel-Hopfner M., Iwinska-Zelder J., Braus T., et. al.: MRI versus arthroscopy in the diagnosis of scapholunate ligament injury. J Hand Surg Am 2001; 26: pp. 17-21.
29. Scheck R.J., Kubitzek C., Hierner R., et. al.: The scapholunate interosseous ligament in MR arthrography of the wrist: correlation with non-enhanced MRI and wrist arthroscopy. Skeletal Radiol 1997; 26: pp. 263-271.
30. Schmid M.R., Schertler T., Pfirrmann C.W., et. al.: Interosseous ligament tears of the wrist: comparison of multi-detector row CT arthrography and MR imaging. Radiology 2005; 237: pp. 1008-1013.
31. Schweitzer M.E., Brahme S.K., Hodler J., et. al.: Chronic wrist pain: spin-echo and short tau inversion recovery MR imaging and conventional and MR arthrography. Radiology 1992; 182: pp. 205-211.
32. Spaans A.J., Minnen P., Prins H.J., et. al.: The value of 3.0-Tesla MRI in diagnosing scapholunate ligament injury. J Wrist Surg 2013; 2: pp. 69-72.
33. Strobel K., Steurer-Dober I., Da Silva A.J., et. al.: Feasibility and preliminary results of SPECT/CT arthrography of the wrist in comparison with MR arthrography in patients with suspected ulnocarpal impaction. Eur J Nucl Med Mol Imaging 2014; 41: pp. 548-555.
34. Zlatkin M.B., Chao P.C., Osterman A.L., et. al.: Chronic wrist pain: evaluation with high-resolution MR imaging. Radiology 1989; 173: pp. 723-729.
35. Demehri S., Hafezi-Nejad N., Thakur U., et. al.: Evaluation of pisotriquetral motion pattern using four-dimensional CT: initial clinical experience in asymptomatic wrists. Clin Radiol 2015; 70: pp. 1362-1369.