
Rationale and Objectives
Accurate assessment of air density used to quantitatively characterize amount and distribution of emphysema in chronic obstructive pulmonary disease (COPD) subjects has remained challenging. Hounsfield units (HU) within tracheal air can be considerably less negative than –1000 HU. This study has sought to characterize the effects of improved scatter correction used in dual-source pulmonary computed tomography (CT).
Materials and Methods
Dual-source dual-energy (DSDE) and single-source (SS) scans taken at multiple energy levels and scan settings were acquired for quantitative comparison using anesthetized ovine ( n = 6), swine ( n = 13), and a lung phantom. Data were evaluated for the lung, inferior vena cava, and tracheal segments. To minimize the effect of cross-scatter, the phantom scans in the DSDE mode were obtained by reducing the current of one of the tubes to near zero.
Results
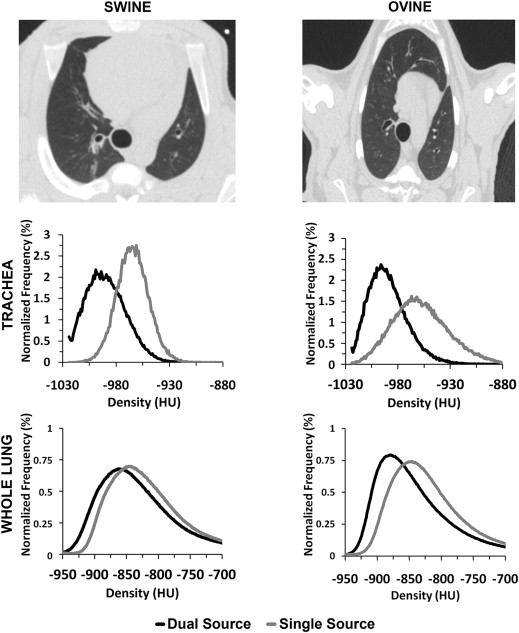
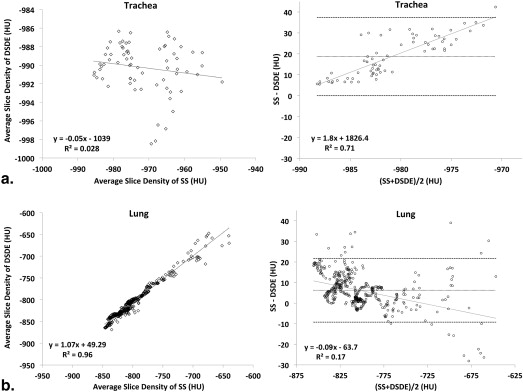
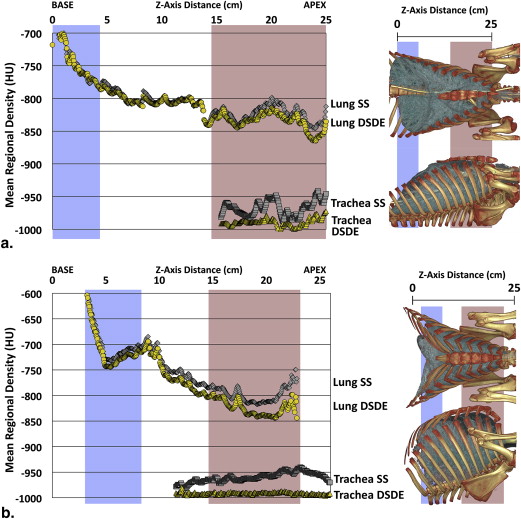
A significant shift in mean HU values in the tracheal regions of animals and the phantom is observed, with values consistently closer to −1000 HU in DSDE mode. HU values associated with SS mode demonstrated a positive shift of up to 32 HU. In vivo tracheal air measurements demonstrated considerable variability with SS scanning, whereas these values were more consistent with DSDE imaging. Scatter effects in the lung parenchyma differed from adjacent tracheal measures.
Conclusion
Data suggest that the scatter correction introduced into the dual-energy mode of imaging has served to provide more accurate CT lung density measures sought to quantitatively assess the presence and distribution of emphysema in COPD subjects. Data further suggest that CT images, acquired without adequate scatter correction, cannot be corrected by linear algorithms given the variability in tracheal air HU values and the independent scatter effects on lung parenchyma.
Quantitative computed tomographic (QCT) imaging is increasingly used for the characterization of the lung . Yet, reliable, repeatable, and accurate quantification of volumetric computed tomography (CT) data for assessment of lung density, particularly for longitudinal and multicenter studies, remains a challenge. It has been observed that air in the trachea of a chest CT scan is often significantly different from its true value of −1000 Hounsfield units (HU), and this varies between scanner makes and models . The variability of intrathoracic air HU measurements across sites, scanner makes, and models limits the accuracy when measuring air trappings and the extent of emphysema-like lung parenchyma, which has been defined as the percentage of voxels below −950 HU within the lung field on volumetric CT scans or the HU value below which 15% of lung voxels fall . The variability in intrathoracic air values makes comparisons between CT scanner makes and models challenging.
The motivation for this study was our preliminary observations in animal experiments that air in the trachea was consistently closer to −1000 HU when using Siemens SOMATOM Definition Flash dual-source dual-energy (DSDE) scan mode compared to the same scanner’s single-source (SS) scan mode. The primary difference between the DSDE and SS modes is the implementation of a dedicated hardware-based scatter correction in the DSDE mode, whereas the SS mode simply uses an antiscatter grid that is expected to block all scattered radiation. Therefore, the goal of this study was to test the hypothesis that the scatter correction employed in the DSDE mode results in more accurate (closer to the nominal −1000 HU) CT numbers of air in the trachea compared to the antiscatter grid solution typical for conventional single-source CT.
Materials and methods
Get Radiology Tree app to read full this article<
Get Radiology Tree app to read full this article<
Study Outline
Get Radiology Tree app to read full this article<
Get Radiology Tree app to read full this article<
Get Radiology Tree app to read full this article<
Animal models
Get Radiology Tree app to read full this article<
Get Radiology Tree app to read full this article<
Get Radiology Tree app to read full this article<
Get Radiology Tree app to read full this article<
Analysis
Get Radiology Tree app to read full this article<
Phantom protocol
Get Radiology Tree app to read full this article<
Get Radiology Tree app to read full this article<
Get Radiology Tree app to read full this article<
Analysis
Get Radiology Tree app to read full this article<
Get Radiology Tree app to read full this article<
Results
Animal Study
Get Radiology Tree app to read full this article<
Table 1
Six Ovine and 13 Swine Scanned in SS and DSDE Modes with Lungs Inflated at 5, 15, 20, or 25 cm H 2 O Airway Pressure
Swine Ovine SS DSDE SS DSDE Trachea Mean −949 −981 −954 −986 Difference ± SD 32 ± 6 32 ± 7t -test_P_ < .001 ( n = 18)P < .001 ( n = 12) Lung Mean −709 −733 −773 −794 Difference ± SD 24 ± 15 19 ± 5t -test_P_ < .001 ( n = 18)P < .001 ( n = 12) IVC Mean 24 39 23 37 Difference ± SD −15 ± 1.6 −14 ± 1.5t -test_P_ < .001 ( n = 18)P < .001 ( n = 12)
DSDE, dual-source dual-energy; HU, Hounsfield unit; IVC, inferior vena cava; SD, standard deviation; SS, single source.
The tracheal lumen, inferior vena cava, and lung parenchyma were segmented for determination of the respective mean HU and standard deviations. Two-tailed paired-difference t -tests were used to determine the P values for the SS versus DSDE comparisons across subjects. Shown are the HU values from the animal models from 80-kVp scans, with all scanning parameters matched except for scanning mode. A significant shift in HU is seen when comparing the trachea, IVC, and lung tissue in the paired SS versus DSDE scans for both swine and ovine.
Get Radiology Tree app to read full this article<
Get Radiology Tree app to read full this article<
Get Radiology Tree app to read full this article<
Get Radiology Tree app to read full this article<
Phantom Study
Get Radiology Tree app to read full this article<
Get Radiology Tree app to read full this article<
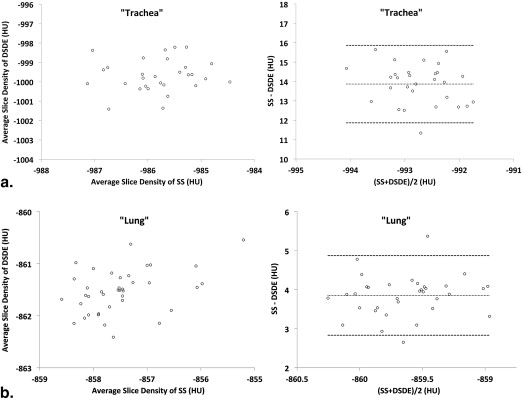
Table 2
Variant of the COPDGene Phantom with “Trachea”- and “Lung”-Like Regions and Air, Water, and Acrylic Regions
80 kVp 140 kVp SS DSDE SS DSDE “Trachea” Mean −987 −1003 −987 −1004 |Difference| ± SD 16 ± 2 17 ± 2t -test_P_ < .001 ( n = 10)P < .001 ( n = 10) Air Mean −999 −1002 −998 −1004 |Difference| ± SD 3 ± 4 6 ± 2t -test_P_ < .05 ( n = 10)P < .001 ( n = 10) “Lung” Mean −858 −860 −856 −863 |Difference| ± SD 2 ± 5 7 ± 3t -test_P_ = .1701 ( n = 10)P < .001 ( n = 10) Water Mean −2 2 −2 2 |Difference| ± SD 4 ± 8 4 ± 6t -test_P_ = .1816 ( n = 10)P = .0972 ( n = 10) Acrylic Mean 94 111 125 154 |Difference| ± SD 17 ± 15 29 ± 8t -test_P_ < .01 ( n = 10)P < .001 ( n = 10)
DSDE, dual-source dual-energy; SD, standard deviation; SS, single source.
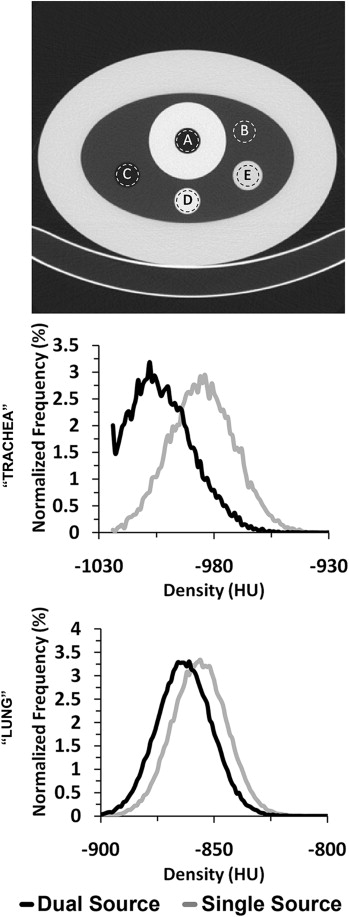
The resultant mean values of the 80 and 140 kVp scans are listed for each region, in addition to the difference in values between the two modes and the level of significance using a two-tailed paired difference test ( Fig 2 , top panel). The results from the 100 kVp showed similar HU shifts between SS and DSDE scans. Reference computed tomography number for internal “trachea” air is −1000 HU, internal air is −1000 HU, “lung” is −860 HU, water is 0 HU, and acrylic is 120 HU.
Get Radiology Tree app to read full this article<
Get Radiology Tree app to read full this article<
Table 3
The “Trachea”-Like Region of a Variant of the COPDGene Phantom Scanned in SS Mode (80, 100, 120, and 140 kVp), DSDE Mode (80/140Sn kVp, 140/80 kVp, and 100/140Sn kVp), and DSDE-SS Mode (i.e., Same Combinations as in the DSDE Mode but with Tube A or B Set at Minimum mAs)
Phantom “Trachea” Values Scan Mode Mean Channels Pitch Rotation Time Kernel Tube Sn filtered 80 kVp SS −987 128 0.55 0.5 B35f A — DSDE-SS −1002 64 0.55 0.5 B35f A — DSDE-SS −1002 128 0.55 0.5 B35f A — DSDE −1002 128 0.55 0.5 B35f A — DSDE −1002 128 1.0 0.5 B35f A — DSDE −1001 128 0.55 0.33 B35f A — DSDE −1003 128 0.55 0.5 D30f A — DSDE-SS −1003 64 0.55 0.5 B35f B — DSDE-SS −1004 128 0.55 0.5 B35f B — DSDE −1003 128 0.55 0.5 B35f B — DSDE −1002 128 1.0 0.5 B35f B — DSDE −1003 128 0.55 0.33 B35f B — DSDE −1002 128 0.55 0.5 D30f B — 100 kVp SS −988 128 0.55 0.5 B35f A — DSDE-SS −1004 64 0.55 0.5 B35f A — DSDE-SS −1007 128 0.55 0.5 B35f A — DSDE −1002 128 0.55 0.5 B35f A — 120 kVp SS −985 128 0.55 0.5 B35f A — 140 kVp SS −987 128 0.55 0.5 B35f A — DSDE-SS −1002 64 0.55 0.5 B35f A — DSDE-SS −1007 128 0.55 0.5 B35f A — DSDE −1002 128 0.55 0.5 B35f A — DSDE-SS −1000 64 0.55 0.5 B35f B Yes DSDE-SS −1001 128 0.55 0.5 B35f B Yes DSDE −1003 128 0.55 0.5 B35f B Yes
DSDE, dual-source dual-energy; SD, standard deviation; Sn, tin; SS, single source.
A consistent CTDIvol of 12 (±0.1) mGy was used for each. The results here show the mean Hounsfield units (HU) for a sampling of the analyzed parameter changes. Additional controlled scans comparing slice thickness (0.6 or 0.75 mm), slice spacing (0.5 or 0.6 mm), and scan direction (craniocaudal or caudocranial) were also analyzed but not shown any meaningful difference in mean values compared to the control. Reference computed tomography number for internal “trachea” air is −1000 HU.
Get Radiology Tree app to read full this article<
Get Radiology Tree app to read full this article<
Get Radiology Tree app to read full this article<
Discussion
Get Radiology Tree app to read full this article<
Get Radiology Tree app to read full this article<
Get Radiology Tree app to read full this article<
Get Radiology Tree app to read full this article<
Get Radiology Tree app to read full this article<
Get Radiology Tree app to read full this article<
Get Radiology Tree app to read full this article<
Acknowledgments
Get Radiology Tree app to read full this article<
References
1. Matsuoka S., Yamashiro T., Washko G.R., et. al.: Quantitative CT assessment of chronic obstructive pulmonary disease. Radiographics 2010; 30: pp. 55-66.
2. Lynch D.A.: Quantitative CT of fibrotic interstitial lung disease. Chest 2007; 131: pp. 643-644.
3. Park E.A., Goo J.M., Park S.J., et. al.: Chronic obstructive pulmonary disease: quantitative and visual ventilation pattern analysis at xenon ventilation CT performed by using a dual-energy technique. Radiology 2010; 256: pp. 985-997.
4. Lynch D.A., Newell J.D.: Quantitative imaging of COPD. J Thorac Imaging 2009; 24: pp. 189-194.
5. Team N.L.S.T.R., Aberle D.R., Berg C.D., et. al.: The National Lung Screening Trial: overview and study design. Radiology 2011; 258: pp. 243-253.
6. Kim W.J., Hoffman E.A., Reilly J., et. al.: Association of COPD candidate genes with computed tomography emphysema and airway phenotypes in severe COPD. Eur Resp J 2011; 37: pp. 39-43.
7. Washko G.R., Lynch D.A., Matsuoka S., et. al.: Identification of early interstitial lung disease in smokers from the COPDGene Study. Acad Radiol 2010; 17: pp. 48-53.
8. Bakker M.E., Stolk J., Putter H., et. al.: Variability in densitometric assessment of pulmonary emphysema with computed tomography. Invest Radiol 2005; 40: pp. 777-783.
9. Bankier A.A., De Maertelaer V., Keyzer C., et. al.: Pulmonary emphysema: subjective visual grading versus objective quantification with macroscopic morphometry and thin-section CT densitometry. Radiology 1999; 211: pp. 851-858.
10. Gurney J.W., Jones K.K., Robbins R.A., et. al.: Regional distribution of emphysema: correlation of high-resolution CT with pulmonary function tests in unselected smokers. Radiology 1992; 183: pp. 457-463.
11. Lucidarme O., Coche E., Cluzel P., et. al.: Expiratory CT scans for chronic airway disease: correlation with pulmonary function test results. AJR Am J Roentgenol 1998; 170: pp. 301-307.
12. Knudson R.J., Standen J.R., Kaltenborn W.T., et. al.: Expiratory computed tomography for assessment of suspected pulmonary emphysema. Chest 1991; 99: pp. 1357-1366.
13. Brown M., Abtin F., Kim H.J., et. al.: Imaging biomarkers for patient selection and treatment planning in emphysema. Imaging Med 2010; 2: pp. 565-573.
14. Buckler AJ, Mozley PD, Schwartz L, et al. Volumetric CT in lung cancer: an example for the qualification of imaging as a biomarker. 2010; 17:107-115
15. Bafadhel M., Umar I., Gupta S., et. al.: The role of CT scanning in multidimensional phenotyping of COPD. Chest 2011; 140: pp. 634-642.
16. Goldin J.G.: Imaging the lungs in patients with pulmonary emphysema. J Thorac Imaging 2009; 24: pp. 163-170.
17. Newell J.D.: Quantitative computed tomography of lung parenchyma in chronic obstructive pulmonary disease: an overview. Proc Am Thorac Soc 2008; 5: pp. 915-918.
18. Coxson H.O., Rogers Robert M.: Quantitative computed tomography of chronic obstructive pulmonary disease. Acad Radiol 2005; 12: pp. 1457-1463.
19. Newell J.D., Hogg J.C., Snider G.L.: Report of a workshop: quantitative computed tomography scanning in longitudinal studies of emphysema. Eur Resp J 2004; 23: pp. 769-775.
20. Stolk J., Ng W.H., Bakker M.E., et. al.: Correlation between annual change in health status and computer tomography derived lung density in subjects with alpha1-antitrypsin deficiency. Thorax 2003; 58: pp. 1027-1030.
21. Coxson H.O.: Quantitative computed tomography assessment of airway wall dimensions: current status and potential applications for phenotyping chronic obstructive pulmonary disease. Proc Am Thorac Soc 2008; 5: pp. 940-945.
22. Hoffman E.A., Simon B.A., McLennan G.: A structural and functional assessment of the lung via multidetector-row computed tomography: phenotyping chronic obstructive pulmonary disease. Proc Am Thorac Soc 2006; 3: pp. 519-534.
23. Dirksen A., Piitulainen E., Parr D.G., et. al.: Exploring the role of CT densitometry: a randomised study of augmentation therapy in alpha1-antitrypsin deficiency. Eur Resp J 2009; 33: pp. 1345-1353.
24. Flohr T.G., Leng S., Yu L., et. al.: Dual-source spiral CT with pitch up to 3.2 and 75 ms temporal resolution: image reconstruction and assessment of image quality. Med Phys 2009; 36: pp. 5641-5653.
25. Johnson T.R.C., Krauss B., Sedlmair M., et. al.: Material differentiation by dual energy CT: initial experience. Eur Radiol 2007; 17: pp. 1510-1517.
26. Yu L., Primak A.N., Liu X., et. al.: Image quality optimization and evaluation of linearly mixed images in dual-source, dual-energy CT. Med Phys 2009; 36: pp. 1019.
27. Primak A.N., Giraldo J.C.R., Eusemann C.D., et. al.: Dual-source dual-energy CT with additional tin filtration: dose and image quality evaluation in phantoms and in vivo. AJR Am J Roentgenol 2010; 195: pp. 1164-1174.
28. Petersilka M., Stierstorfer K., Bruder H., et. al.: Strategies for scatter correction in dual source CT. Med Phys 2010; 37: pp. 5971-5992.
29. Guo J., Fuld M., Alford S.K., et. al.: Pulmonary Analysis Software Suite 9.0 Integrating quantitative measures of function with structural analyses.Brown M. et. al.First International Workshop on Pulmonary Image Analysis.2008.pp. 283-292.
30. Sieren J.P., Gunderson K., Lynch D.A., et. al.: COPDGene Phantom: quality control of quantitative lung imaging in a multi-center trial. Am J Resp Crit Care Med 2010; 181: pp. A5519.
31. Bruder H., Stierstorfer K., Petersilka M., et. al.: Correction of cross-scatter in next generation dual source CT (DSCT) scanners. Proc SPIE 2008; 6913: pp. 69131W.
32. Ohnesorge B., Flohr T., Klingenbeck-Regn K.: Efficient object scatter correction algorithm for third and fourth generation CT scanners. Eur Radiol 1999; 9: pp. 563-569.
33. Zhu L., Bennett N.R., Fahrig R.: Scatter correction method for X-ray CT using primary modulation: theory and preliminary results. IEEE Trans Med Imaging 2006; 25: pp. 1573-1587.
34. Siewerdsen J.H., Daly M.J., Bakhtiar B., et. al.: A simple, direct method for x-ray scatter estimation and correction in digital radiography and cone-beam CT. Med Phys 2006; 33: pp. 187-197.
35. Schindera S.T., Tock I., Marin D., et. al.: Effect of beam hardening on arterial enhancement in thoracoabdominal CT angiography with increasing patient size: an in vitro and in vivo study. Radiology 2010; 256: pp. 528-535.