
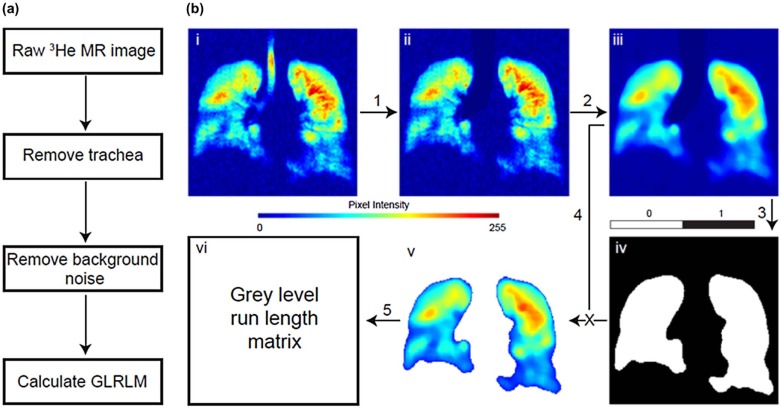
Rationale and Objectives
3 He magnetic resonance imaging (MRI) can be used to quantify functional responses to asthma therapy and provocation. Ventilation imaging offers quantitative information beyond ventilation defects that have not yet been exploited. Therefore, our objective was to evaluate hyperpolarized 3 He MRI ventilation defect percent (VDP) and compare this and pulmonary function measurements to ventilation image texture features and their changes post-bronchodilator administration in patients with asthma.
Materials and Methods
Volunteers with a diagnosis of asthma provided written informed consent to an ethics board-approved protocol and underwent pulmonary function tests and MRI before and after salbutamol inhalation. MR images were analyzed using VDP, and their texture was evaluated via gray-level run-length matrices. These texture classifiers were compared to VDP in responders to bronchodilation based on VDP (VDP responders) and forced expiratory volume in 1 s (FEV 1 ) (FEV 1 responders).
Results
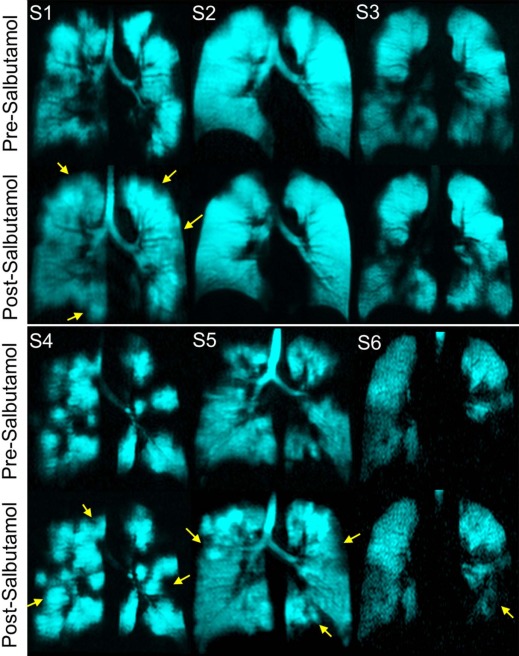
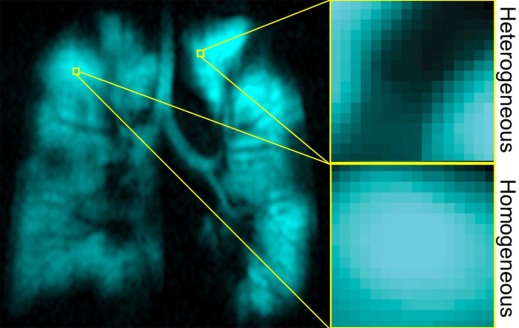
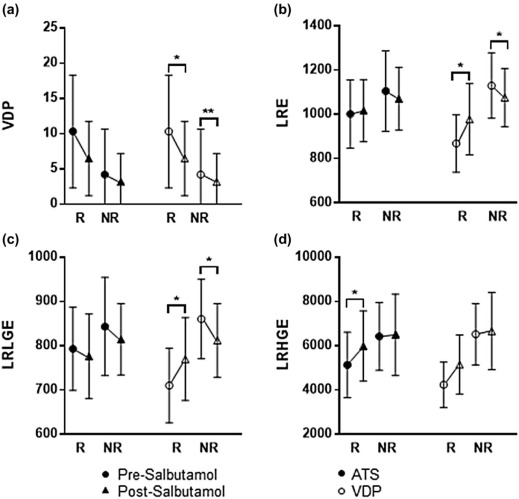
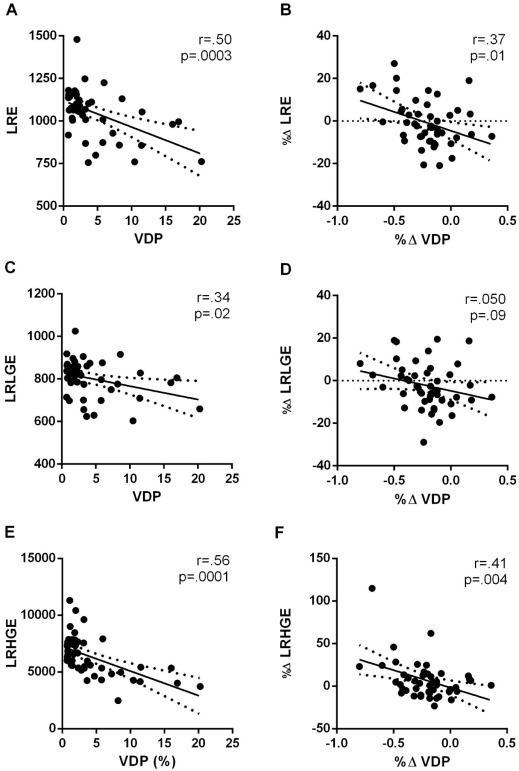
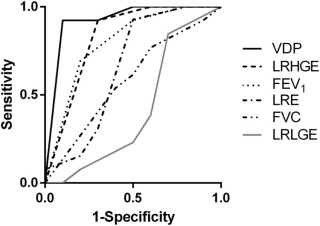
In total, 47 patients with asthma (18 males 39 ± 13 years, FEV 1 = 79 ± 21%) reported significantly improved FEV 1 , FEV 1 /forced vital capacity (FVC), residual volume (RV)/total lung capacity (TLC) (all P = .0001) and VDP ( P = .01) post-salbutamol. Post-salbutamol, VDP responders and nonresponders to salbutamol were significantly different for coarse-texture features including long-run emphasis (LRE) and long-run, low gray-level emphasis (LRLGE, both P < .05) and for FEV 1 responders to salbutamol, there was significantly different long-run, high gray-level emphasis (LRHGE, P = .04). There were significant relationships for VDP with LRE (R = .50, P = .0003), LRLGE (R = .34, P = .02), and LRHGE (R = .56, P = .0001). Receiver operating characteristic curves showed VDP with the strongest performance (AUC = .92), followed by coarse-texture classifier LRHGE (AUC = .83), FEV 1 (AUC = .80), LRE (AUC = .66), FVC (AUC = .58), and LRLGE (AUC = .42).
Conclusions
In patients with asthma, differences in ventilation patchiness post-salbutamol can be quantified using coarse-texture classifiers that are significantly different in bronchodilator responders.
Introduction
Asthma is a chronic inflammatory disease of the small and medium airways caused by smooth muscle hyper-responsiveness and inflammation, leading to intermittent symptoms of dyspnea, coughing, chest tightness, and wheezing . Global estimates indicate that approximately 300 million adults and children report an asthma diagnosis, and this is expected to increase in the future . Short- and long-acting bronchodilators are commonly administered to ease dyspnea and other symptoms , and importantly, the joint American Thoracic Society (ATS)-European Respiratory Society guidelines define a significant bronchodilator response of forced expiratory volume in 1 s (FEV 1 ) or forced vital capacity (FVC) improvement of 200 mL and 12% or greater respectively, as considered definitive for asthma . Bronchodilator response thresholds are controversial, however, because spirometry measurements do not always reflect bronchodilator response in terms of symptomatic relief .
Magnetic resonance imaging (MRI) using hyperpolarized noble gases such as 3 He and 129 Xe provides a way to visualize and quantify ventilation abnormalities in patients with asthma. Hallmark MRI findings in these patients include characteristic focal ventilation defects that appear to respond to therapy and are related to asthma severity . In addition, significant changes in ventilation defects are also observed after bronchodilator administration even in the absence of FEV 1 changes, in asthma and chronic obstructive pulmonary disease (COPD) .
Get Radiology Tree app to read full this article<
Get Radiology Tree app to read full this article<
Get Radiology Tree app to read full this article<
Methods
Study Subjects and Pulmonary Function Tests
Get Radiology Tree app to read full this article<
Get Radiology Tree app to read full this article<
Asthma Criteria
Get Radiology Tree app to read full this article<
Image Acquisition
Get Radiology Tree app to read full this article<
Image Analysis and Texture Classifier Generation
Get Radiology Tree app to read full this article<
Get Radiology Tree app to read full this article<
Get Radiology Tree app to read full this article<
Get Radiology Tree app to read full this article<
Get Radiology Tree app to read full this article<
SRE=1nr∑Mi=1∑Nj=1p(i,j)j2 S
R
E
=
1
n
r
∑
i
=
1
M
∑
j
=
1
N
p
(
i
,
j
)
j
2
LRE=1nr∑Mi=1∑Nj=1p(i,j)j2×j2 L
R
E
=
1
n
r
∑
i
=
1
M
∑
j
=
1
N
p
(
i
,
j
)
j
2
×
j
2
GLNU=1nr∑Mi=1(∑Nj=1P(i,j))2 GLNU
=
1
n
r
∑
i
=
1
M
(
∑
j
=
1
N
P
(
i
,
j
)
)
2
RLNU=1nr∑Nj=1(∑Mi=1P(i,j))2 RLNU
=
1
n
r
∑
j
=
1
N
(
∑
i
=
1
M
P
(
i
,
j
)
)
2
RP=nrP(i,j)×j R
P
=
n
r
P
(
i
,
j
)
×
j
LGRE=1nr∑Mi=1∑Nj=1P(i,j)i2 LGRE
=
1
n
r
∑
i
=
1
M
∑
j
=
1
N
P
(
i
,
j
)
i
2
HGRE=1nr∑Mi=1∑Nj=1P(i,j)×i2 HGRE
=
1
n
r
∑
i
=
1
M
∑
j
=
1
N
P
(
i
,
j
)
×
i
2
SRLGE=1nr∑Mi=1∑Nj=1p(i,j)i2×j2 SRLGE
=
1
n
r
∑
i
=
1
M
∑
j
=
1
N
p
(
i
,
j
)
i
2
×
j
2
SRHGE=1nr∑Mi=1∑Nj=1p(i,j)×i2j2 SRHGE
=
1
n
r
∑
i
=
1
M
∑
j
=
1
N
p
(
i
,
j
)
×
i
2
j
2
LRLGE=1nr∑Mi=1∑Nj=1p(i,j)×j2i2 LRLGE
=
1
n
r
∑
i
=
1
M
∑
j
=
1
N
p
(
i
,
j
)
×
j
2
i
2
LRHGE=1nr∑Mi=1∑Nj=1p(i,j)×i2×j2 LRHGE
=
1
n
r
∑
i
=
1
M
∑
j
=
1
N
p
(
i
,
j
)
×
i
2
×
j
2
Get Radiology Tree app to read full this article<
Statistics
Get Radiology Tree app to read full this article<
Results
Get Radiology Tree app to read full this article<
TABLE 1
Subject Demographics and Pulmonary Measurements
Parameter Mean (SD) Paired Significance (Two Tailed) Pre-Salbutamol ( n = 47) Post-Salbutamol ( n = 47) Age (years) 39 (13) – – Male 18 – – BMI 30 (11) – – FEV 1 % pred 79 (21) 84 (21) .0001 FVC % pred 90 (16) 91 (14) .70 FEV 1 /FVC % 71 (13) 74 (13) .0001 FEF 25–75% 48 (26) \* 77 (9) 2 .005 † TLC % pred 100 (14) 97 (12) .08 \* RV % pred 129 (35) 110 (36) .004 \* RV/TLC % pred 128 (26) 114 (25) .0001 \*
% pred , percent of predicted value; BMI, body mass index; FEV 1 , forced expiratory volume in 1 s; FVC, forced vital capacity; RV, residual volume; SD, standard deviation; TLC, total lung capacity.
Get Radiology Tree app to read full this article<
Get Radiology Tree app to read full this article<
Get Radiology Tree app to read full this article<
Get Radiology Tree app to read full this article<
Get Radiology Tree app to read full this article<
Get Radiology Tree app to read full this article<
TABLE 2
Ventilation Defect and Texture Measurements
Ventilation Measurements
Mean (SD) All Subjects ( n = 47) Responders ( n = 14) Nonresponders ( n = 33) Pre-Salbutamol Post-Salbutamol Significance Pre-Salbutamol Post-Salbutamol Significance Pre-Salbutamol Post-Salbutamol Significance VDP 6 (7) 4 (5) .01 10 (8) 7 (5) .07 4 (7) 3 (4) .5 SRE .10 (.01) .10 (.01) 2 .10 (.01) .10 (.01) 3 .1 (.01) .1 (.01) 3 LRE 1100 (200) 1100 (100) 2 1000 (150) 1020 (140) 3 1100 (180) 1100 (140) .6 GLNU 3500 (600) 3400 (700) .4 3700 (690) 3300 (550) 4 3500 (580) 3400 (700) 2 RLNU 220 (30) 220 (30) 1 220 (25) 220 (34) 2 220 (30) 230 (30) .8 RP .40 (.05) .41 (.05) .9 .43 (.05) .41 (.05) 2 .42 (.05) .41 (.05) 2 LGRE .70 (.05) .70 (.05) .2 .74 (.03) .72 (.04) .07 .72 (.03 .72 (.04) 2 HGRE 1400 (320) 1400 (300) 2 1300 (240) 1300 (260) 3 1400 (350) 1400 (300) 3 SRLGE .002 (.001) .002 (.001) .8 .002 (.001) .002 (.001) .9 .002 (.001) .002 (.001) 3 SRHGE 1400 (300) 1400 (300) 2 1300 (240) 1300 (260) 2 1400 (350) 1400 (300) 2 LRLGE 830 (100) 800 (100) .4 790 (90) 780 (100) 4 840 (110) 810 (80) .5 LRHGE 6000 (1600) 6300 (1800) .5 5100 (1500) 6000 (1600) .04 6400 (1500) 6500 (1800) 1
Ventilation Measurements
Mean (SD) VDP-Derived Responders ( n = 10) VDP-Derived Nonresponders ( n = 37) Pre-Salbutamol Post-Salbutamol Significance Pre-Salbutamol Post-Salbutamol Significance VDP 10 (3) 6 (0) .001 3 (3) 3 (3) .001 SRE .1 (.02) .1 (.01) 3 .1 (.01) .1 (.01) .5 LRE 870 (130) 980 (160) .01 1100 (150) 1100 (130) .02 GLNU 3700 (800) 3600 (450) 4 3500 (550) 3300 (690) .2 RLNU 220 (20) 220 (30) 4 220 (30) 220 (30) 1 RP .42 (.06) .42 (.05) .8 .43 (.05) .41 (.05) .3 LGRE .75 (.03) .71 (.02) 2 .72 (.03) .71 (.04) .3 HGRE 1400 (400) 1300 (310) 2 1300 (300) 1400 (290) 2 SRLGE .002 (.001) .002 (.001) 2 .002 (.001) .002 (.001) 2 SRHGE 1400 (400) 1300 (300) 3 1300 (300) 1400 (290) 1 LRLGE 710 (80) 770 (90) .04 860 (90) 810 (83) .01 LRHGE 4200 (1000) 5200 (1300) .1 6500 (1400) 6700 (1700) .8
GLNU, gray-level nonuniformity; HGRE, high gray-level run emphasis; LGRE, low gray-level run emphasis; LRE, long-run emphasis; LRHGE, long-run high gray-level emphasis; LRLGE, long-run low gray-level emphasis; RLNU, run-length nonuniformity; RP, run percentage; SD, standard deviation; SRE, short-run emphasis; SRHGE, short-run high-level gray emphasis; SRLGE, short-run, low gray-level emphasis; VDP, ventilation defect percent.
Get Radiology Tree app to read full this article<
Get Radiology Tree app to read full this article<
Get Radiology Tree app to read full this article<
Get Radiology Tree app to read full this article<
Get Radiology Tree app to read full this article<
Discussion
Get Radiology Tree app to read full this article<
Get Radiology Tree app to read full this article<
Get Radiology Tree app to read full this article<
Get Radiology Tree app to read full this article<
Get Radiology Tree app to read full this article<
Get Radiology Tree app to read full this article<
Get Radiology Tree app to read full this article<
Get Radiology Tree app to read full this article<
Acknowledgments
Get Radiology Tree app to read full this article<
Get Radiology Tree app to read full this article<
Get Radiology Tree app to read full this article<
References
1. Reddel H.K., Bateman E.D., Becker A., et. al.: A summary of the new GINA strategy: a roadmap to asthma control. Eur Respir J 2015; 46: pp. 622-639.
2. Reddel H.K., Hurd S.S., FitzGerald J.M.: World Asthma Day. GINA 2014: a global asthma strategy for a global problem. Int J Tuberc Lung Dis 2014; 18: pp. 505-506.
3. National Asthma E., Prevention P.: Expert panel report 3 (epr-3): guidelines for the diagnosis and management of asthma—summary report 2007. J Allergy Clin Immunol 2007; 120: pp. S94-S138.
4. Pellegrino R., Viegi G., Brusasco V., et. al.: Interpretative strategies for lung function tests. Eur Respir J 2005; 26: pp. 948-968.
5. Gjevre J.A., Hurst T.S., Taylor-Gjevre R.M., et. al.: The American Thoracic Society’s spirometric criteria alone is inadequate in asthma diagnosis. Can Respir J 2006; 13: pp. 433-437.
6. Albert M.S., Cates G.D., Driehuys B., et. al.: Biological magnetic resonance imaging using laser-polarized 129XE. Nature 1994; 370: pp. 199-201.
7. Tzeng Y.S., Lutchen K., Albert M.: The difference in ventilation heterogeneity between asthmatic and healthy subjects quantified using hyperpolarized 3 He MRI. J Appl Physiol 2009; 106: pp. 813-822.
8. Kruger S.J., Niles D.J., Dardzinski B., et. al.: Hyperpolarized helium-3 MRI of exercise-induced bronchoconstriction during challenge and therapy. J Magn Reson Imaging 2014; 39: pp. 1230-1237.
9. Thomen R.P., Sheshadri A., Quirk J.D., et. al.: Regional ventilation changes in severe asthma after bronchial thermoplasty with (3)HE MR imaging and CT. Radiology 2015; 274: pp. 250-259.
10. Altes T.A., Powers P.L., Knight-Scott J., et. al.: Hyperpolarized 3HE MR lung ventilation imaging in asthmatics: preliminary findings. J Magn Reson Imaging 2001; 13: pp. 378-384.
11. de Lange E.E., Altes T.A., Patrie J.T., et. al.: Evaluation of asthma with hyperpolarized helium-3 MRI: correlation with clinical severity and spirometry. Chest 2006; 130: pp. 1055-1062.
12. de Lange E.E., Altes T.A., Patrie J.T., et. al.: The variability of regional airflow obstruction within the lungs of patients with asthma: assessment with hyperpolarized helium-3 magnetic resonance imaging. J Allergy Clin Immunol 2007; 119: pp. 1072-1078.
13. Svenningsen S., Kirby M., Starr D., et. al.: What are ventilation defects in asthma?. Thorax 2014; 69: pp. 63-71.
14. Costella S., Kirby M., Maksym G.N., et. al.: Regional pulmonary response to a methacholine challenge using hyperpolarized (3)HE magnetic resonance imaging. Respirology 2012; 17: pp. 1237-1246.
15. Svenningsen S., Kirby M., Starr D., et. al.: Hyperpolarized (3) HE and (129) XE MRI: differences in asthma before bronchodilation. J Magn Reson Imaging 2013; 38: pp. 1521-1530.
16. Kirby M., Mathew L., Heydarian M., et. al.: Chronic obstructive pulmonary disease: quantification of bronchodilator effects by using hyperpolarized (3)He MRI imaging. Radiology 2011; 261: pp. 283-292.
17. Tustison N.J., Avants B.B., Flors L., et. al.: Ventilation-based segmentation of the lungs using hyperpolarized (3)He MRI. J Magn Reson Imaging 2011; 34: pp. 831-841.
18. Kirby M., Heydarian M., Svenningsen S., et. al.: Hyperpolarized 3He magnetic resonance functional imaging semiautomated segmentation. Acad Radiol 2012; 19: pp. 141-152.
19. He M., Kaushik S.S., Robertson S.H., et. al.: Extending semiautomatic ventilation defect analysis for hyperpolarized (129)XE ventilation MRI. Acad Radiol 2014; 21: pp. 1530-1541.
20. Ahn S.Y., Park C.M., Park S.J., et. al.: Prognostic value of computed tomography texture features in non-small cell lung cancers treated with definitive concomitant chemoradiotherapy. Invest Radiol 2015; 50: pp. 719-725.
21. Mattonen S.A., Palma D.A., Haasbeek C.J., et. al.: Early prediction of tumor recurrence based on ct texture changes after stereotactic ablative radiotherapy (SABR) for lung cancer. Med Phys 2014; 41: pp. 033502.
22. Meier A., Farrow C., Harris B.E., et. al.: Application of texture analysis to ventilation SPECT/CT data. Comput Med Imaging Graph 2011; 35: pp. 438-450.
23. Gao M., Fan T., Duan J.: SU-E-E-16: the application of texture analysis for differentiation of central cancer from atelectasis. Med Phys 2015; 42: pp. 3226.
24. Wei Q., Hu Y.: A study on using texture analysis methods for identifying lobar fissure regions in isotropic CT images. IEEE Eng Med Biol 2009; pp. 3537-3540.
25. Risse F., Pesic J., Young S., et. al.: A texture analysis approach to quantify ventilation changes in hyperpolarised (3)He MRI of the rat lung in an asthma model. NMR Biomed 2012; 25: pp. 131-141.
26. Tustison N.J., Altes T.A., Song G., et. al.: Feature analysis of hyperpolarized helium-3 pulmonary MRI: a study of asthmatics versus nonasthmatics. Magn Reson Med 2010; 63: pp. 1448-1455.
27. Miller M.R., Hankinson J., Brusasco V., et. al.: Standardisation of spirometry. Eur Respir J 2005; 26: pp. 319-338.
28. Cockcroft D.W.: Direct challenge tests: airway hyperresponsiveness in asthma: its measurement and clinical significance. Chest 2010; 138: pp. 18S-24S.
29. Mauger E.A., Mauger D.T., Fish J.E., et. al.: Summarizing methacholine challenges in clinical research. Control Clin Trials 2001; 22: pp. 244S-251S.
30. Tang X.: Texture information in run-length matrices. IEEE Trans Image Process 1998; 7: pp. 1602-1609.
31. Ergen B., Baykara M.: Texture based feature extraction methods for content based medical image retrieval systems. Biomed Mater Eng 2014; 24: pp. 3055-3062.
32. Galloway M.M.: Texture analysis using gray level run lengths. Comput Graph Image Process 1975; 4: pp. 172-179.
33. Bhatt S.P., Wells J.M., Kim V., et. al.: Radiological correlates and clinical implications of the paradoxical lung function response to beta(2) agonists: an observational study. Lancet Respir Med 2014; 2: pp. 911-918.