
Rationale and Objectives
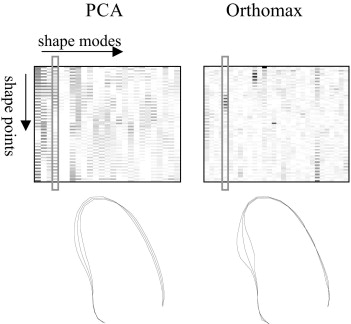
Parametric shape representations of endocardial contours, obtained with principal component analysis (PCA) and the orthomax criterion, provide compact descriptors for classifying segmental left ventricular wall motion.
Materials and Methods
Endocardial contours were delineated in the left ventricular echocardiograms of 129 patients. Parametric models of these shapes were built with PCA and subsequently rotated using the orthomax criterion, producing models with local variations. Shape parameters of this localized model were used to predict the presence of wall motion abnormalities, as determined by expert visual wall motion scoring.
Results
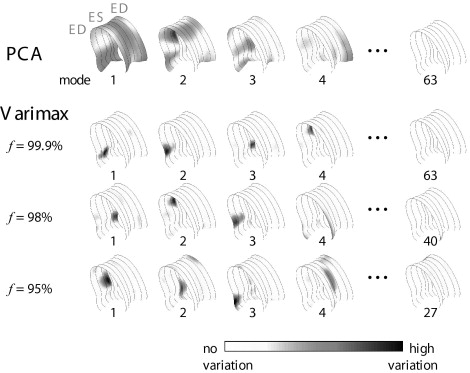
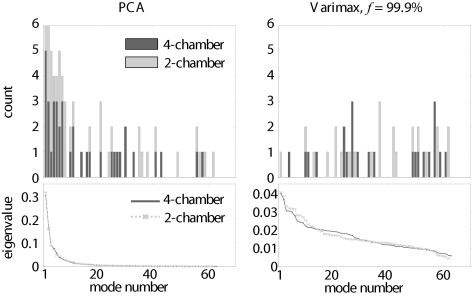
Best results were obtained using the varimax criterion and full variance models. Although traditional PCA models needed 8.0 ± 3.0 parameters to classify segmental wall motion, only 5.1 ± 3.2 parameters were needed using the orthomax rotated models ( P < .05) to achieve similar classification accuracy. The classification space was also better behaved.
Conclusions
Orthomax rotation generates more local parameters, which are successful in reducing the complexity of wall motion classification. Because pathologies are typically spatially localized, many medical applications involving local classification should benefit from orthomax parameterizations.
Coronary artery diseases are a major cause of death in the Western world. Detection of wall motion abnormalities of the left ventricle, widely accepted as predictors for these diseases, is therefore of great clinical importance. Echocardiographic examination is often used for diagnosing these wall motion abnormalities, because of the speed of acquisition, the high spatial and temporal resolution, and the relatively low cost of the technique. A well-established method is stress echocardiography, which compares the left ventricular (LV) wall motion in images acquired at different stages of stress ( ). However, because the images are often evaluated visually, a quantitative and objective measure of wall motion is still lacking. To obtain such quantitative measures, automated analysis of LV wall motion may be preferred to currently visual, and therefore subjective, assessments.
Various quantitative measures have been proposed to assess wall motion in the literature ( ). Methods such as acoustic quantification and color kinesis ( ) observe the backscatter of the ultrasonic signal to measure the endocardial motion. Tissue Doppler imaging ( ) generates measurements of velocity, displacement, and strain/strain–rate values. These values can also be obtained using image-based speckle-tracking methods ( ), which are becoming increasingly popular. Other image-based methods use manual or automated delineations of the endocardial border to assess, for example, regional volumes, which may be of help in quantifying wall motion ( ).
Get Radiology Tree app to read full this article<
Get Radiology Tree app to read full this article<
Materials and methods
Stress Echo and Visual Wall Motion Scoring
Get Radiology Tree app to read full this article<
Get Radiology Tree app to read full this article<
Analysis of Endocardial Contours via Shape Models
Get Radiology Tree app to read full this article<
x=x¯+Φb, x
=
x
¯
+
Φ
b
,
where x¯ x
¯ is the average shape, and Φ is the eigenvector matrix. Typically, the number of shape modes is similar to the number of input training samples. Any new shape can be projected to this model using the pseudoinverse ( Φ −1 ) of the eigenvector matrix: b≈Φ−1(x−x¯). b
≈
Φ
−
1
(
x
−
x
¯
)
.
Get Radiology Tree app to read full this article<
Get Radiology Tree app to read full this article<
Get Radiology Tree app to read full this article<
Orthomax Rotations
Get Radiology Tree app to read full this article<
Get Radiology Tree app to read full this article<
Get Radiology Tree app to read full this article<
Get Radiology Tree app to read full this article<
ξ={∑kj=1∑ni=1G4ij−γn∑kj=1[∑ni=1G2ij]2}/n, ξ
=
{
∑
j
=
1
k
∑
i
=
1
n
G
i
j
4
−
γ
n
∑
j
=
1
k
[
∑
i
=
1
n
G
i
j
2
]
2
}
∕
n
,
where G__ij denotes the scalar element in the i__th row and j__th column in the rotated eigenvector matrix G = ΦR , and γ is the orthomax type. The shape coefficients after rotation bR can be found with bR = R −1 b .
Get Radiology Tree app to read full this article<
Get Radiology Tree app to read full this article<
Get Radiology Tree app to read full this article<
∑ki=1λi≥fV, ∑
i
=
1
k
λ
i
≥
f
V
,
where k denotes the number of eigenvectors with the largest eigenvalues λ i . Modes with low eigenvalues, corresponding with the rightmost columns of the eigenvector matrix Φ , are removed before the orthomax rotation.
Get Radiology Tree app to read full this article<
Get Radiology Tree app to read full this article<
Clinical Data and Contour Delineation
Get Radiology Tree app to read full this article<
Get Radiology Tree app to read full this article<
Get Radiology Tree app to read full this article<
Wall Motion Classification
Get Radiology Tree app to read full this article<
Get Radiology Tree app to read full this article<
Get Radiology Tree app to read full this article<
Get Radiology Tree app to read full this article<
Results
Orthomax Rotations
Get Radiology Tree app to read full this article<
Get Radiology Tree app to read full this article<
Orthomax Criteria
Get Radiology Tree app to read full this article<
Table 1
Classification Accuracy of Individual Segments versus the Number of Shape Parameters Used (mean ± SD) for Different Orthomax Criteria, Averaged over Nine Segments
f Classification Accuracy Parameters TRN L-1-O TST PCA 99.9% 88.9 ± 5.9% 74.0 ± 9.4% 8.0 ± 3.0 Quartimax 99.9% 90.1 ± 5.2% 75.4 ± 9.8% 5.6 ± 3.9 ⁎ Factor parsimony 99.9% 89.4 ± 5.7% 76.3 ± 10.3% 5.4 ± 3.2 ⁎ Varimax 99.9% 91.1 ± 4.5% 76.5 ± 10.5% 5.1 ± 3.2 ⁎ 99% 88.9 ± 5.9% 76.0 ± 8.7% 5.7 ± 3.3 ⁎ 98% 87.7 ± 7.0% 75.8 ± 9.5% 6.4 ± 3.5 95% 86.3 ± 6.1% 76.3 ± 9.0% 6.6 ± 3.7
PCA, principal component analysis; TRN, training set; TST, testing set.
f denotes different proportions of retained variance in the shape models.
Get Radiology Tree app to read full this article<
Get Radiology Tree app to read full this article<
Proportion of Retained Variance
Get Radiology Tree app to read full this article<
Get Radiology Tree app to read full this article<
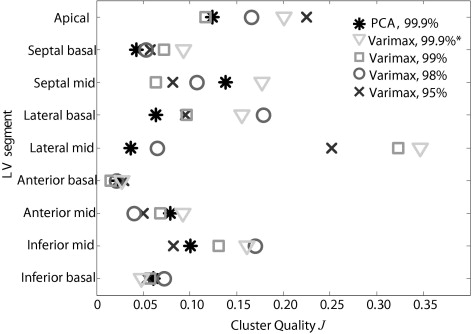
Segmental Classification
Get Radiology Tree app to read full this article<
Table 2
Classification Accuracy in Multiple Segments versus the Number of PCA and Varimax Shape Parameters Used
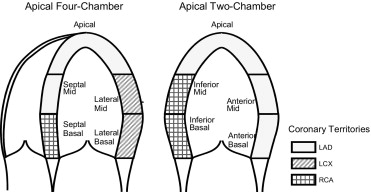
View Segment ( n ) Normal PCA f = 99.9% Varimax f = 99.9% Classification Accuracy # Parameters Classification Accuracy # Parameters TRN L-1-O TST TRN L-1-O TST 4C+2C All (9) 25.6% 89.2% 70.3% 11 100% 70.9% 47 4C Total 4C (5) 22.5% 87.7% 78.1% 13 96.9% 81.3% 18 2C Total 2C (5) 6.2% 100% 96.9% 21 100% 96.9% 35 4C Septal (2) 29.5% 100% 67.2% 28 92.3% 64.1% 24 4C Lateral (2) 49.6% 81.5% 70.3% 10 90.8% 70.3% 8 2C Anterior (2) 61.2% 93.8% 73.4% 11 93.8% 75.0% 14 2C Inferior (2) 30.2% 93.8% 75.0% 14 98.5% 76.6% 14 2-segment combinations: Mean 42.6% 92.3% 71.5% 15.8 93.9% 71.5% 13.8 SD 15.5% 7.8% 3.5% 8.3 3.3% 5.6% 7.3
2C, two-chamber; 4C, four-chamber; PCA, principal component analysis; TRN, training set; TST, testing set.
n denotes the number of segments combined.
The percentage of normal motion of all datasets is also listed.
Table 3
Classification Accuracy in Individual Segments versus the Number of PCA and Varimax Shape Parameters Used
View Segment Normal PCA f = 99.9% Varimax f = 99.9% Classification Accuracy # Parameters Classification Accuracy # Parameters TRN L-1-O TST TRN L-1-O TST 4C+2C Apical 34.9% 93.8% 81.3% 7 95.4% 85.9% 6 4C Septal Basal 59.7% 86.6% 70.3% 10 90.8% 64.1% 5 4C Septal Mid 42.6% 92.3% 73.4% 12 92.3% 73.4% 11 4C Lateral Basal 84.5% 86.2% 64.1% 8 90.8% 82.8% 2 4C Lateral Mid 51.2% 76.9% 69.8% 6 81.5% 71.4% 2 2C Anterior Basal 97.7% 95.4% 95.3% 3 96.9% 96.9% 2 2C Anterior Mid 61.2% 93.8% 74.6% 11 93.8% 76.2% 9 2C Inferior Basal 42.6% 84.6% 71.9% 5 90.8% 71.9% 5 2C Inferior Mid 39.5% 90.8% 65.6% 10 87.7% 65.6% 4 Mean 57.1% 88.9% 74.0% 8.0 91.1% 76.5% 5.1 ⁎ SD 21.4% 5.9% 9.4% 3.0 4.5% 10.5% 3.2
2C, two-chamber; 4C, four-chamber; PCA, principal component analysis; TRN, training set; TST, testing set.
The percentage of normal motion of all datasets is also listed.
Get Radiology Tree app to read full this article<
Get Radiology Tree app to read full this article<
Get Radiology Tree app to read full this article<
Get Radiology Tree app to read full this article<
Get Radiology Tree app to read full this article<
Get Radiology Tree app to read full this article<
Discussion
Get Radiology Tree app to read full this article<
Orthomax Criteria
Get Radiology Tree app to read full this article<
Proportion of Retained Variance
Get Radiology Tree app to read full this article<
Segmental Classification
Get Radiology Tree app to read full this article<
Get Radiology Tree app to read full this article<
Get Radiology Tree app to read full this article<
Visual Wall Motion Scoring and Alternatives
Get Radiology Tree app to read full this article<
Get Radiology Tree app to read full this article<
Limitations of Study Setup
Get Radiology Tree app to read full this article<
Get Radiology Tree app to read full this article<
Orthomax Extensions and Alternatives
Get Radiology Tree app to read full this article<
Get Radiology Tree app to read full this article<
Conclusions
Get Radiology Tree app to read full this article<
Get Radiology Tree app to read full this article<
Acknowledgments
Get Radiology Tree app to read full this article<
Get Radiology Tree app to read full this article<
References
1. Marwick T.H.: Stress echocardiography: its role in the diagnosis and evaluation of coronary artery disease.2nd ed.2003.Kluwer Academic PublishersNorwell, MA
2. Thomas J.D., Popovic Z.B.: Assessment of left ventricular function by cardiac ultrasound. J Am Coll Cardiol 2006; 48: pp. 2012-2025.
3. Mor-Avi V., Vignon P., Koch R., et. al.: Segmental analysis of color kinesis images: new method for quantification of the magnitude and timing of endocardial motion during left ventricular systole and diastole. Circulation 1997; 95: pp. 2082-2097.
4. Armstrong G., Pasquet A., Fukamachi K., et. al.: Use of peak systolic strain as an index of regional left ventricular function: comparison with tissue Doppler velocity during dobutamine stress and myocardial ischemia. J Am Soc Echocardiogr 2000; 13: pp. 731-737.
5. Helle-Valle T., Crosby J., Edvardsen T., et. al.: New noninvasive method for assessment of left ventricular rotation: speckle tracking echocardiography. Circulation 2005; 112: pp. 3149-3156.
6. Walimbe V., Garcia M., Lalude O., et. al.: Quantitative real-time 3-dimensional stress echocardiography: a preliminary investigation of feasibility and effectiveness. J Am Soc Echocardiogr 2007; 20: pp. 13-22.
7. Assmann P.E., Slager C.J., van der Borden S.G., et. al.: Comparison of models for quantitative left ventricular wall motion analysis from two-dimensional echocardiograms during acute myocardial infarction. Am J Cardiol 1993; 71: pp. 1262-1269.
8. Frouin F., Delouche A., Raffoul H., et. al.: Factor analysis of the left ventricle by echocardiography (FALVE): a new tool for detecting regional wall motion abnormalities. Eur J Echocardiogr 2004; 5: pp. 335-346.
9. Aoued F., Eroglu E., Herbots L., et. al.: A statistical model-based approach for the detection of abnormal cardiac deformation. Proc IEEE Int Ultrasonics Symp 2005; pp. 512-515.
10. Fung G., Qazi M., Krishnan S., et. al.: Sparse classifiers for automated heart wall motion abnormality detection. Proc Fourth Int Conf Machine Learning and Applications 2005; pp. 194-200.
11. Bosch J.G., Nijland F., Mitchell S.C., et. al.: Computer-aided diagnosis via model-based shape analysis: automated classification of wall motion abnormalities in echocardiograms. Acad Radiol 2005; 12: pp. 358-367.
12. Nijland F., Kamp O., Verhorst P.M.J., et. al.: Myocardial viability: impact on left ventricular dilatation after acute myocardial infarction. Heart 2002; 87: pp. 17-22.
13. Hoffmann R., Lethen H., Marwick T., et. al.: Analysis of interinstitutional observer agreement in interpretation of dobutamine stress echocardiograms. J Am Coll Cardiol 1996; 27: pp. 330-336.
14. Cootes T.F., Edwards G.J., Taylor C.J.: Active appearance models. IEEE Trans Pattern Anal Machine Intell 2001; 23: pp. 681-685.
15. Bosch J.G., Mitchell S.C., Lelieveldt B.P.F., et. al.: Automatic segmentation of echocardiographic sequences by active appearance motion models. IEEE Trans Med Imag 2002; 21: pp. 1374-1383.
16. Stegmann M.B., Sjöstrand K., Larsen R.: Sparse modeling of landmark and texture variability using the orthomax criterion. SPIE Med Imag: Image Processing 2006; 6144: pp. 61441G.
17. Browne M.W.: An overview of analytic rotation in exploratory factor analysis. Multivar Behav Res 2001; 36: pp. 111-150.
18. Crawford C.B., Ferguson G.A.: A general rotation criterion and its use in orthogonal rotation. Psychometrika 1970; 35: pp. 321-332.
19. Kaiser H.F.: The varimax criterion for analytic rotation in factor analysis. Psychometrika 1958; 23: pp. 187-200.
20. Matlab: The language of technical computing, 7.0.4 (R14), Service Pack 2.2005.The MathWorks, Inc
21. Bosch H.G., van Burken G., Nijland F., et. al.: Overview of automated quantitation techniques in 2D echocardiography.Reiber J.H.C.van der Wall E.E.Whats new in cardiovascular imaging?.1998.Kluwer Academic PublishersDordrecht, The Netherlands:pp. 363-376.
22. Webb A.R.: Statistical pattern recognition.2nd ed.2002.John Wiley & Sons, LtdChicester, UK
23. Suinesiaputra A., Üzümcü M., Frangi A.F., et. al.: Detecting regional abnormal cardiac contraction in short-axis images using independent component analysis. Proc MICCAI 2004; LNCS 3216: pp. 737-744.
24. Suinesiaputra A., Frangi A.F., Lamb H.J., et. al.: Automatic prediction of myocardial contractility improvement in stress MRI using shape morphometrics with independent component analysis. Proc IPMI 2005; LNCS 3565: pp. 321-332.
25. Aggeli C., Giannopoulos G., Misovoulos P., et. al.: Real-time three-dimensional dobutamine stress echocardiography for coronary artery disease diagnosis: validation with coronary angiography. Heart 2007; 93: pp. 672-675.
26. Pulerwitz T., Hirata K., Abe Y., et. al.: Feasibility of using a real-time 3-dimensional technique for contrast dobutamine stress echocardiography. J Am Soc Echocardiogr 2006; 19: pp. 540-545.
27. Üzümcü M., Frangi A.F., Reiber J.H.C., Lelieveldt B.P.F.: Independent component analysis in statistical shape models. Proc SPIE Med Imag: Image Processing 2003; 5032: pp. 375-383.
28. Zou H., Hastie T., Tibshirani R.: Sparse principal component analysis. Technical report, Standford University 2004; pp. 1-30.
29. Sjöstrand K., Stegmann M.B., Larsen R.: Sparse principal component analysis in medical shape modeling. SPIE Med Imag: Image Processing 2006; 6144: pp. 61444X.