
Rationale and Objectives
This article deals with an automatic tissue segmentation of brain magnetic resonance imaging (MRI) in young children.
Materials and Methods
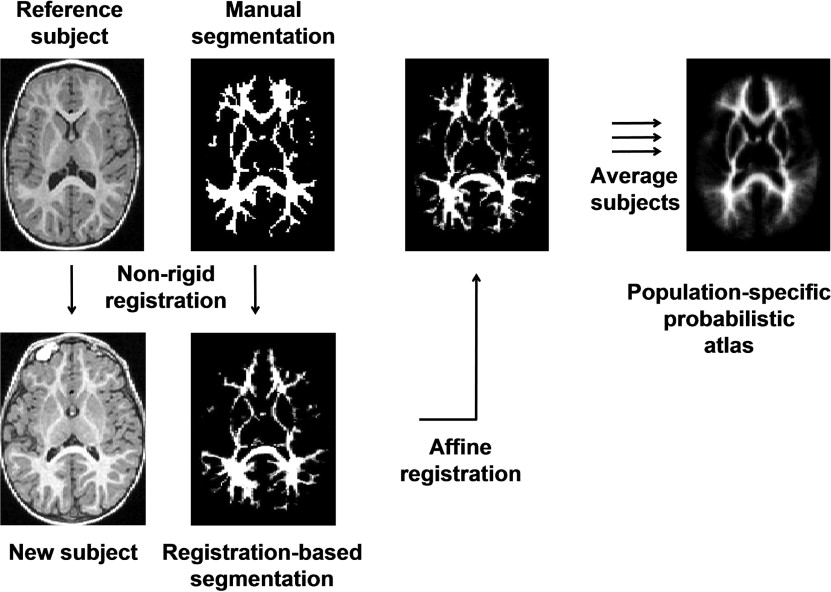
We examine the suitability of state-of-the-art methods developed for the adult brain when applied to the segmentation of the brain MRI in young children. We develop a method of creation of a population-specific atlas in young children using a single manual segmentation. The method is based on nonlinear propagation of the segmentation into population and subsequent affine alignment into a reference space and averaging.
Results
Using this approach, we significantly improve the performance of the popular expectation-maximization algorithm on brain MRI in young children. The method can be used for building probabilistic atlases with any number of structures. We compare resulting algorithm with nonrigid registration-based label propagation.
Conclusions
Finally, both methods are used to measure the volume of seven brain structures and measure the growth between 1 and 2 years of age.
The problem of automatic segmentation of brain magnetic resonance imaging (MRI) has been extensively studied in past decade thanks to its applications in clinical studies of normal and diseased brain. Recent research of brain development in prematurely born children requires reliable and accurate automatic segmentation techniques for the neonatal and early childhood brain as well. Approximately 40% of prematurely born children have cognitive, neurologic, or behavioral impairment ( ); the cerebral abnormalities underlying problems such as minor motor impairment or inattention still remain unclear. Accurate tissue quantification of the preterm brain in early childhood would allow us to study the growth of different structures and help to relate developmental outcomes to changes in volume and shape of anatomic structures.
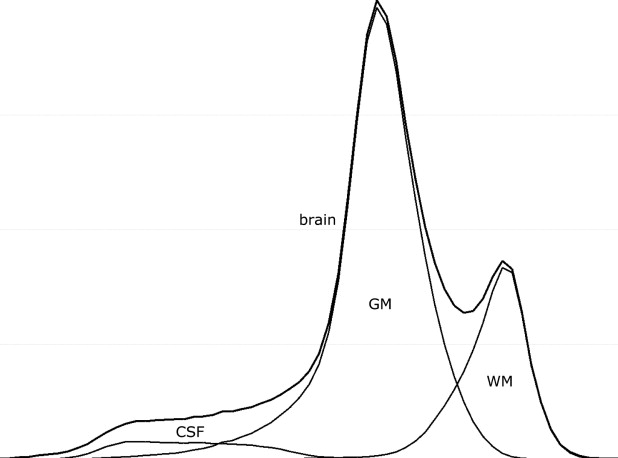
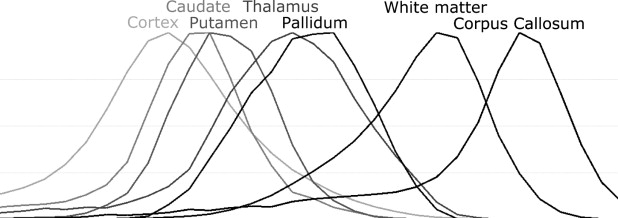
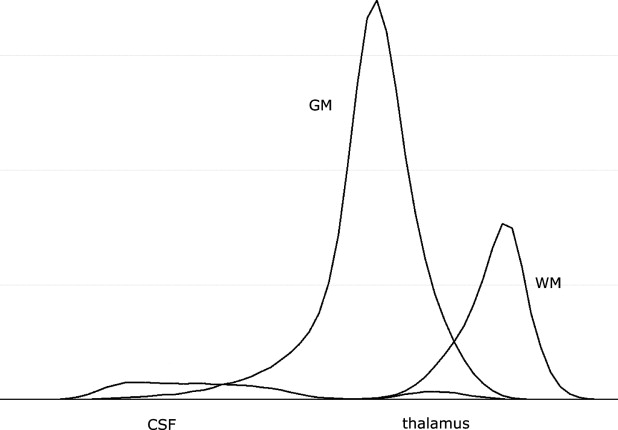
In addition to noise, intensity nonuniformity, partial volume effect, and natural tissue intensity variation present in the adult brain MRI, neonatal and infant brain MRI tissue intensities have even greater natural variation caused by ongoing process of myelination of white matter. This is most profound in neonates in whom white matter is extremely difficult to distinguish from gray matter on T1-weighted MRI sequences. By the age of 1 or 2 years, the majority of white matter has myelinated. However, the natural tissue intensity distribution overlap may result in large misclassifications in central brain structures when using intensity-based segmentation approaches. This problem is further compounded by the fact that a child’s brain differs significantly in size and shape from the adult brain, in particular in the central structures of the brain ( ). This causes problems for methods which rely on probabilistic atlases built from adults as spatial prior information.
Get Radiology Tree app to read full this article<
Related work
Get Radiology Tree app to read full this article<
Get Radiology Tree app to read full this article<
Get Radiology Tree app to read full this article<
Get Radiology Tree app to read full this article<
Get Radiology Tree app to read full this article<
Get Radiology Tree app to read full this article<
Get Radiology Tree app to read full this article<
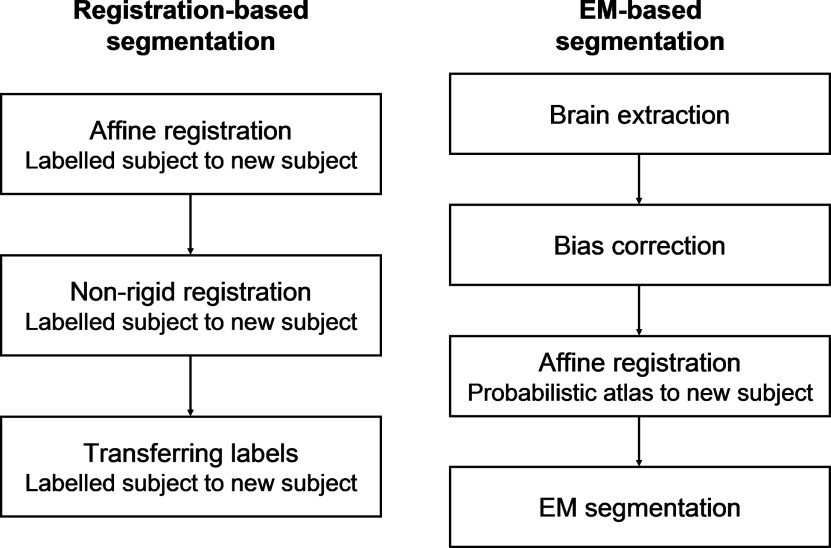
Segmentation methods
Registration-Based Segmentation
Get Radiology Tree app to read full this article<
Get Radiology Tree app to read full this article<
EM-Based Segmentation
Get Radiology Tree app to read full this article<
Get Radiology Tree app to read full this article<
E-Step
Get Radiology Tree app to read full this article<
pmik=G(yi,μm−1k,σm−1k)patlasik∑jG(yi,μm−1j,σm−1j)patlasij p
i
k
m
=
G
(
y
i
,
μ
k
m
−
1
,
σ
k
m
−
1
)
p
i
k
a
t
l
a
s
∑
j
G
(
y
i
,
μ
j
m
−
1
,
σ
j
m
−
1
)
p
i
j
a
t
l
a
s
Get Radiology Tree app to read full this article<
M-Step
Get Radiology Tree app to read full this article<
μmik=∑ipmikyi∑ipmikσmk=∑ipmik(yi−μmk)2∑ipnik μ
i
k
m
=
∑
i
p
i
k
m
y
i
∑
i
p
i
k
m
σ
k
m
=
∑
i
p
i
k
m
(
y
i
−
μ
k
m
)
2
∑
i
p
i
k
n
Get Radiology Tree app to read full this article<
Get Radiology Tree app to read full this article<
Prior information for EM segmentation
Standard Probabilistic Atlas
Get Radiology Tree app to read full this article<
Get Radiology Tree app to read full this article<
Get Radiology Tree app to read full this article<
Creating a Population-Specific Atlas for EM Segmentation
Get Radiology Tree app to read full this article<
Get Radiology Tree app to read full this article<
Get Radiology Tree app to read full this article<
Get Radiology Tree app to read full this article<
Get Radiology Tree app to read full this article<
Get Radiology Tree app to read full this article<
Comparison of the methods
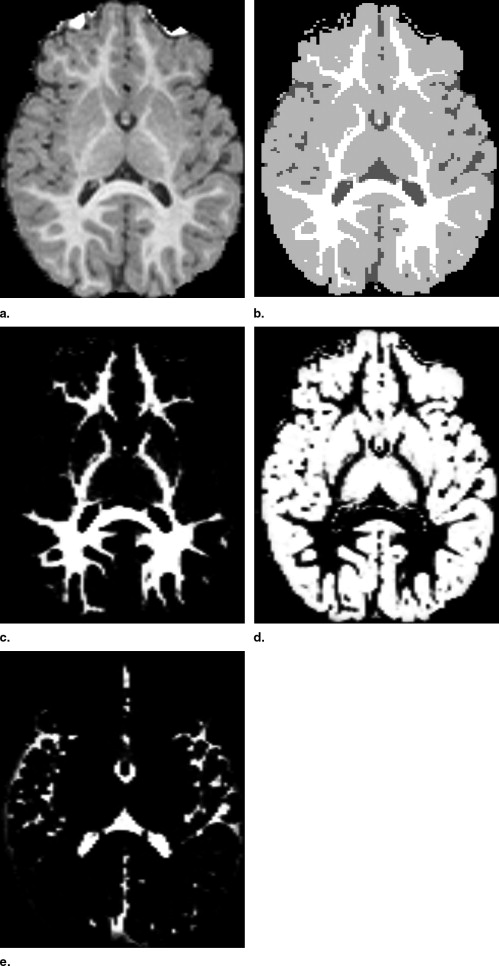
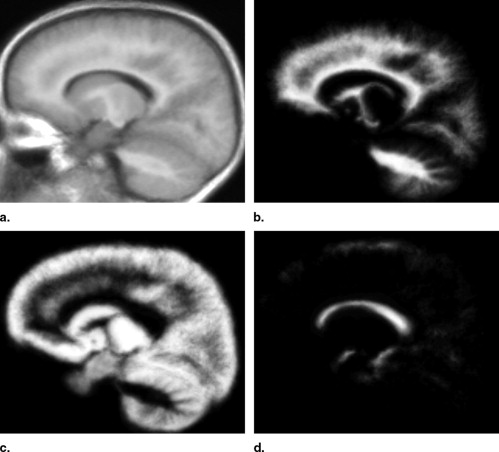
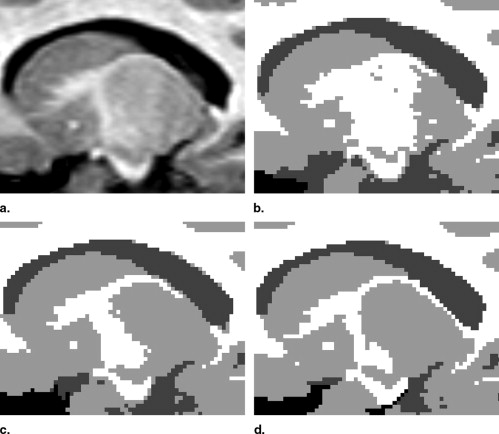
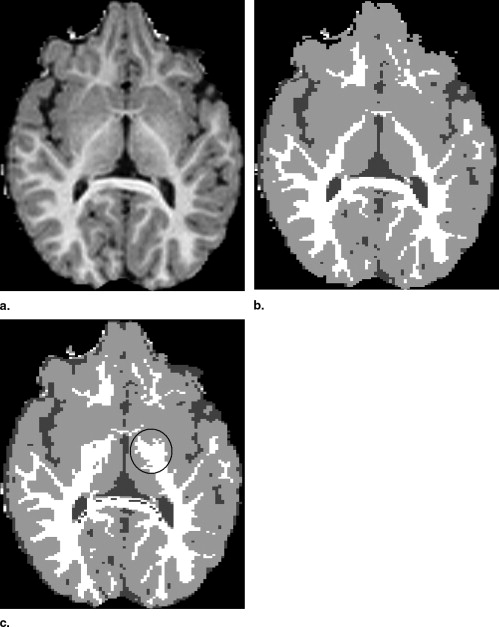
Visual Inspection
Get Radiology Tree app to read full this article<
Get Radiology Tree app to read full this article<
Get Radiology Tree app to read full this article<
Get Radiology Tree app to read full this article<
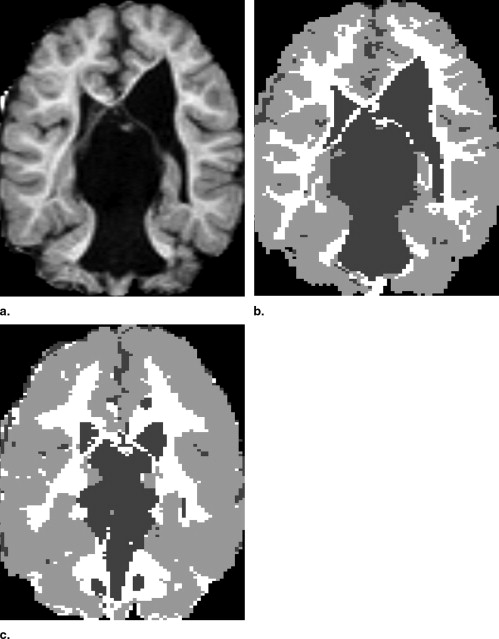
Get Radiology Tree app to read full this article<
Influence of Population-Specific Atlas on EM-Based Segmentation into WM, GM, and CSF
Get Radiology Tree app to read full this article<
Table 3
Average Validation Results of EM-Based Method With Population-Specific Atlas and Nonrigid Registration-Based Label Propagation on Four 2-Year-Old Subjects Using Dice Metrics
Method White Cortex Caudate Thalamus EM 2-year atlas 0.87 0.87 0.84 0.86 NR registration 0.84 0.83 0.86 0.89
EM: our implementation of expectation-maximization algorithm; NR: non-rigid registration-based segmentation.
Get Radiology Tree app to read full this article<
Get Radiology Tree app to read full this article<
D=2∗|Tgt∩Tseg||Tgt|+|Tseg| D
=
2
∗
|
T
g
t
∩
T
s
e
g
|
|
T
g
t
|
+
|
T
s
e
g
|
Get Radiology Tree app to read full this article<
Get Radiology Tree app to read full this article<
D=2∗∣∣Tthalgt∩TGMseg∣∣∣∣Tthalgt∣∣+∣∣TGMseg∩Tthakgt∣∣ D
=
2
∗
|
T
g
t
t
h
a
l
∩
T
s
e
g
G
M
|
|
T
g
t
t
h
a
l
|
+
|
T
s
e
g
G
M
∩
T
g
t
t
h
a
k
|
Get Radiology Tree app to read full this article<
Get Radiology Tree app to read full this article<
Table 1
Performance of the Segmentation Methods on a Single 2-Year-Old Subject
Method White Matter Gray Matter Cerebrospinal Fluid EMS 0.84 0.88 0.69 EMS-Markov random fields 0.85 0.89 0.62 EM adult atlas 0.85 0.88 0.68 EM 2-year atlas 0.88 0.92 0.78
EMS: expectation maximization segmentation with bias correction ( ); EM: our implementation of EMS without bias correction.
Get Radiology Tree app to read full this article<
Get Radiology Tree app to read full this article<
Table 2
Average Validation Results EM Segmentation on Four 2-Year-Old Subjects Using Dice Metrics
Method White Matter Gray Matter Thalamus EM 2-year atlas 0.86 0.88 0.92 EM adult atlas 0.84 0.86 0.70
EM: our implementation of EMS without bias correction.
Get Radiology Tree app to read full this article<
Comparison of EM-Based and Registration-Based Segmentation into Seven Structures
Get Radiology Tree app to read full this article<
Calculating Brain Growth From 1 to 2 Years
Get Radiology Tree app to read full this article<
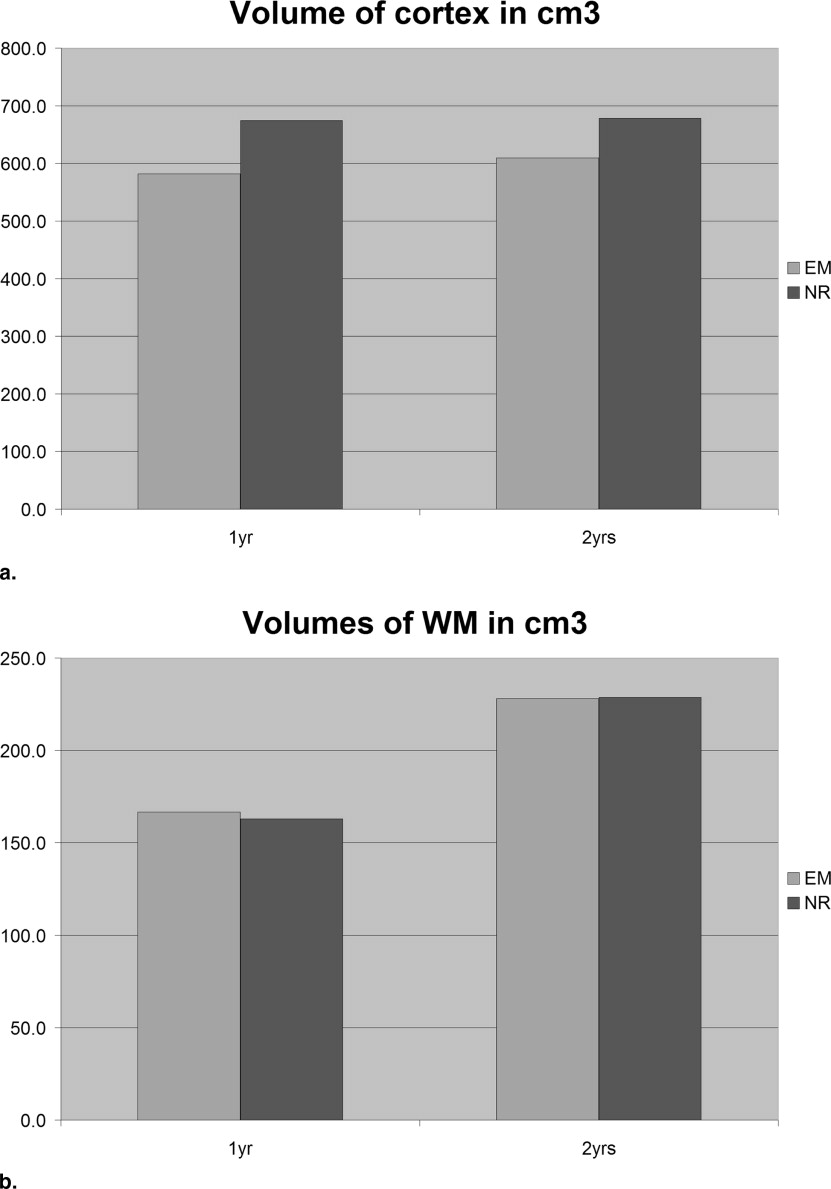
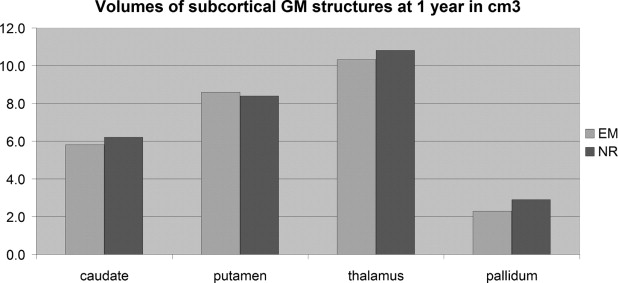
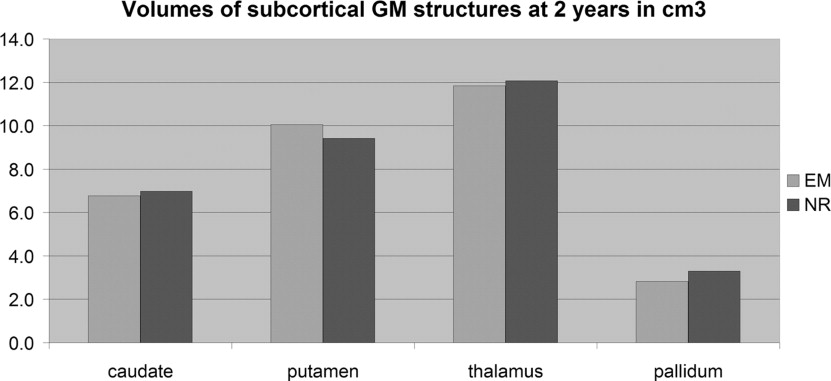
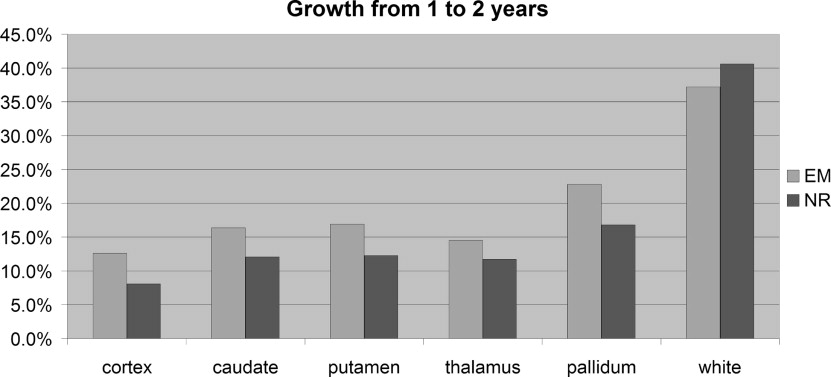
Get Radiology Tree app to read full this article<
Discussion
Get Radiology Tree app to read full this article<
Get Radiology Tree app to read full this article<
Get Radiology Tree app to read full this article<
Get Radiology Tree app to read full this article<
Conclusion
Get Radiology Tree app to read full this article<
References
1. Marlow N., Wolke D., Bracewell M.A., et. al., EPICure Study Group: Neurologic and developmental disability at six years of age after extremely preterm birth. Pediatrics 2005; 115: pp. 286-294.
2. Wilke M., Schmithorst V., Holland S.: Normative pediatric brain data for spatial normalization and segmentation differs from standard adult data. Magn Res Med 2003; 50: pp. 749-757.
3. Leemput K.V., Maes F., Vandermeulen D., et. al.: Automated model-based tissue classification of MR images of the brain. IEEE Trans Med Imaging 1999; 18: pp. 897-908.
4. Leemput K.V., Maes F., Vandermeulen D., et. al.: Automated model-based bias field correction of MR images of the brain. IEEE Trans Med Imaging 1999; 18: pp. 885-896.
5. Rueckert D., Sonoda L.I., Hayes C., et. al.: Non-rigid registration using free-form deformations: application to breast MR images. IEEE Trans Med Imaging 1999; 18: pp. 712-721.
6. Wells W.M., Grimson W.E.L., Kikinis R., et. al.: Adaptive segmentation of MRI data. IEEE Trans Med Imaging 1996; 15: pp. 429-442.
7. Ashburner J.: Computational neuroanatomy.2000.University College London
8. Ashburner J., Friston K.: Unified segmentation. NeuroImage 2005; 26: pp. 839-851.
9. Zhang Y., Brady M., Smith S.: Segmentation of brain MR images through a hidden Markov random field model and the expectation maximization algorithm. IEEE Trans Med Imaging 2001; 20: pp. 45-57.
10. Fischl B., Salat D., Busa E., et. al.: Whole brain segmentation: automated labeling of neuroanatomical structures in the human brain. Neurotechnique 2002; 33: pp. 341-355.
11. Ren J., Sneller B., Rueckert D., et. al.: A comparison of tissue type labelings of direct classification and segmentation propagation techniques for MR brain images. Proc Med Image Understanding Anal 2005; pp. 55-58.
12. Pohl K., Wells W., Guimond A., et. al.: Incorporating non-rigid registration into expectation maximization algorithm to segment MR images. Proc 5th Int Conf Med Image Comp Computer-Assisted Intervention 2002; 2488: pp. 564-572.
13. D’Agostino E., Maes F., Vandermeulen D., et. al.: Non-rigid atlas-to-image registration by minimization of class-conditional image entropy. Proc 7th Int Conf Med Image Comp Computer-Assisted Intervention 2004; pp. 745-753.
14. Pohl K.: Prior information for brain parcellation.2005.Massachusetts Institute of Technology
15. Pohl K.M., Fisher J., Grimson W., et. al.: A Bayesian model for joint segmentation and registration. NeuroImage 2006; 31: pp. 228-239.
16. Cocosco C.A., Zijdenbos A.P., Evans A.C.: A fully automatic and robust brain MRI tissue classification method. Med Image Anal 2003; 7: pp. 513-527.
17. Prastawa M., Gilmore J.H., Lin W., et. al.: Automatic segmentation of neonatal brain MRI. Proc 7th Int Conf Med Image Comp Computer-Assisted Intervention 2004; pp. 10-17.
18. Hajnal J., Hill D., Hawkes D.: Medical image registration.2001.CRC Press UCUSA
19. Dempster A.P., Laird N.M., Rubin D.B.: Maximum likelihood from incomplete data via the EM-algorithm. J Roy Stat So 1977; 39: pp. 1-38.
20. UCL/SPM. Statistical parametric mapping. Available online at: www.fil.ion.ucl.ac.uk/spm .
21. Sled J.G., Zijdenbos A., Evans A.: A nonparametric method for automatic correction of intensity nonuniformity in MRI data. IEEE Trans Med Imaging 1998; 17: pp. 87-97.
22. Smith S.: Fast robust automated brain extraction. Human Brain Map 2002; 17: pp. 143-155.
23. Expectation maximization segmentation. Available online at: www.medicalimagecomputing.com/downloads/ems.php .
24. Dice L.R.: Measures of the amount of ecologic association between species. Ecology 1945; 26: pp. 297-302.
25. Image Registration Toolkit. Available online at: www.doc.ic.ac.uk/∼dr/software/ .
26. Crum W.R., Rueckert D., Jenkinson M., et. al.: A framework for detailed objective comparison of non-rigid registration algorithms in neuroimaging. MICCAI 2004; 1: pp. 679-686.