
Rationale and Objectives
The aim of this study was to develop a novel algorithm for segmenting lung nodules on three-dimensional (3D) computed tomographic images to improve the performance of computer-aided diagnosis (CAD) systems.
Materials and Methods
The database used in this study consists of two data sets obtained from the Lung Imaging Database Consortium. The first data set, containing 23 nodules (22% irregular nodules, 13% nonsolid nodules, 17% nodules attached to other structures), was used for training. The second data set, containing 64 nodules (37% irregular nodules, 40% nonsolid nodules, 62% nodules attached to other structures), was used for testing. Two key techniques were developed in the segmentation algorithm: (1) a 3D extended dynamic programming model, with a newly defined internal cost function based on the information between adjacent slices, allowing parameters to be adapted to each slice, and (2) a multidirection fusion technique, which makes use of the complementary relationships among different directions to improve the final segmentation accuracy. The performance of this approach was evaluated by the overlap criterion, complemented by the true-positive fraction and the false-positive fraction criteria.
Results
The mean values of the overlap, true-positive fraction, and false-positive fraction for the first data set achieved using the segmentation scheme were 66%, 75%, and 15%, respectively, and the corresponding values for the second data set were 58%, 71%, and 22%, respectively.
Conclusion
The experimental results indicate that this segmentation scheme can achieve better performance for nodule segmentation than two existing algorithms reported in the literature. The proposed 3D extended dynamic programming model is an effective way to segment sequential images of lung nodules. The proposed multidirection fusion technique is capable of reducing segmentation errors especially for no-nodule and near-end slices, thus resulting in better overall performance.
Computed tomography is one of the most widely used medical imaging techniques for the early detection and diagnosis of lung nodules . However, computed tomographic (CT) images constitute a tremendous volume of data for radiologists to read. Thus, researchers are trying to develop computer-aided diagnosis (CAD) systems to aid radiologists in detecting and diagnosing lung nodules with higher accuracy and greatly reduced reading time .
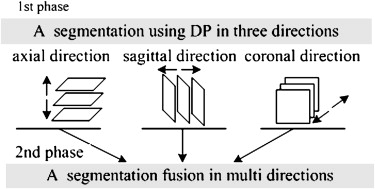
Lung nodule segmentation plays a crucial and challenging role in CAD systems for lung cancer. Because of lung nodules’ variability in size, shape, structural pattern, and degree of attachment to normal anatomic structures, the automatic segmentation of nodules is very difficult. The reported approaches can be generally classified into two categories: slice by slice and voxel by voxel. The former approach uses thresholding , clustering , graph cut , and deformable models to segment the nodules in each slice. The latter approach uses techniques such as three-dimensional (3D) region growing , thresholding , 3D deformable models , and watershed to segment nodules directly in 3D space. Voxel-by-voxel techniques often result in very high space and time complexities, which require powerful hardware platforms including fast processors, large amounts of memory, and hard drives of enormous capacity. Two-dimensional (2D) slice-by-slice techniques have much lower space and time complexities, giving such CAD systems more potential to be embedded in medical imaging equipment, such as CT scanners. Moreover, there are many well-developed 2D image-processing techniques, such as dynamic programming (DP), active contour, and so on, which can be easily implemented in slice-by-slice techniques and achieve good results on 2D images, but by and large, they are not easily transplanted to 3D voxel-by-voxel techniques with the same good results. Thus, we decided to explore a method that combines multidirection slice-by-slice segmentation results to achieve pseudo-3D segmentation.
Get Radiology Tree app to read full this article<
Materials and methods
Materials
Get Radiology Tree app to read full this article<
Get Radiology Tree app to read full this article<
Get Radiology Tree app to read full this article<
Framework of the Segmentation Algorithm
Get Radiology Tree app to read full this article<
Get Radiology Tree app to read full this article<
Single-direction Segmentation Using the DP Technique
Three-dimensional Extended DP Model for Sequential Image Segmentation
Get Radiology Tree app to read full this article<
Get Radiology Tree app to read full this article<
Get Radiology Tree app to read full this article<
Get Radiology Tree app to read full this article<
Li=min[Lmax,u×13∑i−1<t<i+1Rt],u>1, L
i
=
min
[
L
max
,
u
×
1
3
∑
i
−
1
<
t
<
i
+
1
R
t
]
,
u
1
,
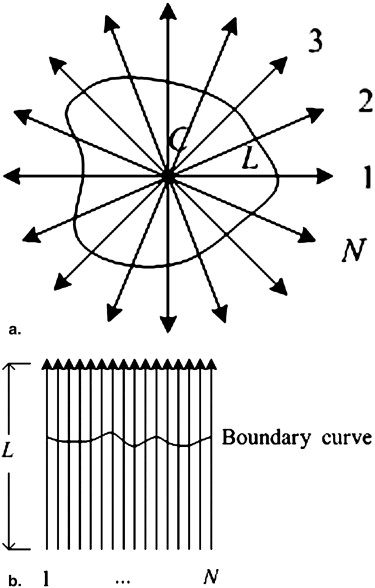
where L max is the upper limit of the length of the radial lines, u is the relaxation coefficient, and u > 1 guarantees that the radial lines cover the whole nodule region. Although R i could not be obtained accurately before segmentation, it could be estimated roughly in the pre-analysis. ∗
Get Radiology Tree app to read full this article<
For each slice,
13∑i−1<t<i+1Rt 1
3
∑
i
−
1
<
t
<
i
+
1
R
t
uses the continuity between the adjacent slices to reduce the estimated errors of R i . The number of radial lines on the i th slice, N i , is defined as
Ni=[Nmax×(13∑i−1<t<i+1Rt/Lmax)], N
i
=
[
N
max
×
(
1
3
∑
i
−
1
<
t
<
i
+
1
R
t
/
L
max
)
]
,
where N max is the upper limit number of the radial lines. The number of radial lines is directly proportional to the nodule size.
Get Radiology Tree app to read full this article<
Get Radiology Tree app to read full this article<
Get Radiology Tree app to read full this article<
Definition of Local Cost
Get Radiology Tree app to read full this article<
Ctotal=w1Cinside−slice+w2Cinterslice+w3Cext, C
total
=
w
1
C
inside
−
slice
+
w
2
C
interslice
+
w
3
C
ext
,
where C inside-slice and C interslice are the internal costs, and C ext is the external cost. The parameters w 1 , w 2 , and w 3 are the weights of the corresponding costs.
Get Radiology Tree app to read full this article<
Get Radiology Tree app to read full this article<
Cinside−slice(j,rj)=|rj−rj−1|/(rj+rj−1) C
inside−slice
(
j
,
r
j
)
=
|
r
j
−
r
j
−
1
|
/
(
r
j
+
r
j
−
1
)
where ( j , r j ) is the coordinate of the j th boundary candidate.
Get Radiology Tree app to read full this article<
Get Radiology Tree app to read full this article<
Cinterslice(j,rj)=|rj−(r’j−1)|/[rj−(r’j−1)], C
interslice
(
j
,
r
j
)
=
|
r
j
−
(
r
’
j
−
1
)
|
/
[
r
j
−
(
r
’
j
−
1
)
]
,
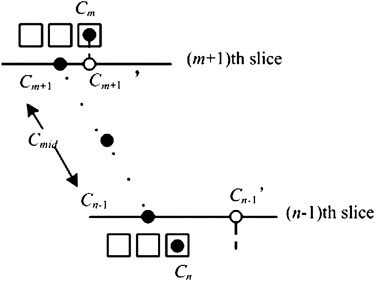
where r ′ j represents the coordinate of the boundary point in the j th column on the transformed image, T ′, of the adjacent slice. ( r ′ j − 1) is taken because of the fact that the nodule radius becomes shorter and shorter from the middle slice to the upper or lower slice.
Get Radiology Tree app to read full this article<
Get Radiology Tree app to read full this article<
Cext=(j,rj)=−grad(i,rj)maxj,rj{grad(j,rj)}, C
ext
=
(
j
,
r
j
)
=
−
grad
(
i
,
r
j
)
max
j
,
r
j
{
grad
(
j
,
r
j
)
}
,
grad(j,rj)=T(j,rj)−T(j,rj−1), grad
(
j
,
r
j
)
=
T
(
j
,
r
j
)
−
T
(
j
,
r
j
−
1
)
,
where grad is the edge gradient in the transformed image T . Because the nodule is much brighter than the background, the “boundary candidate” point should have a great positive grad value. †
Get Radiology Tree app to read full this article<
The subtraction operator ensures that a point with a greater grad value is assigned a lower external cost.
Get Radiology Tree app to read full this article<
Multidirection Fusion in Three Dimensions
Get Radiology Tree app to read full this article<
Get Radiology Tree app to read full this article<
Get Radiology Tree app to read full this article<
VOI(x,y,z)∈(cone1∪cone2)={Interior, if(x,y,z)∈(Vs∩Vc)Exterior, otherwise; VOI
(
x
,
y
,
z
)
∈
(
cone
1
∪
cone
2
)
=
{
Interior, if
(
x
,
y
,
z
)
∈
(
V
s
∩
V
c
)
Exterior, otherwise;
VOI(x,y,z)∈(cone3∪cone4)={Interior, if(x,y,z)∈(Va∩Vc)Exterior, otherwise; VOI
(
x
,
y
,
z
)
∈
(
cone
3
∪
cone
4
)
=
{
Interior, if
(
x
,
y
,
z
)
∈
(
V
a
∩
V
c
)
Exterior, otherwise;
VOI(x,y,z)∈(cone5∪cone6)={Interior, if(x,y,z)∈(Va∩Vs)Exterior, otherwise. VOI
(
x
,
y
,
z
)
∈
(
cone
5
∪
cone
6
)
=
{
Interior, if
(
x
,
y
,
z
)
∈
(
V
a
∩
V
s
)
Exterior, otherwise
.
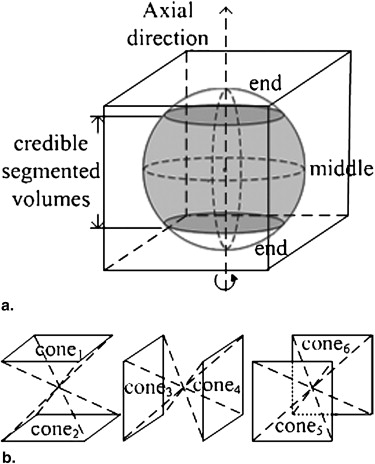
As a result, each interior nodule voxel was jointly determined by two credible segmentations in two directions, and the segmentations in the near-end and non-nodule slices in any single direction were excluded from contributing to the decisions. In this way, the accuracy of the fused multidirection segmented results were improved.
Get Radiology Tree app to read full this article<
Get Radiology Tree app to read full this article<
Segmentation Evaluation
Get Radiology Tree app to read full this article<
overlap=|Vseg∩Vgs||Vseg∪Vgs|×100%, overlap
=
|
V
seg
∩
V
gs
|
|
V
seg
∪
V
gs
|
×
100
%
,
where V seg is the 3D volume of the automatically segmented nodule, and V gs is the corresponding gold-standard volume provided by the LIDC. However, the overlap value does not provide information on whether the fraction of the segmented results actually includes or excludes the gold-standard volume. Thus, we used the true-positive fraction (TPF) and the false-positive fraction (FPF) as complementary criteria. They were defined as
TPF=|Vseg∩Vgs||Vgs|×100% TPF
=
|
V
seg
∩
V
gs
|
|
V
gs
|
×
100
%
and
FPF=|Vseg−Vgs||Vgs|×100%. FPF
=
|
V
seg
−
V
gs
|
|
V
gs
|
×
100
%
.
From the TPF and the FPF, we could evaluate the numbers of true-positive and false-positive voxels segmented by our approach using the gold-standard volume as a reference. An accurate segmentation would have a high TPF and a low FPF, which would result in a high overlap.
Get Radiology Tree app to read full this article<
Results
Results for the First LIDC Data Set
Get Radiology Tree app to read full this article<
Get Radiology Tree app to read full this article<
Get Radiology Tree app to read full this article<
and 5c, respectively. The statistics of the mean criteria of diverse types of nodules are shown in Table 1 . The means of the overlap, TPF, and FPF for all 23 nodules were 66%, 75%, and 15%, respectively.
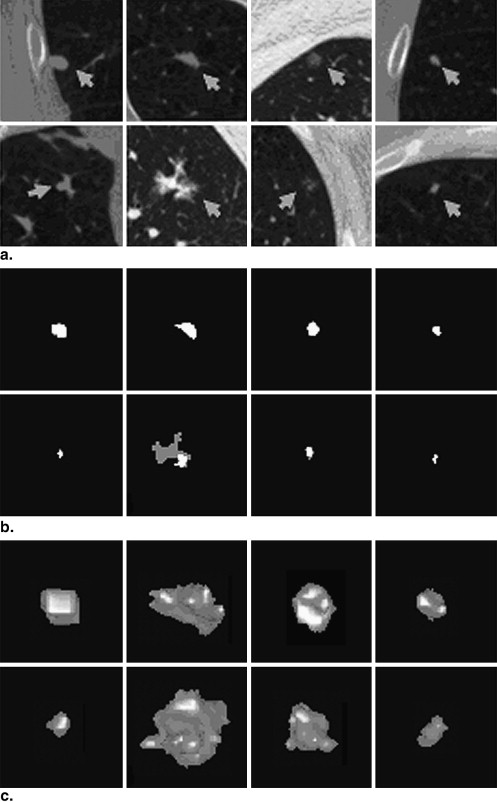
Table 1
Statistics of the Mean Criteria of Nodules in the First Lung Imaging Database Consortium Data Set
Criterion All Nodules Nonsolid Nodules Attached Nodules Irregular Nodules Small Nodules (<6 mm) Mean overlap 66% 58% 65% 64% 64% Mean TPF 75% 84% 78% 68% 74% Mean FPF 15% 45% 23% 5% 14%
FPF, false-positive fraction; TPF, true-positive fraction.
Get Radiology Tree app to read full this article<
Results for the Second LIDC Data Set
Get Radiology Tree app to read full this article<
Get Radiology Tree app to read full this article<
Comparisons with Other Methods
Get Radiology Tree app to read full this article<
Get Radiology Tree app to read full this article<
Table 2
Distributions and Means of the Criteria of Different Methods
Number of Nodules with the Overlap Value (%) in the Corresponding Sections Method 0–10 10–20 20–30 30–40 40–50 50–60 60–70 70–80 80–90 90–100 Mean Overlap (first LIDC data set) This study 0 0 0 1 0 5 9 6 1 1 66% (3)A ∗ 3 2 1 2 1 2 6 4 2 0 50% (3)B † 5 0 3 1 0 2 6 4 2 0 48% (14)A ‡ 1 2 1 2 3 4 4 4 2 0 52% 14(B) § 4 1 1 1 4 2 3 5 2 0 47% Overlap (second LIDC data set) This study 0 0 0 4 11 22 15 9 3 0 58% (3)A 8 9 6 3 9 8 12 7 2 0 43% (3)B 11 9 5 1 10 9 11 6 2 0 40% (14)A 8 3 2 10 10 12 8 9 2 0 45% 14(B) 8 7 4 8 14 7 9 6 1 0 40% TPF (first LIDC data set) This study 0 0 0 1 0 0 7 5 7 3 75% (3)A 3 2 0 2 1 2 2 1 5 5 60% (3)B 5 0 2 1 0 2 2 2 4 5 57% (14)A 1 0 0 0 2 2 2 4 4 8 76% 14(B) 3 0 1 1 3 1 3 3 4 4 60% TPF (second LIDC data set) This study 0 0 0 0 5 7 14 21 15 2 71% (3)A 8 9 5 4 5 9 8 6 4 6 47% (3)B 11 9 4 2 8 8 7 7 3 5 44% (14)A 8 3 1 7 8 6 6 2 11 12 56% 14(B) 8 6 5 7 10 3 4 10 6 5 47% FPF (first LIDC data set) This study 12 4 5 1 0 0 1 0 0 0 15% (3)A 15 2 2 0 1 0 2 0 0 1 19% (3)B 15 2 2 0 1 1 1 0 0 0 17% (14)A 10 2 0 3 1 0 0 0 1 6 94% 14(B) 14 4 0 1 0 0 1 0 0 3 56% FPF (second LIDC data set) This study 18 17 10 8 6 1 4 0 0 0 22% (3)A 47 9 4 1 2 0 0 0 0 1 8% (3)B 52 6 2 2 1 0 0 0 0 1 7% (14)A 39 10 2 2 3 1 0 0 1 6 25% 14(B) 48 6 2 2 1 1 1 0 0 3 15%
FPF, false-positive fraction; LIDC, Lung Imaging Database Consortium; TPF, true-positive fraction.
Get Radiology Tree app to read full this article<
Get Radiology Tree app to read full this article<
Get Radiology Tree app to read full this article<
Get Radiology Tree app to read full this article<
Get Radiology Tree app to read full this article<
Get Radiology Tree app to read full this article<
Discussion
Get Radiology Tree app to read full this article<
Get Radiology Tree app to read full this article<
Get Radiology Tree app to read full this article<
Get Radiology Tree app to read full this article<
Get Radiology Tree app to read full this article<
Get Radiology Tree app to read full this article<
Conclusions
Get Radiology Tree app to read full this article<
Acknowledgment
Get Radiology Tree app to read full this article<
Get Radiology Tree app to read full this article<
References
1. Claudia I.H., David F.: CT screening for lung cancer: update 2007. Oncologist 2007; 13: pp. 65-78.
2. Doi K.: Computer-aided diagnosis in medical imaging: historical review, current status and future potential. Comput Med Imag Grap 2007; 31: pp. 198-211.
3. Zhao B., Yankelevitz D.: Two-dimensional multi-criterion segmentation of lung nodules on helical CT images. Med Phys 1999; 26: pp. 889-895.
4. Gurcan M.N., Sahiner B., Petrick N., et. al.: Lung nodule detection on thoracic computed tomography images: preliminary evaluation of a computer-aided diagnosis system. Med Phys 2002; 29: pp. 2552-2558.
5. Zheng Y., Steiner K., Bauer T., et. al.: Lung nodule growth analysis from 3D CT data with a coupled segmentation and registration framework. Proc IEEE Int Conf Comput Vision 2007; pp. 1-8.
6. Aoyama M., Li Q., Katsuragawa S., et. al.: Computerized scheme for determination of the likelihood measure of malignancy for pulmonary nodules on low-dose CT images. Med Phys 2003; 30: pp. 387-394.
7. Hui Y.J., Zhen Y.C.: Segmentation of pulmonary nodules based on statistic features of wavelet coefficients and dual level sets. Proc IEEE/ICME Int Conf Complex Med Eng 2007; pp. 648-651.
8. Xu N., Ahuja N., Bansal R.: Automated lung nodule segmentation using dynamic programming and EM based classification. Proc SPIE Med Imag 2002; 4684: pp. 666-676.
9. Way T., Hadjiiski L.M., Sahiner B., et. al.: Computer-aided diagnosis of lung nodules on CT scans: segmentation and classification using 3D active contours. Med Phys 2006; 33: pp. 2323-2337.
10. Yoo Y., Shim H., Yun D., et. al.: Segmentation of ground glass opacities by asymmetric multi-phase deformable model. Proc SPIE Med Imag 2006; 6144: pp. 61440-1-61440-8.
11. Dehmeshki J., Amin H., Valdivieso M., et. al.: Segmentation of pulmonary nodules in thoracic CT scans: a region growing approach. IEEE Trans Med Imaging 2008; 27: pp. 467-480.
12. Reeves A.P., Chan A.B., Yankelevitz D.F., et. al.: On measuring the change in size of lung nodules. IEEE Trans Med Imaging 2006; 25: pp. 435-450.
13. Zhao B., Reeves A., Yankelevitz D., et. al.: Three-dimensional multi-criterion automatic segmentation of lung nodules of helical computed tomography images. Opt Eng 1999; 38: pp. 1340-1347.
14. Li Q., Li F., Doi K.: Computerized detection of lung nodules in thin-section CT images by use of selective enhancement filters and an automated rule-based classifier. Acad Radiol 2008; 15: pp. 165-175.
15. Diciotti S., Picozzi G., Falchini M., et. al.: 3-D segmentation algorithm of small lung nodules in spiral CT images. IEEE Trans Inf Technol B 2008; 12: pp. 1-19.
16. Kostis W.J., Reeves A.P., Yankelevitz D.F.: Three-dimensional segmentation and growth-rate estimation of small lung nodules in helical CT images. IEEE Trans Med Imaging 2003; 22: pp. 1259-1274.
17. Li F., Jiang Z.Q., Odry B., et. al.: Automatic segmentation of pulmonary nodules by using dynamic 3D cross-correlation for interactive CAD system. Proc SPIE Med Imag 2002; 4684: pp. 1362-1369.
18. Opfer R., Wiemker R.: A new general tumor segmentation framework based on radial basis function energy minimization with a validation study on LIDC lung nodules. Proc SPIE Med Imag 2007; 6512: pp. 651217-1-651217-10.
19. Wang J., Engelmann R., Li Q.: Segmentation of lung nodules in three-dimensional CT images by use of a spiral-scanning technique. Med Phys 2007; 34: pp. 4678-4689.
20. Kawata Y., Niki N., Ohmatsu H., et. al.: Quantitative surface characterization of lung nodules based on thin-section CT images. IEEE Trans Nucl Sci 1998; 45: pp. 2132-2138.
21. Tachibana R., Kido S.: Automatic segmentation of lung nodules on CT images by use of NCI Lung Image Database Consortium. Proc SPIE Med Imag 2006; 6144: 61440M–161440M-9
22. McNitt-Gray M.F., Armato S.G., Meyer C.R., et. al.: The Lung Image Database Consortium (LIDC) data collection process for nodule detection and annotation. Acad Radiol 2007; 14: pp. 1464-1474.