
Rationale and Objectives
We evaluated the effect of the arterial input function (AIF) on computed tomography perfusion (CTP) in patients with unilateral high-grade stenosis or occlusion in the carotid artery or middle cerebral artery without acute stroke.
Materials and Methods
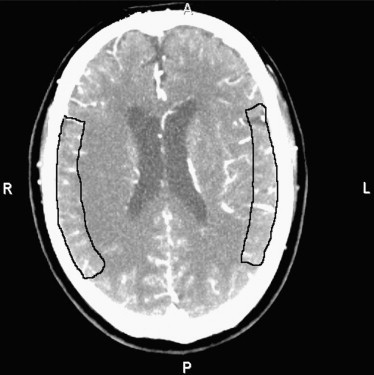
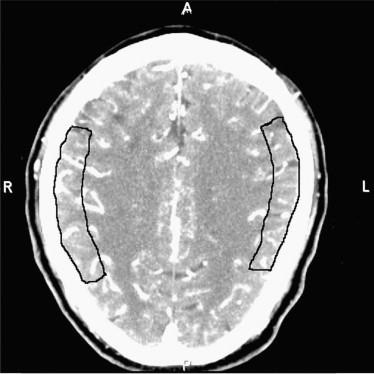
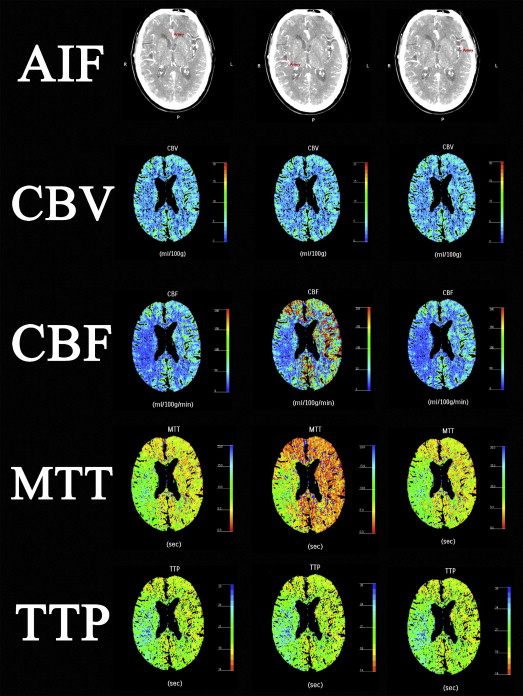
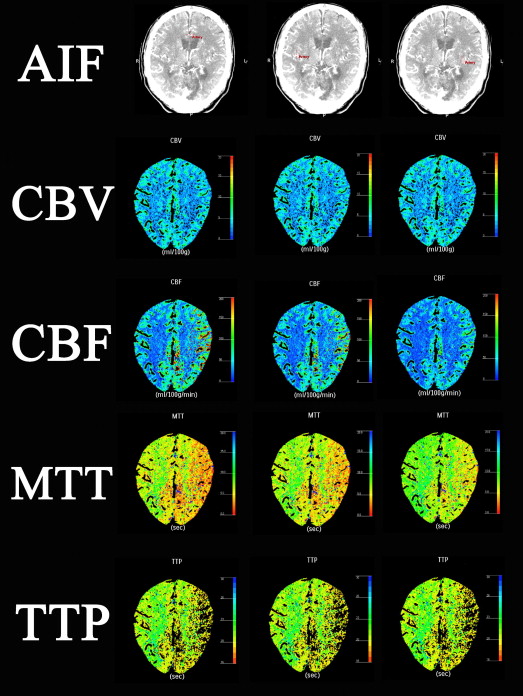
CTP datasets were retrospectively postprocessed using the same venous output function and different AIF selections: the second segment of the anterior cerebral artery (A2 AIF), the second segment of the middle cerebral artery (MCA) on the lesion side (affected M2 AIF), and M2 on the contralateral side (nonaffected M2 AIF). We measured CTP values in the region of interest (ROI) in the bilateral MCA territory and evaluated the lesion-to-contralateral ratios.
Results
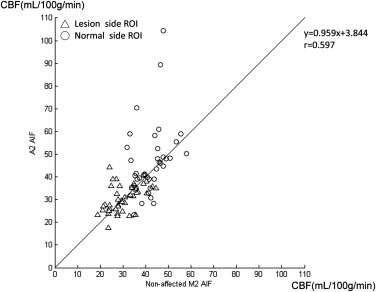
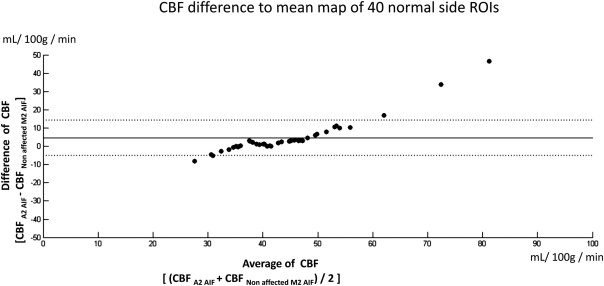
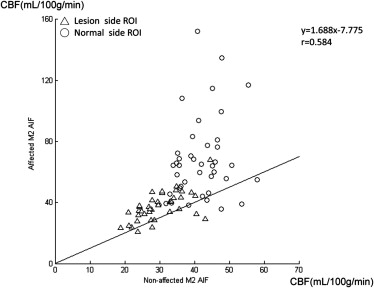
The mean and standard deviations of cerebral blood flow (CBF) on the normal side were similar to previously reported data only when using “non-affected M2 AIF.” Selecting an “affected M2 AIF” overestimated the CBF and shortened the mean transit time (MTT) in normal and lesion areas. Selecting an “A2 AIF” may cause overestimation of CBF in the normal side in patients with nonaffected-side A1 hypoplasia or occlusion. The sensitivity of the CBF ratio or MTT ratio to detect these unilateral cerebrovascular diseases was 100% using “nonaffected M2 AIF for bilateral MCA ROIs” and 70% (CBF ratio) and 90% (MTT ratio) using “respective AIF.”
Conclusion
The use of “nonaffected AIF for the bilateral MCA ROIs” was found to be the best of these AIF-ROI combinations in patients with chronic unilateral carotid or M1 severe stenosis or occlusion.
Computed tomography perfusion (CTP) has been used successfully as a functional imaging technique for patients with cerebrovascular disease. It allows rapid qualitative and quantitative evaluation of cerebral perfusion by generating maps of parameters such as cerebral blood flow (CBF), cerebral blood volume (CBV), mean transit time (MTT), and time to peak (TTP). In CTP, the first passage of a bolus of contrast agent through brain tissue is monitored. Often, quantification of CBF and MTT requires measurement of the arterial input function (AIF) . One may obtain different quantitative results when different arteries are chosen for the AIF. The AIF is optimally selected in one unaffected vessel that is perpendicular to the acquisition plane, which may be one of the anterior cerebral arteries (ACAs) or the contralateral middle cerebral artery (MCA) . Wintermark et al found that AIF selection had no significant influence on MTT and CBF values in ischemic territories in patients with a hemispheric stroke of less than 48 hours’ duration and that the ACA is an appropriate AIF for CTP processing in patients with acute stroke. Kamath et al found that the CBF value obtained with each vascular territory’s own AIF (respective AIF) on CTP correlated best with positron emission tomography (PET) CBF in patients with chronic cervical carotid artery occlusion.
The aim of this study was to evaluate the effect of different AIFs in the postprocessing of perfusion in patients with chronic high-grade unilateral arterial stenosis or occlusion without acute infarction. In addition, we examined whether the ACA and respective AIF would be appropriate for the postprocessing of perfusion data in these patients.
Materials and methods
Patients
Get Radiology Tree app to read full this article<
Table 1
Patient Demographics
No. Age Sex Disease Characteristics Site of Proper AIF 1 40 F Right ICA occlusion Left M2 2 84 M Left CCA occlusion Right A2 3 55 F Right proximal M1 occlusion Left M2 4 74 M Right ICA occlusion Left M2 5 77 M Left ICA occlusion Right A2 6 46 M Left M1 occlusion Right M2 7 66 M Right ICA occlusion Left M2 8 94 M Right ICA occlusion Left M2 9 63 M Right ICA 95% stenosis Left M2 10 80 M Right ICA occlusion Left M2 11 69 F Left ICA occlusion Right M2 12 88 M Left ICA 95% stenosis Right M2 13 80 M Right ICA 90% stenosis Left M2 14 54 M Right ICA occlusion Left M2 15 88 M Left ICA 94% stenosis Right M2 16 61 M Left ICA occlusion, right M1 <50% stenosis Right A2 17 68 F Left ICA 95% stenosis Right M2 18 84 M Left CCA occlusion, right ICA <50% stenosis Right A2 19 46 F Left ICA occlusion Right M2 20 78 M Right ICA 95% stenosis Left M2
CCA, common carotid artery; ICA, internal carotid artery; M1, first segment of the middle cerebral artery.
Get Radiology Tree app to read full this article<
Get Radiology Tree app to read full this article<
CTP Scanning Protocol
Get Radiology Tree app to read full this article<
Get Radiology Tree app to read full this article<
Data Postprocessing
Get Radiology Tree app to read full this article<
Get Radiology Tree app to read full this article<
CBV=kρ⋅∫firstpassCtissue(t)dt∫firstpassCblood(t)dt C
B
V
=
k
ρ
⋅
∫
f
i
r
s
t
p
a
s
s
C
t
i
s
s
u
e
(
t
)
d
t
∫
f
i
r
s
t
p
a
s
s
C
b
l
o
o
d
(
t
)
d
t
Get Radiology Tree app to read full this article<
Get Radiology Tree app to read full this article<
Get Radiology Tree app to read full this article<
C(t)=CBF⋅[Ca(t)⊗R(t)] C
(
t
)
=
C
B
F
⋅
[
C
a
(
t
)
⊗
R
(
t
)
]
Get Radiology Tree app to read full this article<
Get Radiology Tree app to read full this article<
MTT=∫0∞R(t)dt M
T
T
=
∫
0
∞
R
(
t
)
d
t
Get Radiology Tree app to read full this article<
Get Radiology Tree app to read full this article<
CBF=CBV/MTT CBF
=
CBV
/
MTT
Get Radiology Tree app to read full this article<
Get Radiology Tree app to read full this article<
Image Analysis
Get Radiology Tree app to read full this article<
Get Radiology Tree app to read full this article<
Get Radiology Tree app to read full this article<
Get Radiology Tree app to read full this article<
Statistical Analysis
Get Radiology Tree app to read full this article<
Results
Get Radiology Tree app to read full this article<
Table 2
Measured Perfusion Data Obtained Using Different AIFs and P Values
Parameter 1. A2 AIF 2. Nonaffected M2 AIF 3. Affected M2 AIF Mean ± SD (Min.-Max.) Mean ± SD (Min.-Max.) Mean ± SD (Min.-Max.) Lesion side CBV 4.10 ± 0.46 (3.26–5.15) 4.05 ± 0.59 (3.28–5.46)4.08 ± 0.62 (3.14–5.81) CBF 30.25 ± 5.78 (17.59–44.20) ∗ 29.85 ± 6.30 (18.78–44.55) ∗ 37.22 ± 9.18 (21.03–67.86) MTT 8.45 ± 2.15 (5.67–17.09) ∗ 8.72 ± 2.44 (5.41–17.18) ∗ 6.97 ± 2.18 (3.73–14.29) TTP 17.68 ± 2.44 (13.62–23.79) 17.36 ± 2.76 (12.72–23.65)17.31 ± 2.88 (10.72–24.36) Contralateral side (normal side) CBV 3.61 ± 0.40 (2.55–4.55)3.57 ± 0.43 (2.80–4.75) 3.63 ± 0.51 (2.63–4.77) CBF 46.35 ± 15.45 (23.39–104.40) ∗ 42.00 ± 6.45 (31.81–58.02) ∗ 68.54 ± 26.91 (35.76–152.26) MTT 4.94 ± 1.15 (4.65–6.82) ∗ 5.25 ± 0.72 (3.93–6.84) ∗ 3.52 ± 1.01 (1.03–5.41) TTP 14.75 ± 2.18 (10.64–18.51)14.50 ± 2.02 (10.86–18.48) 14.46 ± 2.04 (10.53–18.57)
Unit of CBF: mL/100 g/min; CBV: mL/100 g; MTT: second; TTP: second.
AIF, arterial input function; CBF, cerebral blood flow; CBV, cerebral blood volume; MTT, mean transit time; TTP, time to peak.
Data compatible with “respective AIF” are in bold.
All differences were significant at P < .05 by repeated-measures analysis of variance.
Get Radiology Tree app to read full this article<
Get Radiology Tree app to read full this article<
Get Radiology Tree app to read full this article<
Get Radiology Tree app to read full this article<
Get Radiology Tree app to read full this article<
Get Radiology Tree app to read full this article<
Get Radiology Tree app to read full this article<
Get Radiology Tree app to read full this article<
Table 3
Lesion-to-contralateral Ratios Obtained Using Different AIFs and P Values
Parameter 1. Respective AIF 2. Nonaffected M2 AIF 3. Affected M2 AIF Mean ± SD (Min.-Max.) Mean ± SD (Min.-Max.) Mean ± SD (Min.-Max.) CBV ratio 1.15 ± 0.12 (0.89–1.41) 1.14 ± 0.12 (0.89–1.40) 1.13 ± 0.13 (0.84–1.41) CBF ratio 0.90 ± 0.21 (0.50–1.33) ∗ 0.71 ± 0.11 (0.51–0.93) ∗ † 0.59 ± 0.18 (0.28–0.89) MTT ratio 1.37 ± 0.48 (0.82–3.41) ∗ 1.66 ± 0.34 (1.09–2.55) ∗ 2.15 ± 0.89 (1.00–4.42) TTP ratio 1.19 ± 0.11 (0.98–1.53) 1.20 ± 0.10 (1.04–1.48) 1.20 ± 0.11 (1.02–1.54)
AIF, arterial input function; CBF, cerebral blood flow; CBV, cerebral blood volume; MTT, mean transit time; TTP, time to peak.
All difference is significant at P < .05 by repeated-measures analysis of variance.
Get Radiology Tree app to read full this article<
Get Radiology Tree app to read full this article<
Get Radiology Tree app to read full this article<
Discussion
Get Radiology Tree app to read full this article<
Get Radiology Tree app to read full this article<
Get Radiology Tree app to read full this article<
Get Radiology Tree app to read full this article<
Get Radiology Tree app to read full this article<
Get Radiology Tree app to read full this article<
Get Radiology Tree app to read full this article<
Get Radiology Tree app to read full this article<
Get Radiology Tree app to read full this article<
Get Radiology Tree app to read full this article<
References
1. Hoeffner E.G., Case I., Jain R., et. al.: Cerebral perfusion CT: technique and clinical applications. Radiology 2004; 231: pp. 632-644.
2. van der Schaaf I., Vonken E.-J., Waaijer A., et. al.: Influence of partial volume on venous output and arterial input function. AJNR Am J Neuroradiol 2006; 27: pp. 46-50.
3. de Lucas E.M., Sanchez E., Gutierrez A., et. al.: CT protocol for acute stroke: tips and tricks for general radiologists. Radiographics 2008; 28: pp. 1673-1687.
4. Wintermark M., Lau B., Chien J., et. al.: The anterior cerebral artery is an appropriate arterial input function for perfusion-CT processing in patients with acute stroke. Neuroradiology 2008; 50: pp. 227-236.
5. Kamath A., Smith W., Powers W., et. al.: Perfusion CT compared to H 2 15 O/O 15 O PET in patients with chronic cervical carotid artery occlusion. Neuroradiology 2008; 50: pp. 745-751.
6. Wirestam R., Andersson L., Ostergaard L., et. al.: Assessment of regional cerebral blood flow by dynamic susceptibility contrast MRI using different deconvolution techniques. Magn Reson Med 2000; 43: pp. 691-700.
7. Kudo K., Sasaki M., Ogasawara K., et. al.: Difference in tracer delay–induced effect among deconvolution algorithms in CT perfusion analysis: quantitative evaluation with digital phantoms. Radiology 2009; 251: pp. 241-249.
8. Calamante F., Thomas D.L., Pell G.S., et. al.: Measuring cerebral blood flow using magnetic resonance imaging techniques. J Cereb Blood Flow Metab 1999; 19: pp. 701-735.
9. Meier P., Zierler K.L.: On the theory of the indicator-dilution method for measurement of blood flow and volume. J Appl Physiol 1954; 6: pp. 731-744.
10. Østergaard L., Weisskoff R.M., Chesler D.A., et. al.: High resolution measurement of cerebral blood flow using intravascular tracer bolus passages. Part I: mathematical approach and statistical analysis. Magnet Reson Med 1996; 36: pp. 715-725.
11. Nabavi D.G., Cenic A., Craen R.A., et. al.: CT Assessment of cerebral perfusion: experimental validation and initial clinical experience. Radiology 1999; 213: pp. 141-149.
12. Kudo K., Terae S., Katoh C., et. al.: Quantitative cerebral blood flow measurement with dynamic perfusion CT using the vascular-pixel elimination method: comparison with H 2 15 O positron emission tomography. AJNR Am J Neuroradiol 2003; 24: pp. 419-426.
13. Axel L.: Cerebral blood flow determination by rapid-sequence computed tomography: theoretical analysis. Radiology 1980; 137: pp. 679-686.
14. Wintermark M., Maeder P., Thiran J.P., et. al.: Quantitative assessment of regional cerebral blood flows by perfusion CT studies at low injection rates: a critical review of the underlying theoretical models. Eur Radiol 2001; 11: pp. 1220-1230.
15. Axel L.: Tissue mean transit time from dynamic computed tomography by a simple deconvolution technique. Invest Radiol 1983; 18: pp. 94-99.
16. Sanelli P.C., Lev M.H., Eastwood J.D., et. al.: The effect of varying user-selected input parameters on quantitative values in CT perfusion maps. Acad Radiol 2004; 11: pp. 1085-1092.
17. Ziegelitz D., Starck G., Mikkelsen I.K., et. al.: Absolute quantification of cerebral blood flow in neurologically normal volunteers: dynamic-susceptibility contrast MRI-perfusion compared with computed tomography (CT)-perfusion. Magnet Reson Med 2009; 62: pp. 56-65.
18. Maurer J., Maurer E., Perneczky A.: Surgically verified variations in the A 1 segment of the anterior cerebral artery. Report of two cases. J Neurosurg 1991; 75: pp. 950-953.
19. Wintermark M., Reichhart M., Cuisenaire O., et. al.: Comparison of admission perfusion computed tomography and qualitative diffusion- and perfusion-weighted magnetic resonance imaging in acute stroke patients. Stroke 2002; 33: pp. 2025-2031.
20. Derdeyn C., Powers W., Grubb R.: Hemodynamic effects of middle cerebral artery stenosis and occlusion. AJNR Am J Neuroradiol 1998; 19: pp. 1463-1469.
21. Wintermark M., Thiran J.-P., Maeder P., et. al.: Simultaneous measurement of regional cerebral blood flow by perfusion CT and stable xenon CT: a validation study. AJNR Am J Neuroradiol 2001; 22: pp. 905-914.
22. Shinohara Y., Ibaraki M., Ohmura T., et. al.: Whole-brain perfusion measurement using 320-detector row computed tomography in patients with cerebrovascular steno-occlusive disease: comparison with 15 O-positron emission tomography. J Comput Assist Tomogr 2010; 34: pp. 830-835.