
Rationale and Objectives
We sought to determine if lung densities derived from computed tomography scans could be used to identify patients with pulmonary venous hypertension (Group II pulmonary hypertension [PH]), and to compare the performance of this metric with previously described metrics.
Materials and Methods
Patients were retrospectively included from a single-center cohort of patients with aortic stenosis being evaluated for transcatheter aortic valve replacement from April 2009 to July 2014. Fifty-four patients met inclusion criteria. Thirty-three had PH (pulmonary arterial pressure [PAP] ≥25 mmHg). Thirty-two had Group II PH (pulmonary capillary wedge pressure [PCWP] ≥15 mmHg). Mean lung density (mLD) was measured from chest computed tomography scans using semi-automated techniques. Aortic diameter (mAo) and main pulmonary artery diameter (mPA) were measured manually. These metrics were correlated with PAP and PCWP values.
Results
mLD was significantly correlated with PCWP (R = 0.45, P = .0006) and significantly higher in patients with elevated PCWP ( P = .006). mPA was weakly correlated with PCWP (R = 0.28, P = .04), but not significantly different in patients with elevated PCWP. mPA/mAo was not significantly correlated with PCWP, nor was it significantly different in patients with elevated PCWP. mLD, mPA, and mPA/mAo were all significantly correlated with PAP and were significantly higher in patients with PH.
Conclusions
Of all metrics, only mLD was significantly correlated with PCWP and served to differentiate patients with elevated and normal PCWP. As such, mLD may contribute to a noninvasive biomarker of pulmonary venous hypertension.
Introduction
Pulmonary hypertension (PH) is a medical condition associated with high pressures in the pulmonary arteries. From the pulmonary arteries, blood travels through capillaries into pulmonary veins, and then into the left side of the heart from where it is pumped to the rest of the body. Causes of PH have been categorized into five groups by the World Health Organization : pulmonary arterial hypertension (Group I), PH due to left heart disease or pulmonary venous hypertension (Group II), PH due to chronic lung disease and/or hypoxia (Group III), chronic thromboembolic PH (Group IV), and PH due to unclear multifactorial mechanisms (Group V). The only cause of PH at a postcapillary level, and the most common cause of PH overall, is pulmonary venous hypertension (Group II), including diseases of the aortic and mitral valves .
The current gold standard test in the diagnosis of PH is to measure pulmonary arterial pressure (PAP) and pulmonary capillary wedge pressure (PCWP) using right heart catheterization. As an invasive procedure, the risks of right heart catheterization are low but not inconsequential—requiring proceduralist expertise. Serious complications including hematomas and arrhythmias have been reported in 1.1% of cases. Procedure-related deaths are uncommon but still occur at a rate of 0.055% .
Get Radiology Tree app to read full this article<
Get Radiology Tree app to read full this article<
Get Radiology Tree app to read full this article<
Materials and Methods
Patient Recruitment
Get Radiology Tree app to read full this article<
Get Radiology Tree app to read full this article<
Table 1
Patient Demographics
Overall PCWP <15 mmHg PCWP ≥15 mmHg Sex Male, n (%) 33(61.1%) 15(68.2%) 18(56.3%) Female, n (%) 21(38.9%) 7(31.8%) 14(43.7%) Mean age (years) 84 83 85 PAP <25 mmHg, n (%) 21(42.7%) 17(78.9%) 4(16.0%) PAP ≥25 mmHg, n (%) 33(57.3%) 5(21.1%) 28(84.0%)
PAP, pulmonary arterial pressure; PH, pulmonary hypertension; PCWP, pulmonary capillary wedge pressure; WHO, World Health Organization.
PAP ≥25 mmHg defines PH. PCWP ≥15 mmHg defines left heart disease (WHO Group II PH).
Get Radiology Tree app to read full this article<
Chest CT Scan Acquisition and Storage
Get Radiology Tree app to read full this article<
Image Analysis
Phase 1: Lung Density Measurement
Get Radiology Tree app to read full this article<
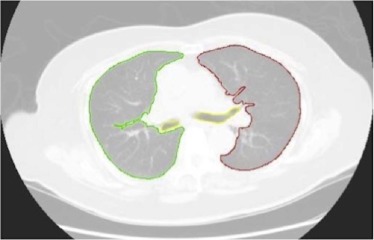
Get Radiology Tree app to read full this article<
Phase 2: Aorta and Pulmonary Diameter Measurements
Get Radiology Tree app to read full this article<
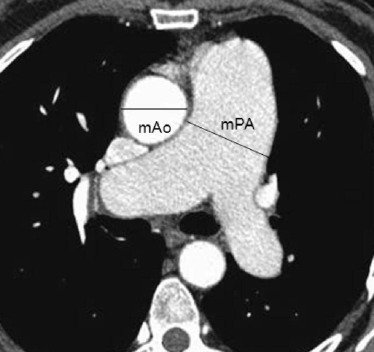
Get Radiology Tree app to read full this article<
Statistical Analysis
Get Radiology Tree app to read full this article<
Results
Objective 1: Assess the Ability of mLD in Differentiating Patients with Elevated PCWP From Those with Normal PCWP
Get Radiology Tree app to read full this article<
Table 2
mLD, mPA, and mPA/mAo Measurements Categorized by Pulmonary Arterial Pressure (PAP) and Pulmonary Capillary Wedge Pressure (PCWP)
Parameter PAP ≥25 mmHg (N = 33) PAP <25 mmHg (N = 21)P Value PCWP ≥15 mmHg (N = 32) PCWP <15 mmHg (N = 22)P Value mLD (g/mL) 0.27 + /− 0.05 0.22 + /− 0.06 .0001 0.27 + /− 0.05 0.23 + /− 0.06 .0060 mPA (cm) 3.18 + /− 0.36 2.84 + /− 0.38 .0015 3.11 + /− 0.40 2.97 + /− 0.40 .2302 mPA/mAo 0.95 + /− 0.11 0.86 + /− 0.11 .0043 0.93 + /− 0.11 0.89 + /− 0.13 .2717
CT, computed tomography; mAo, aortic diameter; mLD, mean lung density; mPA, main pulmonary artery diameter; PH, pulmonary hypertension; WHO, World Health Organization.
Both PAP and PCWP were obtained from cardiac catheterization. Lung densities, mPA, and mAo were measured from chest CT scans. PAP ≥25 mmHg defines PH. PCWP ≥15 mmHg defines left heart disease (WHO Group II PH).
Table 3
Correlations of mLD, mPA, and Ratio of mPA to mAo with Pulmonary Arterial Pressure (PAP) and Pulmonary Capillary Wedge Pressure (PCWP)
Parameter PAP
R [95% CI]P Value PCWP
R [95% CI]P Value mLD 0.48 [0.23, 0.66] .0002 0.45 [0.20, 0.64] .0006 mPA 0.39 [0.13, 0.59] .0037 0.28 [0.01, 0.51] .0417 mPA/mAo 0.31 [0.04, 0.53] .0227 0.22 [−0.05, 0.46] .1063
CI, confidence interval; CT, computed tomography; mAo, aortic diameter; mLD, mean lung density; mPA, main pulmonary artery diameter.
Both PAP and PCWP were obtained from cardiac catheterization. Lung densities, mPA, and mAo were measured from chest CT scans.
Table 4
AUC Assessing Lung Density, mPA, and mPA/mAo as Predictors of Elevated Pulmonary Arterial Pressure (PAP) and Elevated Pulmonary Capillary Wedge Pressure (PCWP)
PAP ≥25 mmHg AUC_P_ Value for Comparison mLD 0.7792 Ref mPA 0.7388 .6866 mPA/mAo 0.7150 .5348
PCWP ≥15 mmHg AUC_P_ Value for Comparison mLD 0.7053 Ref mPA 0.5760 .1834 mPA/mAo 0.5625 .1568
AUC, area under receiver operating characteristic curve; CT, computed tomography; mPA, main pulmonary artery diameter; mPA/mAo, main pulmonary artery diameter to aortic diameter ratio; PH, pulmonary hypertension; WHO, World Health Organization.
Both PAP and PCWP were obtained from cardiac catheterization. Lung densities, mPA, and mAo were measured from chest CT scans. PAP ≥25 mmHg defines PH. PCWP ≥15 mmHg defines left heart disease (WHO Group II PH).
Get Radiology Tree app to read full this article<
Get Radiology Tree app to read full this article<
Objective 2: Compare the Diagnostic Ability of mLD with mPA and mAo in the Detection of Elevated PCWP
Get Radiology Tree app to read full this article<
Get Radiology Tree app to read full this article<
Get Radiology Tree app to read full this article<
Objective 3: Compare the Diagnostic Ability of mLD, mPA, and mPA/mAo in the Detection of Elevated PAP
Get Radiology Tree app to read full this article<
Get Radiology Tree app to read full this article<
Discussion
Get Radiology Tree app to read full this article<
Get Radiology Tree app to read full this article<
Get Radiology Tree app to read full this article<
Get Radiology Tree app to read full this article<
Get Radiology Tree app to read full this article<
Get Radiology Tree app to read full this article<
Conclusions
Get Radiology Tree app to read full this article<
Acknowledgements
Get Radiology Tree app to read full this article<
Get Radiology Tree app to read full this article<
References
1. Simonneau G., Gatzoulis M.A., Adatia I., et. al.: Updated clinical classification of pulmonary hypertension. J Am Coll Cardiol 2013; 62: pp. D34-D41. 24355639 Epub 2013/12/21
2. Galiè N., Hoeper M.M., Humbert M., et. al.: Guidelines for the diagnosis and treatment of pulmonary hypertension: the Task Force for the Diagnosis and Treatment of Pulmonary Hypertension of the European Society of Cardiology (ESC) and the European Respiratory Society (ERS), endorsed by the International Society of Heart and Lung Transplantation (ISHLT). Eur Heart J 2009; 30: pp. 2493-2537.
3. Hoeper M.M., Lee S.H., Voswinckel R., et. al.: Complications of right heart catheterization procedures in patients with pulmonary hypertension in experienced centers. J Am Coll Cardiol 2006; 48: pp. 2546-2552. 17174196 Epub 2006/12/19
4. Heinrich M., Uder M., Tscholl D., et. al.: CT scan findings in chronic thromboembolic pulmonary hypertension: predictors of hemodynamic improvement after pulmonary thromboendarterectomy. Chest 2005; 127: pp. 1606-1613. 15888835 Epub 2005/05/13
5. Truong Q.A., Massaro J.M., Rogers I.S., et. al.: Reference values for normal pulmonary artery dimensions by noncontrast cardiac computed tomography: the Framingham Heart Study. Circ Cardiovasc Imaging 2012; 5: pp. 147-154. 22178898 PubMed Central PMCID: PMCPmc3275437; Epub 2011/12/20
6. Cailes J.B., du Bois R.M., Hansell D.M.: Density gradient of the lung parenchyma at computed tomographic scanning in patients with pulmonary hypertension and systemic sclerosis. Acad Radiol 1996; 3: pp. 724-730. 8883512 Epub 1996/09/01
7. Gould G.A., MacNee W., McLean A., et. al.: CT measurements of lung density in life can quantitate distal airspace enlargement–an essential defining feature of human emphysema. Am Rev Respir Dis 1988; 137: pp. 380-392. 3341629 Epub 1988/02/01
8. Yuan R., Mayo J.R., Hogg J.C., et. al.: The effects of radiation dose and CT manufacturer on measurements of lung densitometry. Chest 2007; 132: pp. 617-623. 17573501 Epub 2007/06/19
9. Hoeper M.M., Bogaard H.J., Condliffe R., et. al.: Definitions and diagnosis of pulmonary hypertension. J Am Coll Cardiol 2013; 62: pp. D42-D50. 24355641 Epub 2013/12/21
10. Drake R.E., Doursout M.F.: Pulmonary edema and elevated left atrial pressure: four hours and beyond. News Physiol Sci 2002; 17: pp. 223-226. 12433974 Epub 2002/11/16
11. Gehlbach B.K., Geppert E.: The pulmonary manifestations of left heart failure. Chest 2004; 125: pp. 669-682. 14769751 Epub 2004/02/11
12. Gould G.A., Redpath A.T., Ryan M., et. al.: Parenchymal emphysema measured by CT lung density correlates with lung function in patients with bullous disease. Eur Respir J 1993; 6: pp. 698-704. 8519381
13. Heremans A., Verschakelen J.A., Fraeyenhoven L.V., et. al.: Measurement of lung density by means of quantitative CT scanning. A study of correlations with pulmonary function tests. Chest 1992; 102: pp. 805-811.
14. Kinsella M., Muller N.L., Abboud R.T., et. al.: Quantitation of emphysema by computed tomography using a “density mask” program and correlation with pulmonary function tests. Chest 1990; 97: pp. 315-321. 2298057 Epub 1990/02/01