
Rationale and Objectives
The aims of this study were to determine interobserver variability in volume measurements of lung tumors (including part-solid and nonsolid types) using novel computer-aided diagnosis (CAD) tools and a machine learning approach and to determine the potential reasons for variability.
Materials and Methods
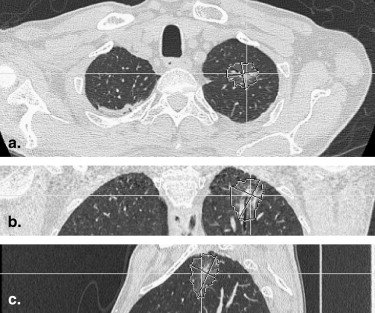
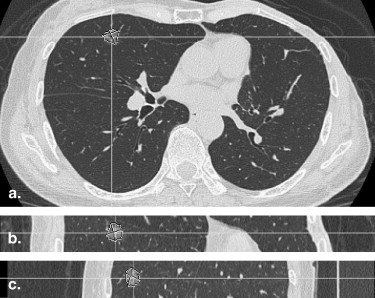
In 60 consecutive patients with peripheral lung cancer, the three-dimensional volumes of nodules were measured using the perimeter method by an experienced chest radiologist. In addition, for the same patients, maximal diameters and three-dimensional volumes were measured with and without a novel CAD tool by six observers. The coefficient of variance (CV) as index of interobserver variability was calculated. For the measurement of volume, the results of the perimeter method were compared to those of the CAD method. Furthermore, the CV was calculated for the following subgroups: nodule diameter, internal opacity, margin, spiculation, and adherence to vessels and the chest wall.
Results
There was significant interobserver variability among the six observers for manual, but not CAD, measurements of maximal diameter ( P < .001 and P = .207, respectively). Volume measured with the perimeter method by a chest radiologist was well correlated with volume measured with the aid of the CAD system by six radiologists ( r = 0.98–0.99). There was no significant difference in the CV for size, internal opacity, spiculation of nodules, or adherence to pulmonary vessels and the chest wall. The CV was significantly higher for obscure marginal nodules than for clear marginal nodules ( P < .01).
Conclusions
The novel CAD tool could be used to measure the volume of not only solid but also part-solid and nonsolid lung tumors.
Measurements of the sizes and volumes of lung tumors are useful for the assessment of staging and the results of chemotherapy or radiotherapy. On follow-up computed tomographic (CT) imaging, it is important to determine whether a pulmonary nodule has grown and, if so, how fast it has grown. The doubling time of pulmonary nodules is one of the clues used to differentiate malignant from benign nodules. Malignant solid nodules typically double in volume in <500 days .
Nodule size is usually the average diameter of a nodule on an axial CT image. The maximal diameter of a tumor determines the T category in the international TNM classification of lung cancer . Furthermore, the World Health Organization proposed uniform guidelines using two-dimensional (2D) methods for the evaluation of tumor response. The Response Evaluation Criteria in Solid Tumors are based on measurements of maximal perpendicular tumor diameters in the axial plane. However, manual measurements of the largest diameters on 2D CT imaging vary substantially between observers, and measurements using serial CT examinations may be limited in the evaluation of treatment response or assessment of doubling times . Because nodule growth or shrinkage is a three-dimensional (3D) phenomenon, direct volume calculation should be more accurate than diameter measurement .
Get Radiology Tree app to read full this article<
Get Radiology Tree app to read full this article<
Get Radiology Tree app to read full this article<
Materials and methods
Get Radiology Tree app to read full this article<
Study Group
Get Radiology Tree app to read full this article<
CT Examination
Get Radiology Tree app to read full this article<
Analysis of CT Images
Get Radiology Tree app to read full this article<
Get Radiology Tree app to read full this article<
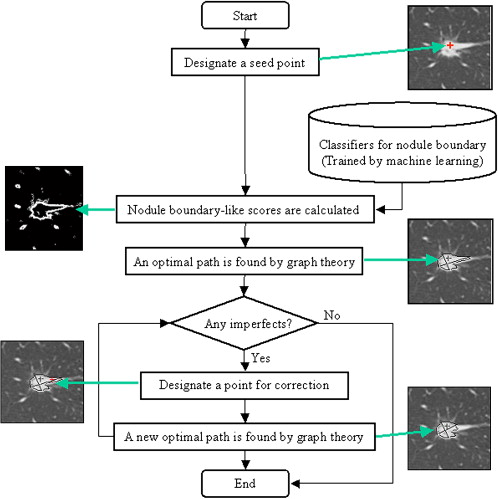
Get Radiology Tree app to read full this article<
Get Radiology Tree app to read full this article<
Get Radiology Tree app to read full this article<
Data Analysis
Get Radiology Tree app to read full this article<
Get Radiology Tree app to read full this article<
Results
Measurements of Maximal Diameter
Get Radiology Tree app to read full this article<
Measurements of 3D Volumes
Get Radiology Tree app to read full this article<
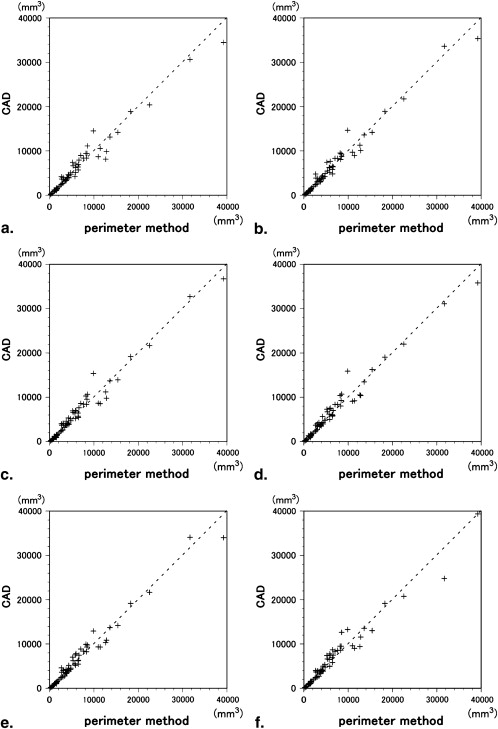
Table 1
Mean Difference and 95% Confidence Interval of Computer-Aided Diagnosis Measurements Compared to the Perimeter Method by Bland-Altman Analysis
Observer Mean Difference (mm 3 ) 95% Confidence Interval (mm 3 ) A 26 −344 to +396 B 22 −293 to +337 C 194 −138 to +526 D 210 −127 to +548 E 121 −204 to +448 F 143 −252 to +538
Table 2
Observers’ Performance Using Computer-Aided Diagnosis: Reading Time and Frequency of Correction
Observer A B C D E F Median Reading time (min) 55 38 124 81 51 50 53 Frequency of correction 0 times 25 37 23 28 38 42 32.5 1–2 times 25 13 19 16 16 12 16 >2 times 10 10 18 16 6 6 9.5
Get Radiology Tree app to read full this article<
Get Radiology Tree app to read full this article<
Table 3
Coefficient of Variance of Volume Measurement Using the Computer-Aided Diagnosis Method
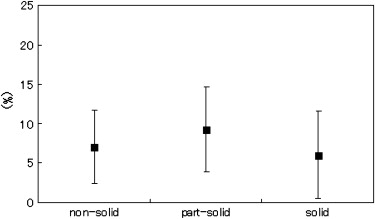
Subgroup n Mean (%) Standard Deviation (%)P Diameter (cm) ≤2 25 8.4 6.3 .133 >2 35 6.3 4.7 Internal opacity Solid 33 6.0 5.6 .080 Part solid/nonsolid 27 8.5 5.2 Margin Clear 33 5.3 4.5 .003 Obscure 27 9.4 5.8 Spiculation Present 9 7.3 7.8 .736 None 51 7.1 5.1 Adherence to vessels Present 22 6.1 4.3 .283 None 38 7.7 6.0 Adherence to chest wall Present 24 6.9 5.1 .776 None 36 7.3 5.8 Total 60 7.2 5.5
Get Radiology Tree app to read full this article<
Discussion
Get Radiology Tree app to read full this article<
Get Radiology Tree app to read full this article<
Get Radiology Tree app to read full this article<
Get Radiology Tree app to read full this article<
Get Radiology Tree app to read full this article<
Get Radiology Tree app to read full this article<
Get Radiology Tree app to read full this article<
Get Radiology Tree app to read full this article<
Get Radiology Tree app to read full this article<
Get Radiology Tree app to read full this article<
Acknowledgment
Get Radiology Tree app to read full this article<
References
1. Revel M.P., Merlin A., Peyrard S., et. al.: Software volumetric evaluation of doubling times for differentiating benign versus malignant pulmonary nodules. AJR Am J Roentgenol 2006; 187: pp. 135-142.
2. Winer-Muram H.T., Jennings S.G., Tarver R.D., et. al.: Volumetric growth rate of stage I lung cancer prior to treatment: serial CT scanning. Radiology 2002; 223: pp. 798-805.
3. Schneider B.J.: Non-small cell lung cancer staging: proposed revisions to the TNM system. Cancer Imaging 2008; 8: pp. 181-185.
4. Mountain C.F.: Revisions in the International System for Staging Lung Cancer. Chest 1997; 111: pp. 1710-1717.
5. Marten K., Auer F., Schmidt S., et. al.: Inadequacy of manual measurements compared to automated CT volumetry in assessment of treatment response of pulmonary metastases using RECIST criteria. Eur Radiol 2006; 16: pp. 781-790.
6. Revel M.P., Bissery A., Bienvenu M., et. al.: Are two-dimensional CT measurements of small noncalcified pulmonary nodules reliable?. Radiology 2004; 231: pp. 453-458.
7. Yankelevitz D.F., Reeves A.P., Kostis W.J., et. al.: Small pulmonary nodules: volumetrically determined growth rates based on CT evaluation. Radiology 2000; 217: pp. 251-256.
8. Honda O., Johkoh T., Sumikawa H., et. al.: Pulmonary nodules: 3D volumetric measurement with multidetector CT—effect of intravenous contrast medium. Radiology 2007; 245: pp. 881-887.
9. Gietema H.A., Wang Y., Xu D., et. al.: Pulmonary nodules detected at lung cancer screening: interobserver variability of semiautomated volume measurements. Radiology 2006; 241: pp. 251-257.
10. Revel M.P., Lefort C., Bissery A., et. al.: Pulmonary nodules: preliminary experience with three-dimensional evaluation. Radiology 2004; 231: pp. 459-466.
11. Wormanns D., Kohl G., Klotz E., et. al.: Volumetric measurements of pulmonary nodules at multi-row detector CT: in vivo reproducibility. Eur Radiol 2004; 14: pp. 86-92.
12. Petrou M., Quint L.E., Nan B., et. al.: Pulmonary nodule volumetric measurement variability as a function of CT slice thickness and nodule morphology. AJR Am J Roentgenol 2007; 188: pp. 306-312.
13. Goodman L.R., Gulsun M., Washington L., et. al.: Inherent variability of CT lung nodule measurements in vivo using semiautomated volumetric measurements. AJR Am J Roentgenol 2006; 186: pp. 989-994.
14. Hasegawa M., Sone S., Takashima S., et. al.: Growth rate of small lung cancers detected on mass CT screening. Br J Radiol 2000; 73: pp. 1252-1259.
15. Jang H.J., Lee K.S., Kwon O.J., et. al.: Bronchioloalveolar carcinoma: focal area of ground-glass attenuation at thin-section CT as an early sign. Radiology 1996; 199: pp. 485-488.
16. Kuriyama K., Seto M., Kasugai T., et. al.: Ground-glass opacity on thin-section CT: value in differentiating subtypes of adenocarcinoma of the lung. AJR Am J Roentgenol 1999; 173: pp. 465-469.
17. Henschke C.I., Yankelevitz D.F., Mirtcheva R., et. al.: CT screening for lung cancer: frequency and significance of part-solid and nonsolid nodules. AJR Am J Roentgenol 2002; 178: pp. 1053-1057.
18. Ko J.P., Rusinek H., Jacobs E.L., et. al.: Small pulmonary nodules: volume measurement at chest CT—phantom study. Radiology 2003; 228: pp. 864-870.
19. Li Y., Hara S., Ito W., et. al.: A machine learning approach for interactive lesion segmentation. Proc SPIE 2007; 6512: pp. 651246.
20. Bland J.M., Altman D.G.: Statistical methods for assessing agreement between two methods of clinical measurement. Lancet 1986; 1: pp. 307-310.
21. Goo J.M., Tongdee T., Tongdee R., et. al.: Volumetric measurement of synthetic lung nodules with multi-detector row CT: effect of various image reconstruction parameters and segmentation thresholds on measurement accuracy. Radiology 2005; 235: pp. 850-856.
22. Okada T., Iwano S., Naganawa S., et. al.: Computer-aided diagnosis of lung cancer: definition and detection of ground-glass opacity type of nodules in high-resolution CT. Jpn J Radiol 2009; 27: pp. 91-99.
23. Kakinuma R., Ohmatsu H., Kaneko M., et. al.: Progression of focal pure ground-glass opacity detected by low-dose helical computed tomography screening for lung cancer. J Comput Assist Tomogr 2004; 28: pp. 17-23.
24. Winer-Muram H.T., Jennings S.G., Meyer C.A., et. al.: Effect of varying CT section width on volumetric measurement of lung tumors and application of compensatory equations. Radiology 2003; 229: pp. 184-194.
25. Ko J.P., Marcus R., Bomsztyk E., et. al.: Effect of blood vessels on measurement of nodule volume in a chest phantom. Radiology 2006; 239: pp. 79-85.
26. Ravenel J.G., Leue W.M., Nietert P.J., et. al.: Pulmonary nodule volume: effects of reconstruction parameters on automated measurements—a phantom study. Radiology 2008; 247: pp. 400-408.