
Rationale and Objectives
To evaluate the diagnostic accuracy of semiautomated global quantification of left ventricular myocardial perfusion derived from stress dynamic computed tomography myocardial perfusion imaging (CTMPI) for detection of territorial perfusion deficits (PD).
Materials and Methods
Dynamic CTMPI datasets of 71 patients were analyzed using semiautomated volume-based software to calculate global myocardial blood flow (MBF), myocardial blood volume, and volume transfer constant. Optimal cutoff values to assess the diagnostic accuracy of these parameters for detection of one- to three-vessel territories with PD in comparison to visual analysis were calculated.
Results
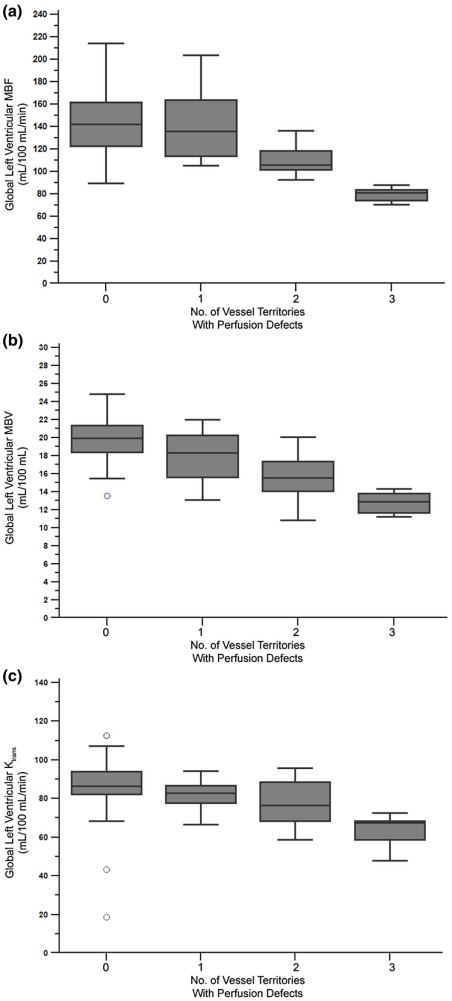
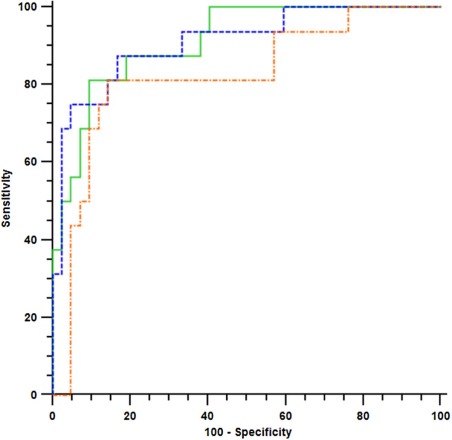
Nonsignificant differences ( P = 0.694) were found for average global MBF in patients without PD and single-territorial PD. Significant differences were found for mean global MBF in patients with PD in two ( P < 0.0058) and three territories ( P < 0.0003). Calculated optimal thresholds for global MBF and myocardial blood volume resulted in a sensitivity, specificity, and negative predictive value of 100% for detection of three-vessel territory PD. For detection of ≥2 territories with PD, global MBF was superior to other parameters (sensitivity 81.3%, specificity 90.9%, and negative predictive value 94.3%).
Conclusions
Semiautomated global quantification of left ventricular MBF during stress dynamic CTMPI shows high diagnostic accuracy for detection of ≥2 vessel territories with PD, facilitating identification of patients with multi-territorial myocardial PD.
Introduction
Stress dynamic computed tomography myocardial perfusion imaging (CTMPI) is a recently developed technique that has been shown to allow for the detection of myocardial perfusion deficits during coronary CT angiography (CCTA) . Prior studies have established the feasibility of this approach and have demonstrated its capability to accurately evaluate the hemodynamic relevance of coronary artery stenosis in comparison to cardiac magnetic resonance (CMR), nuclear myocardial perfusion imaging (MPI), and invasive coronary angiography (ICA) with or without functional flow reserve (FFR) measurements . Thus, the combination of CCTA and CTMPI may allow for the comprehensive noninvasive assessment of coronary artery disease (CAD) and hemodynamic relevance of stenosis during a single examination.
Whereas prior studies have focused on the segmental and territorial evaluation of perfusion deficits on CTMPI , recently, it was demonstrated that manual global quantitative assessment of myocardial perfusion also correlates with visual segmental analysis and presence of coronary artery stenosis . By calculating optimal cutoff values for global left ventricular myocardial blood flow (MBF) and myocardial blood volume (MBV), a recent study reported a sensitivity of 100% for both parameters for the detection of three-vessel perfusion defects . However, the diagnostic accuracy of manual or semiautomated global measurements for the detection of one- or two-vessel territories with perfusion deficits remains unknown. Furthermore, it was recently demonstrated that semiautomated segmental quantitative analysis during CTMPI using dedicated three-dimensional (3D) software is feasible and provides similar results compared to manual segmental assessment while allowing for substantial time savings and showing strong agreement with single-photon emission CT (SPECT) .
Get Radiology Tree app to read full this article<
Methods
Patient Population
Get Radiology Tree app to read full this article<
CT Image Acquisition
Get Radiology Tree app to read full this article<
Get Radiology Tree app to read full this article<
Visual Analysis of CTMPI Data
Get Radiology Tree app to read full this article<
Get Radiology Tree app to read full this article<
Get Radiology Tree app to read full this article<
Semiautomatic Analysis of CTMPI Data
Get Radiology Tree app to read full this article<
Get Radiology Tree app to read full this article<
Statistical Analysis
Get Radiology Tree app to read full this article<
Results
Patient Population
Get Radiology Tree app to read full this article<
Table 1
Baseline Characteristics and Risk Factors of Study Patients
Parameter All Patients ( n = 71) Demographic parameters Age in years, median (range) 62.2 ± 8.9 (40–82) Male gender 45 (63.4%) Cardiovascular risk factors Hypertension 43 (60.6%) Hyperlipidemia 32 (45.1%) Diabetes mellitus 24 (33.8%) Current or former smoking 29 (40.8%) Known CAD 22 (31.0%) Family history of CAD 23 (32.4%) Prior myocardial infarction 4 (5.6%) Perfusion defects on visual analysis Zero territories 42 (59.2%) One territory 13 (18.3%) Two territories 10 (14.1%) Three territories 6 (8.4%)
CAD, coronary artery disease.
Get Radiology Tree app to read full this article<
Findings at Visual Analysis of CTMPI Datasets
Get Radiology Tree app to read full this article<
Semiautomated Calculation of Global MBF, MBV, and K trans Values
Get Radiology Tree app to read full this article<
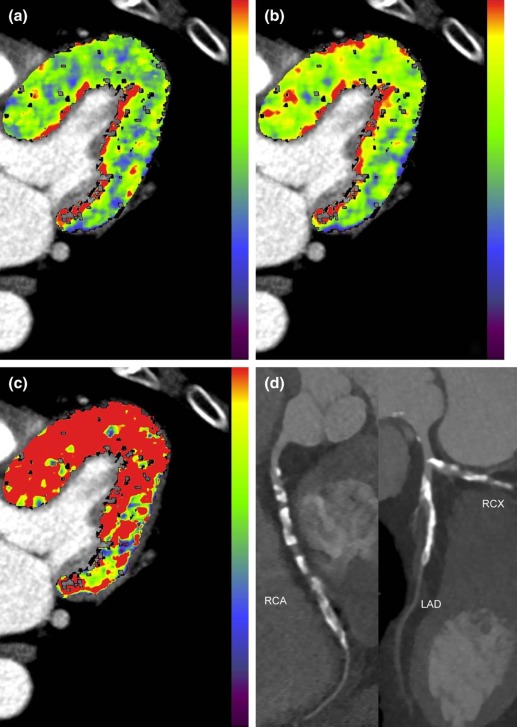
Table 2
Mean Global Quantitative Measurements of Left Ventricular Perfusion
Parameter Myocardial Blood Flow (mL/100 mL/min) Myocardial Blood Volume (mL/100 mL) Volume Transfer Constant (mL/100 mL/min) Perfusion defects at visual analysis Zero territories 144.84 ± 30.25 19.78 ± 3.70 86.33 ± 28.06 One territory 141.07 ± 36.96 17.88 ± 4.28 81.73 ± 32.61 Two territories 110.32 ± 26.88 15.55 ± 3.37 77.31 ± 28.85 Three territories 79.88 ± 21.61 12.82 ± 3.46 63.69 ± 30.93
Get Radiology Tree app to read full this article<
Get Radiology Tree app to read full this article<
Get Radiology Tree app to read full this article<
Get Radiology Tree app to read full this article<
Evaluation of Diagnostic Accuracy of Global MBF, MBV, and K trans for the Detection of Perfusion Deficits
Get Radiology Tree app to read full this article<
Get Radiology Tree app to read full this article<
Get Radiology Tree app to read full this article<
Table 3
Diagnostic Accuracy for Detection of Perfusion Deficits by Global Quantitative Measurements of Left Ventricular Perfusion
Parameter Sensitivity Specificity Positive Predictive Value (PPV) Negative Predictive Value (NPV) Detection of three territories with perfusion deficits Global myocardial blood flow (MBF): Threshold of ≤88 mL/100 mL/min 100.0% (6/6) 100% (65/65) 100% (6/6) 100% (65/65) Global myocardial blood volume (MBV): Threshold of ≤15 mL/100 mL 100.0% (6/6) 87.7% (57/65) 42.9% (6/14) 100% (57/57) Global volume transfer constant (K trans ): Threshold of ≤73 mL/100 mL/min 100.0% (6/6) 84.6% (55/65) 37.5% (6/16) 100.0% (55/55) Detection of ≥2 territories with perfusion deficits Global myocardial blood flow (MBF): Threshold of ≤109 mL/100 mL/min 81.3% (13/16) 90.9% (50/55) 72.2% (13/18) 94.3% (50/53) Global myocardial blood volume (MBV): Threshold of ≤16 mL/100 mL 75.0% (12/16) 90.9% (50/55) 70.6% (12/17) 92.6% (50/54) Global volume transfer constant (K trans ): Threshold of ≤77 mL/100 mL/min 75.0% (12/16) 87.3% (48/55) 63.2% (12/19) 92.3% (48/52) Detection of ≥1 territories with perfusion deficits Global myocardial blood flow (MBF): Threshold of ≤136 mL/100 mL/min 75.9% (22/29) 59.5% (25/42) 56.4% (22/39) 78.1% (25/32) Global myocardial blood volume (MBV): Threshold of ≤20 mL/100 mL 86.2% (25/29) 45.2% (19/42) 52.1% (25/48) 82.6% (19/23) Global volume transfer constant (K trans ): Threshold of ≤96 mL/100 mL/min 100.0% (29/29) 22.7% (10/44) 46.0% (29/63) 100.0% (10/10)
Get Radiology Tree app to read full this article<
Get Radiology Tree app to read full this article<
Discussion
Get Radiology Tree app to read full this article<
Get Radiology Tree app to read full this article<
Get Radiology Tree app to read full this article<
Get Radiology Tree app to read full this article<
Get Radiology Tree app to read full this article<
Get Radiology Tree app to read full this article<
Get Radiology Tree app to read full this article<
Get Radiology Tree app to read full this article<
Get Radiology Tree app to read full this article<
References
1. Bamberg F., Becker A., Schwarz F., et. al.: Detection of hemodynamically significant coronary artery stenosis: incremental diagnostic value of dynamic CT-based myocardial perfusion imaging. Radiology 2011; 260: pp. 689-698.
2. Bastarrika G., Ramos-Duran L., Rosenblum M.A., et. al.: Adenosine-stress dynamic myocardial CT perfusion imaging: initial clinical experience. Invest Radiol 2010; 45: pp. 306-313.
3. Bamberg F., Klotz E., Flohr T., et. al.: Dynamic myocardial stress perfusion imaging using fast dual-source CT with alternating table positions: initial experience. Eur Radiol 2010; 20: pp. 1168-1173.
4. Bastarrika G., Ramos-Duran L., Schoepf U.J., et. al.: Adenosine-stress dynamic myocardial volume perfusion imaging with second generation dual-source computed tomography: concepts and first experiences. J Cardiovasc Comput Tomogr 2010; 4: pp. 127-135.
5. Wichmann J.L., Meinel F.G., Schoepf U.J., et. al.: Absolute versus relative myocardial blood flow by dynamic CT myocardial perfusion imaging in patients with anatomic coronary artery disease. AJR Am J Roentgenol 2015; 205: pp. W67-W72.
6. Wang Y., Qin L., Shi X., et. al.: Adenosine-stress dynamic myocardial perfusion imaging with second-generation dual-source CT: comparison with conventional catheter coronary angiography and SPECT nuclear myocardial perfusion imaging. AJR Am J Roentgenol 2012; 198: pp. 521-529.
7. So A., Wisenberg G., Islam A., et. al.: Non-invasive assessment of functionally relevant coronary artery stenoses with quantitative CT perfusion: preliminary clinical experiences. Eur Radiol 2012; 22: pp. 39-50.
8. Weininger M., Schoepf U.J., Ramachandra A., et. al.: Adenosine-stress dynamic real-time myocardial perfusion CT and adenosine-stress first-pass dual-energy myocardial perfusion CT for the assessment of acute chest pain: initial results. Eur J Radiol 2012; 81: pp. 3703-3710.
9. Ko B.S., Cameron J.D., Meredith I.T., et. al.: Computed tomography stress myocardial perfusion imaging in patients considered for revascularization: a comparison with fractional flow reserve. Eur Heart J 2012; 33: pp. 67-77.
10. Rossi A., Dharampal A., Wragg A., et. al.: Diagnostic performance of hyperaemic myocardial blood flow index obtained by dynamic computed tomography: does it predict functionally significant coronary lesions?. Eur Heart J Cardiovasc Imaging 2013; 15: pp. 85-94.
11. Greif M., von Ziegler F., Bamberg F., et. al.: CT stress perfusion imaging for detection of haemodynamically relevant coronary stenosis as defined by FFR. Heart 2013; 99: pp. 1004-1011.
12. Meinel F.G., Ebersberger U., Schoepf U.J., et. al.: Global quantification of left ventricular myocardial perfusion at dynamic CT: feasibility in a multicenter patient population. AJR Am J Roentgenol 2014; 203: pp. W174-W180.
13. Ebersberger U., Marcus R.P., Schoepf U.J., et. al.: Dynamic CT myocardial perfusion imaging: performance of 3D semi-automated evaluation software. Eur Radiol 2014; 24: pp. 191-199.
14. Zheng Y., Barbu A., Georgescu B., et. al.: Four-chamber heart modeling and automatic segmentation for 3-D cardiac CT volumes using marginal space learning and steerable features. IEEE Trans Med Imaging 2008; 27: pp. 1668-1681.
15. DeLong E.R., DeLong D.M., Clarke-Pearson D.L.: Comparing the areas under two or more correlated receiver operating characteristic curves: a nonparametric approach. Biometrics 1988; 44: pp. 837-845.
16. van Werkhoven J.M., Schuijf J.D., Gaemperli O., et. al.: Prognostic value of multislice computed tomography and gated single-photon emission computed tomography in patients with suspected coronary artery disease. J Am Coll Cardiol 2009; 53: pp. 623-632.
17. Pazhenkottil A.P., Nkoulou R.N., Ghadri J.R., et. al.: Prognostic value of cardiac hybrid imaging integrating single-photon emission computed tomography with coronary computed tomography angiography. Eur Heart J 2011; 32: pp. 1465-1471.
18. Madias J.E.: Falsely negative thallium-201 scintigram associated with truly positive exercise electrocardiogram: the case of the globally balanced myocardial ischemia. Cardiology 2006; 105: pp. 22-24.