
Rationale and Objectives
To compare the relative performance of one-dimensional (1D) manual, rigid-translational, and nonrigid registration techniques to correct misalignment of lung tumor anatomy acquired from computed tomography perfusion (CTp) datasets.
Materials and Methods
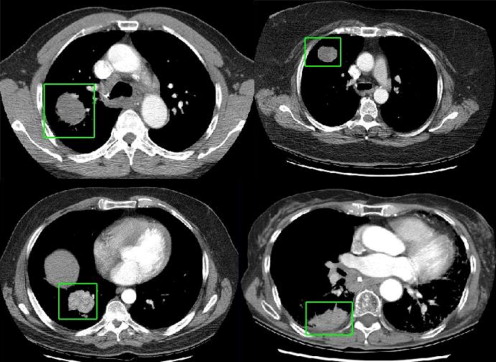
Twenty-five datasets in patients with lung tumors who had undergone a CTp protocol were evaluated. Each dataset consisted of one reference CT image from an initial cine slab and six subsequent breathhold helical volumes (16-row multi-detector CT), acquired during intravenous contrast administration. Each helical volume was registered to the reference image using two semiautomated intensity-based registration methods (rigid-translational and nonrigid), and 1D manual registration (the only registration method available in the relevant application software). The performance of each technique to align tumor regions was assessed quantitatively (percent overlap and distance of center of mass), and by a visual validation study (using a 5-point scale). The registration methods were statistically compared using linear mixed and ordinal probit regression models.
Results
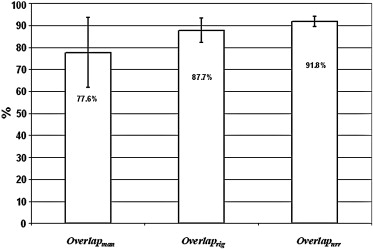
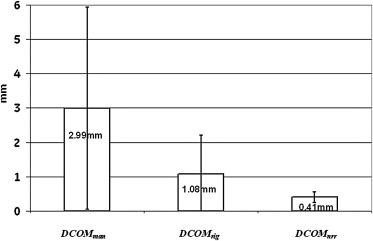
Quantitatively, tumor alignment with the nonrigid method compared to rigid-translation was borderline significant, which in turn was significantly better than the 1D manual method: average (± SD) percent overlap, 91.8 ± 2.3%, 87.7 ± 5.5%, and 77.6 ± 5.9%, respectively; and average (± SD) DCOM, 0.41 ± 0.16 mm, 1.08 ± 1.13 mm, and 2.99 ± 2.93 mm, respectively (all P < .0001). Visual validation confirmed these findings.
Conclusion
Semiautomated registration methods achieved superior alignment of lung tumors compared to the 1D manual method. This will hopefully translate into more reliable CTp analyses.
Image registration and motion correction are generic problems which impact on many areas of imaging and radiology. One specific area in which they may have a potential impact is in computed tomography perfusion (CTp).
There is increasing interest in the ability of CT to evaluate perfusion of tumors to better understand the effects of treatments and therapies on tumors . CTp is an evolving technique with potentially wide-ranging applications in oncology, including diagnosis, treatment evaluation, and prognostication . The technique relies on the acquisition of time-intensity plots from tissues of interest and vascular supply after intravenous administration of a tracer (iodinated CT contrast medium). Tissue perfusion parameters can then be derived from this information and the application of physiological modeling . Parameters that can be derived include tissue blood flow, blood volume, and permeability surface area product.
Get Radiology Tree app to read full this article<
Get Radiology Tree app to read full this article<
Get Radiology Tree app to read full this article<
Get Radiology Tree app to read full this article<
Materials and methods
Get Radiology Tree app to read full this article<
CT Scanning Technique
Get Radiology Tree app to read full this article<
Get Radiology Tree app to read full this article<
Get Radiology Tree app to read full this article<
Image Alignment
Get Radiology Tree app to read full this article<
Get Radiology Tree app to read full this article<
1D manual alignment
Get Radiology Tree app to read full this article<
Rigid-translational registration
Get Radiology Tree app to read full this article<
Get Radiology Tree app to read full this article<
Get Radiology Tree app to read full this article<
Get Radiology Tree app to read full this article<
Nonrigid registration
Get Radiology Tree app to read full this article<
Get Radiology Tree app to read full this article<
Validation Experiments
Get Radiology Tree app to read full this article<
Quantitative validation
Get Radiology Tree app to read full this article<
Get Radiology Tree app to read full this article<
Get Radiology Tree app to read full this article<
Overlap
Get Radiology Tree app to read full this article<
Overlap=A∩BA∪B⋅100 O
v
e
r
l
a
p
=
A
∩
B
A
∪
B
·
100
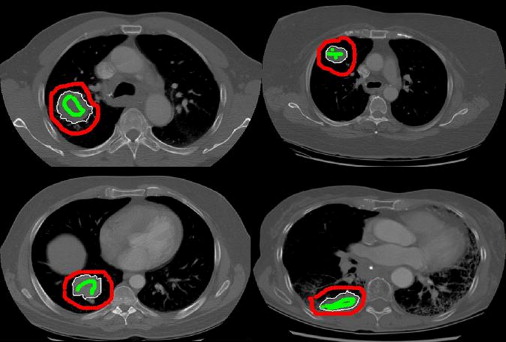
where A was the Tref volume and B was one of the Tman, Trig, or Tnrr volumes, depending on which registration technique was being compared. A∩B is the intersect of the two tumor volumes and A∪B is the union. If the location and volume of two tumor volumes are identical, the overlap will be 100%. For each motion correction technique, the average overlap for the six tumor volumes was calculated (Overlapman, Overlaprig, and Overlapnrr, respectively).
Get Radiology Tree app to read full this article<
DCOM
Get Radiology Tree app to read full this article<
Get Radiology Tree app to read full this article<
xCOM=∑ni=1xin x
C
O
M
=
∑
i
=
1
n
x
i
n
yCOM=∑ni=1yin y
COM
=
∑
i
=
1
n
y
i
n
zCOM=∑ni=1zin z
COM
=
∑
i
=
1
n
z
i
n
Where x COM , y COM , and z COM are the x, y, and z coordinates of the COM, respectively.
Get Radiology Tree app to read full this article<
Get Radiology Tree app to read full this article<
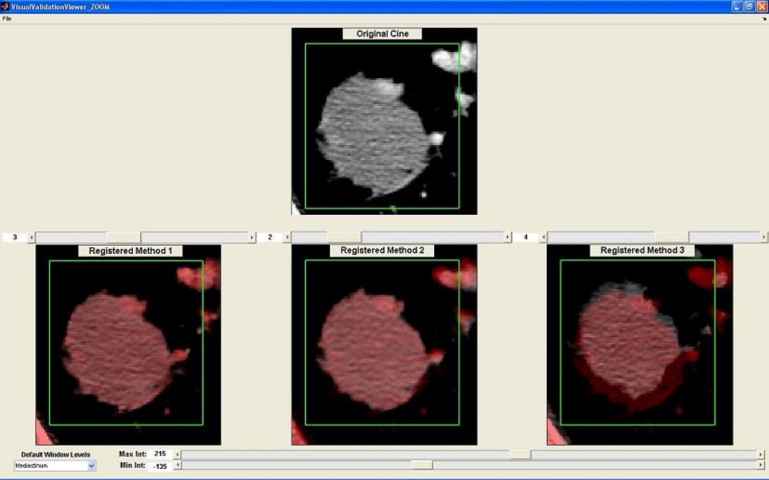
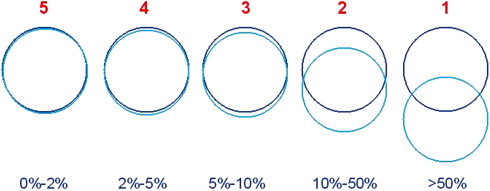
Visual validation
Get Radiology Tree app to read full this article<
Get Radiology Tree app to read full this article<
Statistical Analyses
Get Radiology Tree app to read full this article<
Logit(Overlap)=Log(Overlap(100−Overlap)) Logit
(
Overlap
)
=
L
o
g
(
O
v
e
r
l
a
p
(
100
−
O
v
e
r
l
a
p
)
)
Raw DCOM data were log-transformed before statistical analysis.
Get Radiology Tree app to read full this article<
Get Radiology Tree app to read full this article<
Get Radiology Tree app to read full this article<
Results
Get Radiology Tree app to read full this article<
Get Radiology Tree app to read full this article<
Get Radiology Tree app to read full this article<
Get Radiology Tree app to read full this article<
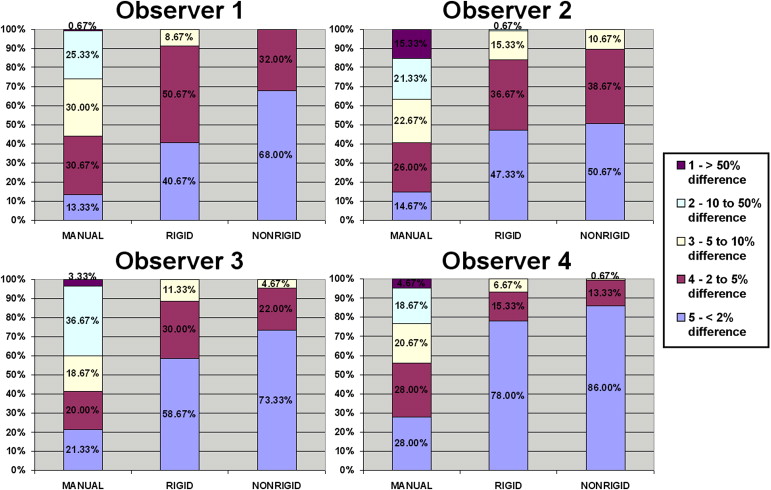
Table 1
Pairwise Comparisons between Observers and Motion Correction Techniques
Comparison Odds Ratio Standard Error 95% Confidence Limits_P_ Value Rigid vs. manual 3.76 1.27 1.94 7.28 <.0001 Nonrigid vs. manual 5.42 1.74 2.89 10.16 <.0001 Nonrigid vs. rigid 1.44 0.27 0.99 2.10 .054
Higher odds ratio (OR) means higher probability of obtaining better alignment scores (eg, rigid vs. manual has an OR of 3.76), indicating that using rigid registration increased the odds about 4 times of obtaining higher alignment scores.
Get Radiology Tree app to read full this article<
Discussion
Get Radiology Tree app to read full this article<
Get Radiology Tree app to read full this article<
Get Radiology Tree app to read full this article<
Get Radiology Tree app to read full this article<
Get Radiology Tree app to read full this article<
Get Radiology Tree app to read full this article<
Get Radiology Tree app to read full this article<
Get Radiology Tree app to read full this article<
Get Radiology Tree app to read full this article<
Get Radiology Tree app to read full this article<
References
1. Miles K.A., Charnsangavej C., Lee F.T., et. al.: Application of CT in the investigation of angiogenesis in oncology. Acad Radiol 2000; 7: pp. 840-850.
2. Kambadakone A.R., Sahani D.V.: Body perfusion CT: technique, clinical applications, and advances. Radiol Clin North Am 2009; 47: pp. 161-178.
3. Lee T.Y.: Functional CT: physiological models. Trends Biotechnol 2002; 20: pp. S3-S10.
4. Halpin S.F.S.: Brain imaging using multislice CT: a personal perspective. Br J Radiol 2004; 77: pp. S20-S26.
5. Lev M.H., Segal A.Z., Farkas J., et. al.: Utility of perfusion-weighted CT imaging in acute middle cerebral artery stroke treated with intra-arterial thrombolysis: prediction of final infarct volume and clinical outcome. Stroke 2001; 32: pp. 2021-2028.
6. Kambadakone Remesh A, Sharma A, Catalano OA, et al. Protocol modifications for the CT perfusion (CTp) of abdominal tumors: impact on radiation dose and data processing. In: Radiological Society of North America, Annual Meeting 2008 Chicago, IL, 2008; 590.
7. Hajnal J.V., Hawkes D.J., Hill D.L.G.: Medical image registration.2001.CRC PressBoca Raton, FL
8. Yang D, Goddu SM, Lu W, et al. Technical note: deformable image registration on partially matched images for radiotherapy applications. Med Phys; 37:141–145.
9. Studholme C., Hill D.L.G., Hawkes D.J.: An overlap invariant entropy measure of 3D medical image alignment. Pattern Recognition 1999; 32: pp. 71-86.
10. Hartkens T., Rueckert D., Schnabel J.A., et. al.: VTK-CISG Registration Toolkit: an open source software package for affine and non-rigid registration of single- and multimodal 3D images.Meiler D.S.Kruggel F.Handels H. et. al.Bildverarbeitung für die Medizin 2002: Algorithmen System Anwendungen.2002.Springer-verlag, BerlinLeipzig, Germany:pp. 409-412.
11. Rueckert D., Sonoda L.I., Hayes C., et. al.: Nonrigid registration using free-form deformations: application to breast MR images. IEEE Trans Med Imaging 1999; 18: pp. 712-721.
12. Liang K.-Y., Zeger S.L.: Longitudinal data analysis using generalized linear models. Biometrika 1986; 73: pp. 13-22.
13. Cao Y., Platt J.F., Francis I.R., et. al.: The prediction of radiation-induced liver dysfunction using a local dose and regional venous perfusion model. Med Phys 2007; 34: pp. 604-612.
14. Jensen N., Lock M., Kozak R., et. al.: SU-GG-I-101: 3D segmentation and rigid registration for minimizing breathing motion effects in liver CT perfusion. Med Phys 2010; 37: pp. 3124.
15. Kabus S., Klinder T., Murphy K., et. al.: Evaluation of 4D-CT lung registration. Med Image Comput Comput Assist Interv 2009; 12: pp. 747-754.
16. Rietzel E., Chen G.T.: Deformable registration of 4D computed tomography data. Med Phys 2006; 33: pp. 4423-4430.
17. McClelland J.R., Blackall J.M., Tarte S., et. al.: A continuous 4D motion model from multiple respiratory cycles for use in lung radiotherapy. Med Phys 2006; 33: pp. 3348-3358.
18. Teßmann M, Eisenacher C, Enders F, et al. GPU accelerated normalized mutual information and B-Spline transformation. In: Proceedings of the Eurographics Workshop on Visual Computing for Biomedicine (EG VCBM): Delft, The Netherlands, 2008; 117–124.