
Rationale and Objectives
To develop and evaluate a novel algorithm for semiautomated segmentation and volumetry of pleural effusions in multidetector computed tomography (MDCT) datasets.
Materials and Methods
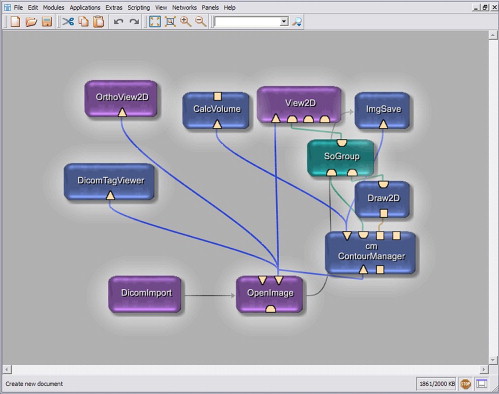
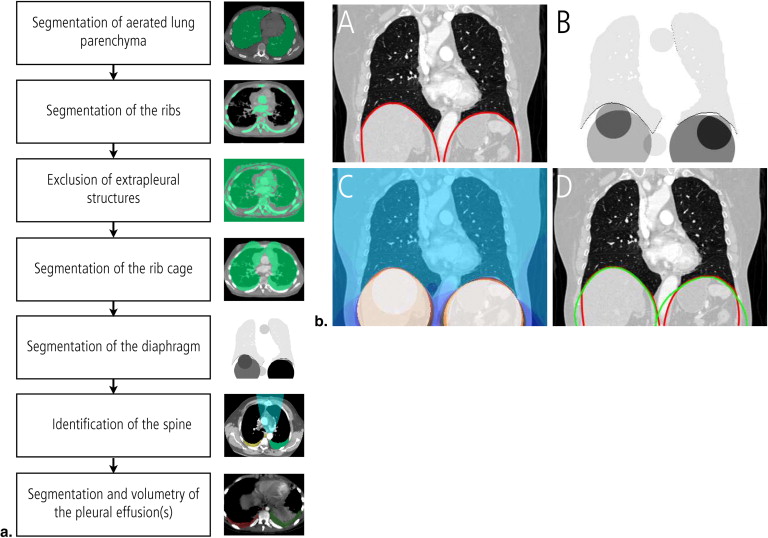
A seven-step algorithm for semiautomated segmentation of pleural effusions in MDCT datasets was developed, mainly using algorithms from the ITK image processing library. Semiautomated segmentation of pleural effusions was performed in 40 MDCT datasets of the chest (males = 22, females = 18, mean age: 56.7 ± 19.3 years). The accuracy of the semiautomated segmentation as compared with a manual segmentation approach was quantified based on the differences of the segmented volumes, the degree of over-/undersegmentation, and the Hausdorff distance. The time needed for the semiautomated and the manual segmentation process were recorded and compared.
Results
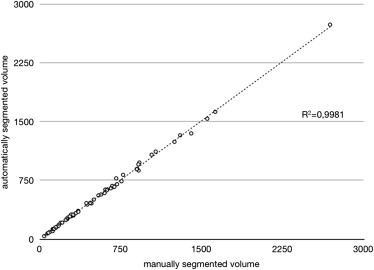
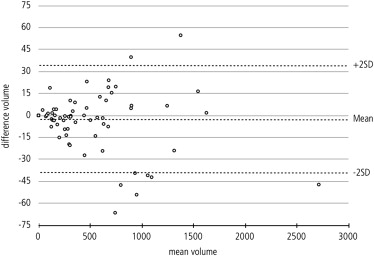
The mean volume of the pleural effusions was 557.30 mL (± 477.27 mL) for the semiautomated and 553.19 (± 473.49 mL) for the manual segmentation. The difference was not statistically significant (Student t -test, P = .133). Regression analysis confirmed a strong relationship between the semiautomated algorithm and the gold standard ( r 2 = 0.998). Mean overlap of the segmented areas was 79% (± 9.3%) over all datasets with moderate oversegmentation (22% ± 9.3%) and undersegmentation (21% ± 9.7%). The mean Hausdorff distance was 17.2 mm (± 8.35 mm). The mean duration of the semiautomated segmentation process with user interaction was 8.4 minutes (± 2.6 minutes) as compared to 32.9 minutes (± 17.4 minutes) for manual segmentation.
Conclusion
The semiautomated algorithm for segmentation and volumetry of pleural effusions in MDCT datasets shows a high diagnostic accuracy when compared with manual segmentation.
Pleural effusions are defined as an unphysiological large amount of fluid between the visceral and the parietal pleura and can be regarded as a uniform reaction of the pleura towards different stimuli . They are a common finding in routine computed tomography (CT) examinations of the chest and usually visually measured on a semiquantitative scale . Rapid and accurate quantification of pleural effusion volume from routine CT examinations is regarded as beneficial because effusion size may impact on the decision of whether to perform thoracocenteses, and possibly influence the approach used for the procedure . A simple formula has been proposed to estimate the effusion volume from CT datasets based on the greatest depth and the greatest length of the effusion . However, the precise volumetry of pleura effusions still remains challenging, especially in patients with loculated effusions. Manual segmentation on axial CT slices has been accepted as the gold standard of measurement . However, this approach is time-consuming and not compatible with the routine clinical workflow. Therefore, the purpose of our work was to develop and evaluate a novel algorithm for semiautomated segmentation and volumetry of pleural effusions in multidetector CT (MDCT) datasets, which can be readily applied to clinical routine work. As a major part of this approach, we also aimed at establishing a fast and robust algorithm for automated identification of the diaphragm, which is in important step not only in our approach for segmentation of pleural effusions but also a general prerequisite for the segmentation of thoracic or abdominal organs as part of a fully automatic whole-body morphometry.
Materials and methods
Data acquisition/Patients/Imaging Protocol
Forty multislice computed tomography (MSCT) examinations of the chest in patients with pleural effusions were randomly chosen from a university hospital’s picture archiving and communication system (PACS) archive regardless of the underlying pathology (males = 22, females = 18, mean age: 56.7 ± 19.3 years). Informed consent was obtained for the CT examination and anonymous data processing. All datasets were acquired using a 64-slice MSCT scanner (VCT, General Electric Healthcare, Chalfont St. Giles, UK) using standard parameters (tube voltage: 120 kVp, tube current: modulated [noise index = 18], gantry rotation: 0.8 seconds, collimation: 1.25 mm, reconstruction increment: 1 mm, reconstruction kernel: standard). Image data was transferred to the segmentation workstation (2x Pentium IV, 4 GB RAM, operating system: Windows XP, Microsoft, Redmond, WA) using a standard Digital Imaging and Communications in Medicine (DICOM) network.
Manual Segmentation and Quantification
Get Radiology Tree app to read full this article<
Get Radiology Tree app to read full this article<
Semiautomated Segmentation and Quantification
Get Radiology Tree app to read full this article<
Get Radiology Tree app to read full this article<
Get Radiology Tree app to read full this article<
Get Radiology Tree app to read full this article<
Get Radiology Tree app to read full this article<
Get Radiology Tree app to read full this article<
Get Radiology Tree app to read full this article<
Get Radiology Tree app to read full this article<
Get Radiology Tree app to read full this article<
Get Radiology Tree app to read full this article<
Evaluation of Segmentation Quality and Time Need
Get Radiology Tree app to read full this article<
Statistical Analysis
Get Radiology Tree app to read full this article<
Results
Total Effusion Volumes
Get Radiology Tree app to read full this article<
Get Radiology Tree app to read full this article<
Difference Metrics
Get Radiology Tree app to read full this article<
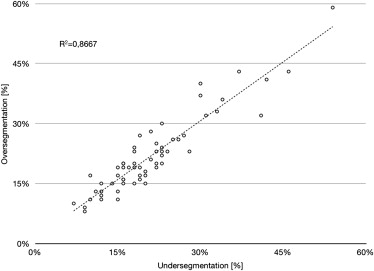
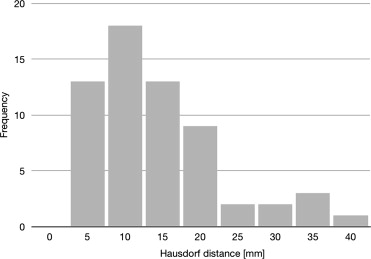
Table 1
Overview of the Image Quality Metrics
n Mean Standard Deviation Minimum Maximum Overlap 61 79% 9.3% 46% 93% Oversegmentation 61 22% 9.3% 8% 59% Undersegmentation 61 21% 9.7% 7% 54% Hausdorff distance (mm) 61 17.2 8.4 5.7 43.1
Get Radiology Tree app to read full this article<
Visual Evaluation
Get Radiology Tree app to read full this article<
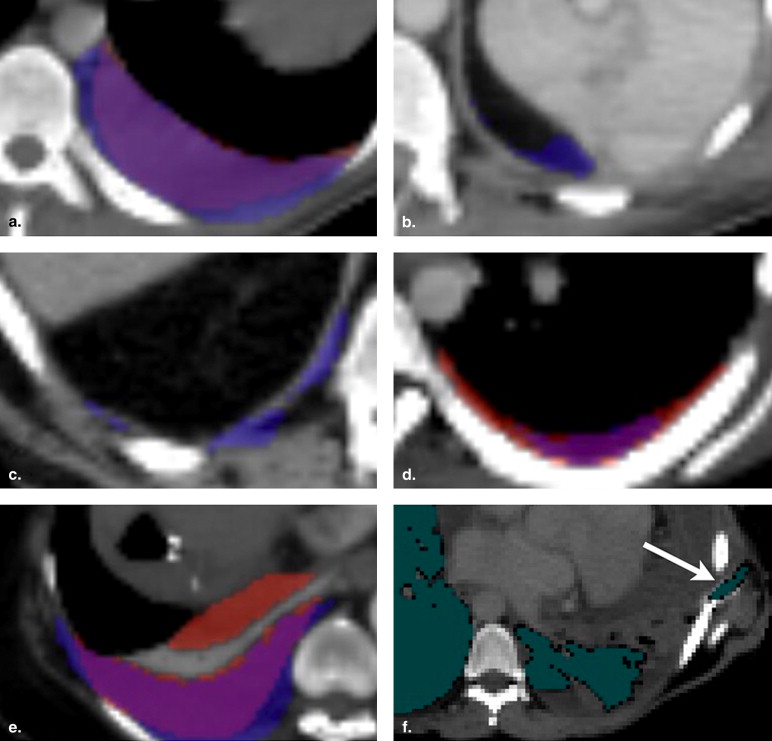
Get Radiology Tree app to read full this article<
Segmentation Time and Manual Interaction
Get Radiology Tree app to read full this article<
Get Radiology Tree app to read full this article<
Discussion
Get Radiology Tree app to read full this article<
Get Radiology Tree app to read full this article<
Get Radiology Tree app to read full this article<
Get Radiology Tree app to read full this article<
Get Radiology Tree app to read full this article<
Get Radiology Tree app to read full this article<
Conclusion
Get Radiology Tree app to read full this article<
References
1. Henschke C.I., Davis S.D., Romano P.M., et. al.: Pleural effusions: pathogenesis, radiologic evaluation, and therapy. J Thorac Imaging 1989; 4: pp. 49-60.
2. Henschke C.I., Davis S.D., Romano P.M., et. al.: The pathogenesis, radiologic evaluation, and therapy of pleural effusions. Radiol Clin North Am 1989; 27: pp. 1241-1255.
3. Noppen M.: Normal volume and cellular contents of pleural fluid. Curr Opin Pulm Med 2001; 7: pp. 180-182.
4. Noppen M., De Waele M., Li R., et. al.: Volume and cellular content of normal pleural fluid in humans examined by pleural lavage. Am J Respir Crit Care Med 2000; 162: pp. 1023-1026.
5. Zocchi L.: Physiology and pathophysiology of pleural fluid turnover. Eur Respir J 2002; 20: pp. 1545-1558.
6. Balik M., Plasil P., Waldauf P., et. al.: Ultrasound estimation of volume of pleural fluid in mechanically ventilated patients. Intensive Care Med 2006; 32: pp. 318-321.
7. Mergo P.J., Helmberger T., Didovic J., et. al.: New formula for quantification of pleural effusions from computed tomography. J Thorac Imaging 1999; 14: pp. 122-125.
8. MeVisLab: Medical Imaging Processing and Visualization Developmental Environment [computer program]. Available online at: http://www.mevislab.de . Accessed July 31, 2009.
9. Yoo T.S., Ackerman M.J., Lorensen W.E., et. al.: Engineering and algorithm design for an image processing API: a technical report on ITK—the insight toolkit.Westwood J.Proceedings of medicine meets virtual reality.2002.IOS PressAmsterdam:pp. 586-592.
10. King B, Doeker R, Meier S, et al. A Generalized Squared Euclidian Distance Transform with Voronoi Maps. The Insight Journal [serial online], January – June 2006. Available online at: http://hdl.handle.net/1926/196 . Accessed July 21, 2009.
11. Ousterhout J.: Tcl and the Tk Toolkit.1994.Addison-Wesley ProfessionalBoston, MA
12. Crum W.R., Camara O., Hill D.L.: Generalized overlap measures for evaluation and validation in medical image analysis. IEEE Trans Med Imaging 2006; 25: pp. 1451-1461.
13. McLoud T.C., Flower C.D.: Imaging the pleura: sonography, CT, and MR imaging. AJR Am J Roentgenol 1991; 156: pp. 1145-1153.
14. Blackmore C.C., Black W.C., Dallas R.V., et. al.: Pleural fluid volume estimation: a chest radiograph prediction rule. Acad Radiol 1996; 3: pp. 103-109.
15. Schmidt O., Simon S., Schmitt R., et. al.: [Volumetry of pleural effusion in multi-morbidity, postoperative patients of a surgical intensive care unit. Comparison of ultrasound diagnosis and thoracic bedside image]. Zentralbl Chir 2000; 125: pp. 375-379.
16. Yao J., Summers R.M.: Adaptive deformable model for colonic polyp segmentation and measurement on CT colonography. Med Phys 2007; 34: pp. 1655-1664.
17. Rao M., Stough J., Chi Y.Y., et. al.: Comparison of human and automatic segmentations of kidneys from CT images. Int J Radiat Oncol Biol Phys 2005; 61: pp. 954-960.
18. Jianhua Y., Wei H., Summers R.M.: Computer aided evaluation of pleural effusion using chest CT images. Biomedical Imaging: From Nano to Macro 2009; ISBI ‘09. IEEE International Symposium on Biomedical Imaging
19. Kido S., Akinori T.: Automated extraction of pleural effusion in three-dimensional thoracic CT images. Proc. SPIE 2009; 7260: pp. 72600D.
20. Qian Y., Zhang C., Yang X.: New Method for Quantification of Pleural Effusions from CT Imagine. Proc ISECS International Colloquium on Computing, Communication, Control and Management 2008; pp. 768-773.
21. Donohue R., Shearer A., Bruzzi J., et. al.: Pleural effusion segmentation in thin-slice CT. Proc SPIE 2009; 7259: pp. 72593I.
22. Banik S., Rangayyan R.M., Boag G.S.: Landmarking of computed tomographic images to assist in segmentation of abdominal tumors caused by neuroblastoma. Conf Proc IEEE Eng Med Biol Soc 2008; 2008: pp. 3126-3129.
23. Rangayyan R.M., Vu R.H., Boag G.S.: Automatic delineation of the diaphragm in computed tomographic images. J Digit Imaging 2008; 21: pp. S134-147.
24. Keatley E, Mageras G, Ling C. Computer automated diaphragm motion quantification in a fluoroscopic movie. In: Proceedings of the 22nd Annual International Conference of the IEEE Engineering in Medicine and Biology Society, Chicago, IL, 2000; 1749–1751.
25. Beichel R, Gotschuli G, Sorantin E, et al. Diaphragm dome surfacesegmentation in CT data sets: a 3D active appearance model approach. In: Proceedings of the SPIE International Symposium on Medical Imaging: Image Processing, volume 4684, San Diego, CA, 2002; 475–484.
26. Zhou X, Ninomiya H, Hara T, et al. Automated identification of diaphragm in non-contrast torso CT images and its application to computer-aided diagnosis systems. In: Proceedings of CARS 2006: 20th International Congress and Exhibition—Computer Assisted Radiology and Surgery, Osaka, Japan, 2006; 366–367.