
Rationale and Objectives
This study aimed to compare the performance of a semiautomated ventilation defect segmentation approach, adaptive K -means, with manual segmentation of hyperpolarized helium-3 magnetic resonance imaging in subjects with exercise-induced bronchoconstriction (EIB).
Materials and Methods
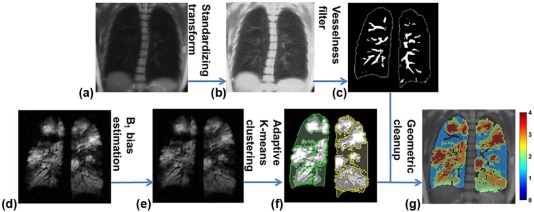
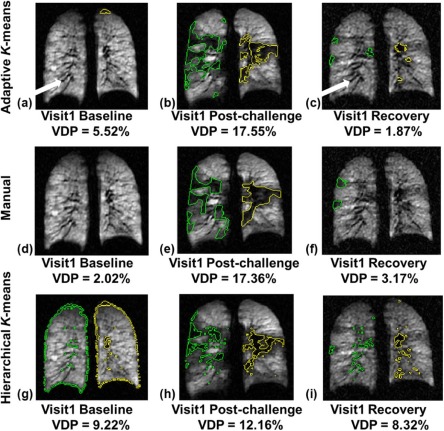
Six subjects with EIB underwent hyperpolarized helium-3 magnetic resonance imaging and spirometry tests at baseline, post exercise, and recovery over two separate visits. Ventilation defects were analyzed by two methods. First, two independent readers manually segmented ventilation defects. Second, defects were quantified by an adaptive K -means method that corrected for coil sensitivity, applied a vesselness filter to estimate pulmonary vasculature, and segmented defects adaptively based on the overall low-intensity signals in the lungs. These two methods were then compared in four aspects: (1) ventilation defect percent (VDP) measurements, (2) correlation between spirometric measures and measured VDP, (3) regional VDP variations pre- and post exercise challenge, and (4) Dice coefficient for spatial agreement.
Results
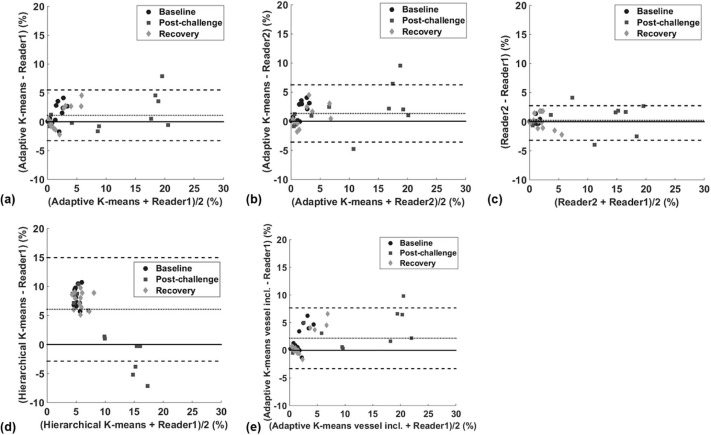
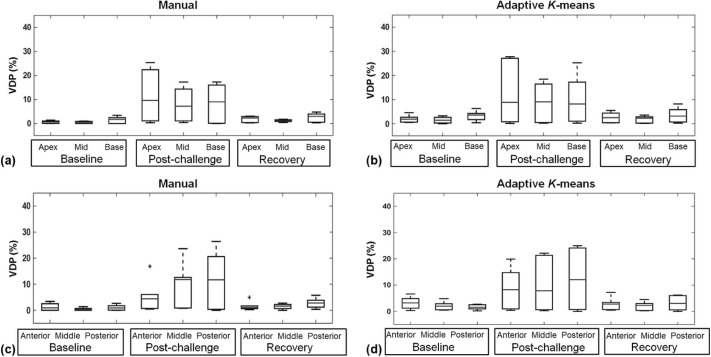
The adaptive K -means method was ~5 times faster, and the measured VDP bias was under 2%. The correlation between predicted forced expiratory volume in 1 second over forced vital capacity and VDP measured by adaptive K -means ( ρ = −0.64, P < 0.0001) and by the manual method ( ρ = −0.63, P < 0.0001) yielded almost identical 95% confidence intervals. Neither method of measuring VDP indicated apical/basal or anterior dependence in this small study cohort.
Conclusions
Compared to the manual method, the adaptive K -means method provided faster, reproducible, comparable measures of VDP in EIB and may be applied to a variety of lung diseases.
Introduction
Over the past decade, hyperpolarized helium-3 magnetic resonance imaging (HP 3 He MRI) has been used extensively in research for evaluating ventilation and defect in asthma , cystic fibrosis (CF) , and chronic obstructive pulmonary disease (COPD) . Quantitative assessment of ventilation and its regional distribution is critical to the application and advance of HP gas MRI in clinical research. The ventilation defect quantification from HP gas MRI has been advanced from subjective defect scores to semiquantitative measures and quantitative defect volume measures . The commonly used quantitative metric is ventilation defect percent (VDP) . Thedefect quantification from gas images contains two main steps: (1) lung cavity segmentation and (2) defect measurements within the lung cavity. Although the manual defect segmentation demonstrated good interreader agreement , it is tedious, time-consuming, and subjective. For automated lung cavity segmentation, Ray et al. proposed merging active contours using the properties of fluid flow to segment the lung in each slice to obtain the total lung cavity volume. Tustison et al. proposed a shape model–based lung segmentation, which requires offline preprocessing to obtain the unbiased shape template. Guo et al. proposed to co-segment the lung cavity jointly from three-dimensional (3D) proton and 3 He MRI pairs. For quantitative measures of defect from 3 He MRI within the lung cavity, Tustison et al. used Atropos to partition the lungs into ventilated and unventilated regions with optimal parameter settings. The hierarchical K -means method showed good spatial agreement relative to manual segmentation on subjects with COPD and CF and low spatial agreement on asthmatic subjects. Moreover, the histogram-based linear binning method proposed for defect quantification on 129 Xe images has not been assessed for 3 He images. Therefore, there is still a demand for a reliable, automated defect quantification method that is generally applicable for various lung conditions.
Three major confounding factors have made the defect quantification a difficult problem, especially in less-defected lungs. First, because of the inherent low-intensity presence on 3 He image, pulmonary vasculature regions are likely to be misclassified as ventilation defects in computer-aided detection. Second, the intensity inhomogeneity due to the nonuniform coil sensitivities can jeopardize the accuracy of intensity-based segmentation algorithms. Third, highly defected lungs tend to have smaller signal-intensity variations, whereas less-defected lungs tend to have more subtle signal heterogeneity requiring refined subclassification. In particular, asthmatic lungs are known to have spatially heterogeneous patterns of ventilation . This makes quantitative defect measurement, especially in mild asthma, a more challenging problem than in CF or COPD, where the ventilation defect is often persistent and focal. Therefore, a robust and reproducible defect quantification method for evaluating longitudinal progression and treatment response is of particular importance in asthma.
Get Radiology Tree app to read full this article<
Get Radiology Tree app to read full this article<
Materials and Methods
Human Subjects
Get Radiology Tree app to read full this article<
Spirometry
Get Radiology Tree app to read full this article<
3 He Polarization and Image Acquisition
Get Radiology Tree app to read full this article<
Get Radiology Tree app to read full this article<
Get Radiology Tree app to read full this article<
Overview of the Defect Segmentation Pipeline
Get Radiology Tree app to read full this article<
Get Radiology Tree app to read full this article<
Landmark-based Image Registration
Get Radiology Tree app to read full this article<
Vasculature Estimation
Get Radiology Tree app to read full this article<
Get Radiology Tree app to read full this article<
Get Radiology Tree app to read full this article<
T(x)=⎧⎩⎨⎪⎪⌈μ¯¯s+(x−μi)s1−μ¯sp1−μi⌉,⌈μ¯¯s+(x−μi)s2−μ¯sp2−μi⌉,ifp1≤x≤μiifμi≤x≤p2 T
(
x
)
=
{
⌈
μ
¯
s
+
(
x
−
μ
i
)
s
1
−
μ
¯
s
p
1
−
μ
i
⌉
,
if
p
1
≤
x
≤
μ
i
⌈
μ
¯
s
+
(
x
−
μ
i
)
s
2
−
μ
¯
s
p
2
−
μ
i
⌉
,
if
μ
i
≤
x
≤
p
2
where ⌈⌉ ⌈
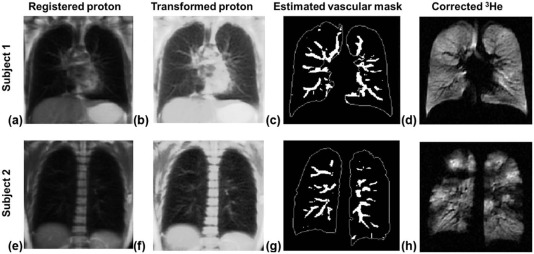
⌉ denotes the ceiling operation that rounds up to the nearest integer, p 1 and p 2 denote the minimum and maximum intensity values in the lungs, and s 1 and s 2 were chosen as 1 and 512 respectively. This transformation highlights those relatively low-intensity pixels below the µ i value. Consequently, the vascular structures on the contrast-enhanced proton images ( Fig 2b and f ) were more distinct relative to the raw proton images ( Fig 2a and e ).
Get Radiology Tree app to read full this article<
Get Radiology Tree app to read full this article<
V(RA,RB)=exp(−RA/(2α2))⋅(1−exp(−RB/(2β2))), V
(
R
A
,
R
B
)
=
exp
(
−
R
A
/
(
2
α
2
)
)
⋅
(
1
−
exp
(
−
R
B
/
(
2
β
2
)
)
)
,
where RA=(λ2/λ1)2 R
A
=
(
λ
2
/
λ
1
)
2 and RB=λ21+λ22 R
B
=
λ
1
2
+
λ
2
2 . Parameters α and β were selected as 0.5 and 15 respectively. A threshold <0.15 was applied on V ( R A , R B ) to obtain the binary vasculature mask. The estimated vasculature masks ( Fig 2c and g ) were aligned with low-intensity vascular pixels in the corresponding 3 He ( Fig 2d and h ).
Get Radiology Tree app to read full this article<
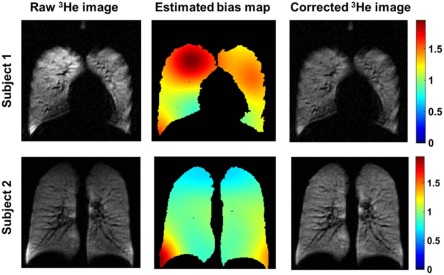
Coil Sensitivity Correction
Get Radiology Tree app to read full this article<
Get Radiology Tree app to read full this article<
Adaptive K -Means Clustering
Get Radiology Tree app to read full this article<
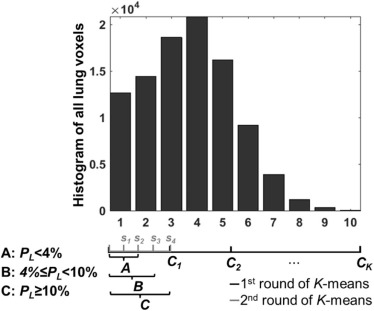
PL=Voxel count in the first binSum of all lung voxels×100%. P
L
=
Voxel count in the first bin
Sum of all lung voxels
×
100
%
.
Get Radiology Tree app to read full this article<
Get Radiology Tree app to read full this article<
Defect cluster=⎧⎩⎨⎪⎪A.First two subclusters withK=5,B.First three subclusters withK=4,C.First cluster withK=4,PL<4%4%≤PL<10%PL≥10% Defect cluster
=
{
A
.
First two subclusters with
K
=
5
,
P
L
<
4
%
B
.
First three subclusters with
K
=
4
,
4
%
≤
P
L
<
10
%
C
.
First cluster with
K
=
4
,
P
L
≥
10
%
Get Radiology Tree app to read full this article<
Get Radiology Tree app to read full this article<
Morphometric Correction of Partial Volume Effect
Get Radiology Tree app to read full this article<
Manual Segmentation
Get Radiology Tree app to read full this article<
Statistical Analysis
Get Radiology Tree app to read full this article<
Get Radiology Tree app to read full this article<
Get Radiology Tree app to read full this article<
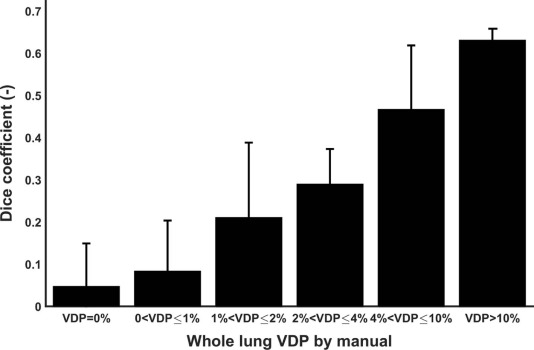
D=2⋅|S∩M||S|+|M|. D
=
2
⋅
|
S
∩
M
|
|
S
|
+
|
M
|
.
Get Radiology Tree app to read full this article<
Get Radiology Tree app to read full this article<
Results
Manual Versus Semiautomated Measurements
Get Radiology Tree app to read full this article<
Get Radiology Tree app to read full this article<
Get Radiology Tree app to read full this article<
Get Radiology Tree app to read full this article<
Get Radiology Tree app to read full this article<
Get Radiology Tree app to read full this article<
TABLE 1
Percent Change in Ventilation Defect Percent (ΔVDP) From Baseline to Post Challenge at Two Separate Visits Measured by Manual and Adaptive K -means Methods
Subject Manual Adaptive K -means ΔVDP Visit1 (%) ΔVDP Visit2 (%) ΔVDP Visit1 (%) ΔVDP Visit2 (%) 1 14.27 19.98 19.52 19.60 2 7.66 4.15 4.47 3.33 3 0.23 0.80 0.40 −0.61 4 8.57 15.34 3.58 13.20 5 0 1.02 −2.32 −2.49 6 14.69 14.45 16.85 22.06
Get Radiology Tree app to read full this article<
Get Radiology Tree app to read full this article<
TABLE 2
Average Ventilation Defect Percent for Exercise Challenge Protocol in Subjects with EIB at Each of Two Visits
Visit Manual Adaptive K- means Baseline Post Challenge Recovery Baseline Post Challenge Recovery Visit1 1.11 ± 1.12% 8.68 ± 7.41% 1.94 ± 1.47% 2.78 ± 1.63% 9.86 ± 8.21% 2.94 ± 2.67% Visit2 0.70 ± 0.81% 9.99 ± 8.97% 1.82 ± 1.36% 1.84 ± 1.50% 11.02 ± 9.77% 2.48 ± 2.90%
EIB, exercise-induced bronchoconstriction.
Values are mean ± standard deviation. Ventilation defect percent (%) was calculated as 100% × defect volumes/total lung volumes.
Get Radiology Tree app to read full this article<
Correlation to Spirometric Measures
Get Radiology Tree app to read full this article<
TABLE 3
Spearman Correlation Between Whole Lung VDP and Spirometric Measures
FEV1/FVC %P FEV1%P_ρ__P_ value 95% CI_ρ__P_ value 95% CI Manual −0.63 <0.0001 [−0.80, −0.38] −0.54 0.00071 [−0.75, −0.25] Adaptive K -means −0.64 <0.0001 [−0.83, −0.38] −0.40 0.016 [−0.66, −0.049]
CI, confidence interval; FEV1 %P, percent predicted forced expiratory volume in 1 second; FEV1/FVC %P, percent predicted FEV1 over forced vital capacity; VDP, ventilation defect percent.
A P < 0.05 was considered significantly correlated.
Get Radiology Tree app to read full this article<
Regional Variations in VDP
Get Radiology Tree app to read full this article<
Get Radiology Tree app to read full this article<
Dice Coefficient
Get Radiology Tree app to read full this article<
TABLE 4
Dice Coefficients (Mean ± Standard Deviation) for Manual and Semiautomated Segmentation
Methods Ventilation Volume Defect Volume Reader 2 – Reader 1 0.99 ± 0.015 0.56 ± 0.31 Adaptive K -means – Reader 1 0.98 ± 0.027 0.28 ± 0.24 Adaptive K -means – Reader 2 0.97 ± 0.033 0.25 ± 0.21 Hierarchical K -means – Reader 1 0.95 ± 0.013 0.16 ± 0.18 Adaptive K -means 2 – Adaptive K -means 1 1.00 ± 0.00033 0.99 ± 0.022
Get Radiology Tree app to read full this article<
Discussion
Get Radiology Tree app to read full this article<
Get Radiology Tree app to read full this article<
Get Radiology Tree app to read full this article<
Get Radiology Tree app to read full this article<
Get Radiology Tree app to read full this article<
Get Radiology Tree app to read full this article<
Get Radiology Tree app to read full this article<
Get Radiology Tree app to read full this article<
Get Radiology Tree app to read full this article<
Acknowledgments
Get Radiology Tree app to read full this article<
References
1. Fain S.B., Gonzalez-Fernandez G., Peterson E.T., et. al.: Evaluation of structure-function relationships in asthma using multidetector CT and hyperpolarized He-3 MRI. Acad Radiol 2008; 15: pp. 753-762.
2. Niles D.J., Kruger S.J., Dardzinski B.J., et. al.: Exercise-induced bronchoconstriction: reproducibility of hyperpolarized 3He MR imaging. Radiology 2013; 266: pp. 618-625.
3. de Lange E.E., Altes T.A., Patrie J.T., et. al.: Changes in regional airflow obstruction over time in the lungs of patients with asthma: evaluation with 3He MR imaging. Radiology 2009; 250: pp. 567-575.
4. Altes T.A., Powers P.L., Knight-Scott J., et. al.: Hyperpolarized 3He MR lung ventilation imaging in asthmatics: preliminary findings. J Magn Reson Imaging 2001; 13: pp. 378-384.
5. Sun Y., O’Sullivan B.P., Roche J.P., et. al.: Using hyperpolarized 3He MRI to evaluate treatment efficacy in cystic fibrosis patients. J Magn Reson Imaging 2011; 34: pp. 1206-1211.
6. Bannier E., Cieslar K., Mosbah K., et. al.: Hyperpolarized 3He MR for sensitive imaging of ventilation function and treatment efficiency in young cystic fibrosis patients with normal lung function. Radiology 2010; 255: pp. 225-232.
7. van Beek E.J.R., Hill C., Woodhouse N., et. al.: Assessment of lung disease in children with cystic fibrosis using hyperpolarized 3-Helium MRI: comparison with Shwachman score, Chrispin-Norman score and spirometry. Eur Radiol 2007; 17: pp. 1018-1024.
8. Woodhouse N., Wild J.M., Paley M.N.J., et. al.: Combined helium-3/proton magnetic resonance imaging measurement of ventilated lung volumes in smokers compared to never-smokers. J Magn Reson Imaging 2005; 21: pp. 365-369.
9. Mathew L., Kirby M., Etemad-Rezai R., et. al.: Hyperpolarized 3He magnetic resonance imaging: preliminary evaluation of phenotyping potential in chronic obstructive pulmonary disease. Eur J Radiol 2011; 79: pp. 140-146.
10. Kirby M., Heydarian M., Svenningsen S., et. al.: Hyperpolarized 3He magnetic resonance functional imaging semiautomated segmentation. Acad Radiol 2012; 19: pp. 141-152.
11. Panth S.R., Fain S.B., Holmes J.H., et. al.: Assessment of lung ventilation, gas trapping and pulmonary perfusion in patients with asthma during inhaled corticosteroid withdrawal.Proceedings of the 12th Annual Meeting of ISMRM.2004. Kyoto, Japan
12. Donnelly L.F., Macfall J.R., Mcadams H.P., et. al.: Cystic fibrosis: combined hyperpolarised 3He-enchanced and conventional proton MR imaging in the lung—preliminary observations. Radiology 1999; 212: pp. 885-889.
13. Tustison N.J., Avants B.B., Flors L., et. al.: Ventilation-based segmentation of the lungs using hyperpolarized (3)He MRI. J Magn Reson Imaging 2011; 34: pp. 831-841.
14. He M., Kaushik S.S., Robertson S.H., et. al.: Extending semiautomatic ventilation defect analysis for hyperpolarized 129Xe ventilation MRI. Acad Radiol 2014; 21: pp. 1530-1541.
15. Kruger S.J., Niles D.J., Dardzinski B., et. al.: Hyperpolarized Helium-3 MRI of exercise-induced bronchoconstriction during challenge and therapy. J Magn Reson Imaging 2014; 39: pp. 1230-1237.
16. Guo F., Yuan J., Rajchl M., et. al.: Globally optimal co-segmentation of three-dimensional pulmonary 1H and hyperpolarized 3He MRI with spatial consistence prior. Med Image Anal 2015; 23: pp. 43-55.
17. Pike D., Kirby M., Guo F., et. al.: Ventilation heterogeneity in ex-smokers without airflow limitation. Acad Radiol 2015; 22: pp. 1068-1078.
18. Ray N., Acton S.T., Altes T., et. al.: Merging parametric active contours within homogeneous image regions for MRI-based lung segmentation. IEEE Trans Med Imaging 2003; 22: pp. 189-199.
19. Frangi A.F., Member S., Niessen W.J., et. al.: Model-based quantitation of 3-D magnetic resonance angiographic images. IEEE Trans Med Imaging 1999; 18: pp. 946-956.
20. Tustison N.J., Avants B.B., Cook P.A., et. al.: N4ITK: improved N3 bias correction. IEEE Trans Med Imaging 2010; 29: pp. 1310-1320.
21. Parsons J.P., Hallstrand T.S., Mastronarde J.G., et. al.: An official American Thoracic Society clinical practice guideline: exercise-induced bronchoconstriction. Am J Respir Crit Care Med 2013; 187: pp. 1016-1027.
22. Hankinson J.L., Odencrantz J.R., Fedan K.B.: Spirometric reference values from a sample of the general U.S. population. Am J Respir Crit Care Med 1999; 159: pp. 179-187.
23. Möller H.E., Chen X.J., Saam B., et. al.: MRI of the lungs using hyperpolarized noble gases. Magn Reson Med 2002; 47: pp. 1029-1051.
24. Kirby M., Wheatley A., McCormack D.G., et. al.: Development and application of methods to quantify spatial and temporal hyperpolarized 3He MRI ventilation dynamics: preliminary results in chronic obstructive pulmonary disease. SPIE 2010; pp. 762605-762609.
25. Udupa J.K.: On standardizing the MR image intensity scale. Magn Reson Med 1999; 42: pp. 1072-1081.
26. Otsu N.: A threshold selection method from gray-level histograms. IEEE Trans Syst Man Cybern 1979; 9: pp. 62-66.
27. Bland J.M., Altman D.G.: Agreement between methods of measurement with multiple observations per individual. J Biopharm Stat 2007; 17: pp. 571-582.
28. Haukoos J.S., Lewis R.J.: Advanced statistics: bootstrapping confidence intervals for statistics with “difficult” distributions. Acad Emerg Med 2005; 12: pp. 360-365.
29. R Development Core Team : R: A language and environment for statistical computing.2012.R Foundation for Statistical ComputingVienna, Austria Available online at http://www.R-project.org/
30. Virgincar R.S., Cleveland Z.I., Kaushik S.S., et. al.: Quantitative analysis of hyperpolarized (129) Xe ventilation imaging in healthy volunteers and subjects with chronic obstructive pulmonary disease. NMR Biomed 2013; 26: pp. 425-435.
31. Avants B.B., Tustison N.J., Song G., et. al.: A reproducible evaluation of ANTs similarity metric performance in brain image registration. Neuroimage 2011; 54: pp. 2033-2044.
32. Rueckert D., Sonoda L.I., Hayes C., et. al.: Nonrigid registration using free-form deformations: application to breast MR images. IEEE Trans Med Imaging 1999; 18: pp. 712-721.