
Rationale and Objectives
The objective of this study was to develop and validate a predictive magnetic resonance imaging (MRI) activity score for ileocolonic Crohn disease activity based on both subjective and semiautomatic MRI features.
Materials and Methods
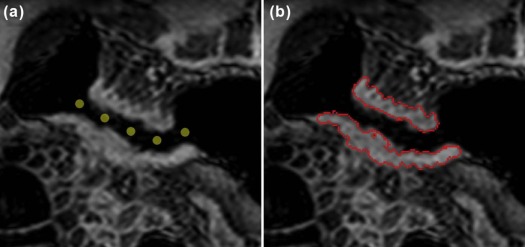
An MRI activity score (the “virtual gastrointestinal tract [VIGOR]” score) was developed from 27 validated magnetic resonance enterography datasets, including subjective radiologist observation of mural T2 signal and semiautomatic measurements of bowel wall thickness, excess volume, and dynamic contrast enhancement (initial slope of increase). A second subjective score was developed based on only radiologist observations. For validation, two observers applied both scores and three existing scores to a prospective dataset of 106 patients (59 women, median age 33) with known Crohn disease, using the endoscopic Crohn’s Disease Endoscopic Index of Severity (CDEIS) as a reference standard.
Results
The VIGOR score (17.1 × initial slope of increase + 0.2 × excess volume + 2.3 × mural T2) and other activity scores all had comparable correlation to the CDEIS scores (observer 1: r = 0.58 and 0.59, and observer 2: r = 0.34–0.40 and 0.43–0.51, respectively). The VIGOR score, however, improved interobserver agreement compared to the other activity scores (intraclass correlation coefficient = 0.81 vs 0.44–0.59). A diagnostic accuracy of 80%–81% was seen for the VIGOR score, similar to the other scores.
Conclusions
The VIGOR score achieves comparable accuracy to conventional MRI activity scores, but with significantly improved reproducibility, favoring its use for disease monitoring and therapy evaluation.
Introduction
Crohn disease (CD) is an inflammatory bowel disease, which can present throughout the gastrointestinal tract, particularly affecting the small bowel and the colon. Magnetic resonance imaging (MRI) is increasingly used for diagnosis and phenotyping of CD because it is safe, noninvasive, and has high accuracy for evaluating enteric disease and extramural complications . MRI features such as wall thickness and T1 and T2 bowel wall signals have been validated as biomarkers of CD activity, demonstrating good correlation with endoscopic and histopathologic grading of inflammation . Recent years have seen several MRI disease activity scores being developed and externally validated, combining multiple MRI features to predict overall disease activity . These scores are gradually disseminating into clinical practice, although at present, they are predominantly employed as research tools. The magnetic resonance index of activity (MaRIA), for example, has been developed using the Crohn’s Disease Endoscopic Index of Severity (CDEIS) as a reference standard. The MaRIA is based on quantitative measurement of bowel wall relative contrast enhancement, along with subjective evaluation of mural ulceration and abnormal T2 signal . Other indices, such as the London score and the Crohn disease MRI index (CDMI), rely on qualitative grading of various features by reporting radiologists . Such activity scores can be applied to individual bowel segments, as well as to the patient as a whole, as both are important to clinical management. Before MRI scores can be widely adopted for evaluating disease activity and therapeutic monitoring, high accuracy across the spectrum of disease severity and good reproducibility among radiologists must be proven. The current literature, however, reports variable reproducibility for many features used in MRI activity scores .
One potential solution to the current limitations of MRI activity scoring is to incorporate novel software solutions, which can automatically extract relevant features from MRI data. Such software could reduce both interobserver variability and the risk of observer bias inherent to subjective evaluation . New MRI image processing methods are available, which give semiautomatic measurements of bowel wall thickness, providing superior reproducibility over manual measurement . Further techniques have been developed that automatically extract perfusion parameters from motion corrected free-breathing dynamic contrast-enhanced (DCE) MRI . Although several studies have shown the potential of semiautomatic MRI assessment of CD , none of those have examined clinical practicability or validated their results using a large, independent cohort.
Get Radiology Tree app to read full this article<
Materials and Methods
Get Radiology Tree app to read full this article<
Phase 1—Model Development
Get Radiology Tree app to read full this article<
Phase 2—Prospective Activity Score Testing and Model Comparison
Get Radiology Tree app to read full this article<
Get Radiology Tree app to read full this article<
Reference Standard
Get Radiology Tree app to read full this article<
MRI Protocol
Get Radiology Tree app to read full this article<
Image Analysis
Get Radiology Tree app to read full this article<
Get Radiology Tree app to read full this article<
Semiautomatic Measurements
Get Radiology Tree app to read full this article<
Get Radiology Tree app to read full this article<
Validation of MRI Activity Scores and Statistical Analysis
Get Radiology Tree app to read full this article<
Get Radiology Tree app to read full this article<
Get Radiology Tree app to read full this article<
Get Radiology Tree app to read full this article<
Get Radiology Tree app to read full this article<
Results
Phase 1—Model Development
Get Radiology Tree app to read full this article<
VIGOR score=17.1×ISI+0.2×excess volume+2.3×mural T2 VIGOR score
=
17.1
×
ISI
+
0.2
×
excess volume
+
2.3
×
mural T
2
Subjective score=0.03×RCE+0.9×mural thickness(mm)+3×mural T2 Subjective score
=
0.03
×
RCE
+
0.9
×
mural thickness
(
mm
)
+
3
×
mural T
2
Get Radiology Tree app to read full this article<
Get Radiology Tree app to read full this article<
Phase 2—Prospective Activity Score Testing and Comparison
Get Radiology Tree app to read full this article<
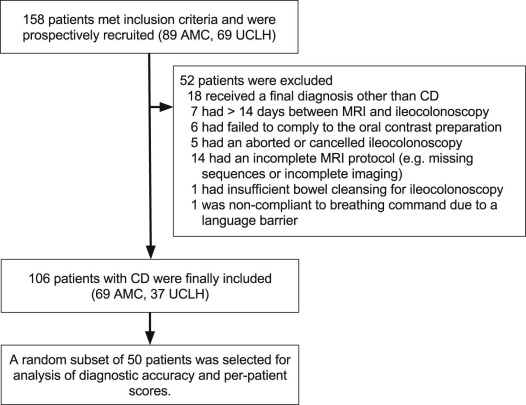
Table 1
Clinical Characteristics of the Prospective Cohort
Total no. of patients 106 Female, n (%) 59 (56) Age at MRI (y), median (IQR) 33 (26–44) Previous surgery, n (%) 42 (40) Concomitant treatments Anti-TNF antibodies, n (%) 30 (28) Steroids, n (%) 18 (17) Thiopurines, n (%) 14 (13) 5-ASA, n (%) 19 (18) Methotrexate, n (%) 8 (8) CRP (mg/L), median (IQR) 5 (1–13) HBI value, median (IQR) 5 (2–8) CDEIS score, median (IQR) 3.2 (0.5–6.4) Montreal classification Age at diagnosis (y), median (IQR) 22 (17–28) Disease location L1 ileal, n (%) 43 (41) L2 colonic, n (%) 15 (14) L3 ileocolonic, n (%) 48 (45) L4 upper GI tract involvement, n (%) 4 (4) Disease behavior B1 inflammatory 54 (51) B2 stricturing 36 (34) B3 penetrating 16 (15) Perianal involvement, n (%) 23 (22)
5-ASA, 5-acetylsalicylic acid; CDEIS, Crohn’s Disease Endoscopic Index of Severity; CRP, C-reactive protein; GI, gastrointestinal; HBI, Harvey-Bradshaw Index; IQR, interquartile range; MRI, magnetic resonance imaging; TNF, tumor necrosis factor.
Get Radiology Tree app to read full this article<
Get Radiology Tree app to read full this article<
Get Radiology Tree app to read full this article<
Table 2
Segment Inclusions and Exclusions
Active Segments Subset ( n = 50), All Segments Subset ( n = 50), Rectum Excluded Ob1 Ob2 Ob1 Ob2 Ob1 Ob2 Total no. of segments \* 88 95 230 229 186 187 Inclusions (%) 73 (83) 69 (73) 167 (73) 161 (70) 161 (87) 153 (82) Terminal ileum 54 49 39 41 39 41 Ascending colon 9 9 44 41 44 41 Transverse colon 4 2 39 38 39 38 Descending/sigmoid colon 6 9 39 33 39 33 Rectum 0 0 6 8 — — Exclusions (%) 15 (17) 26 (27) 63 (27) 68 (30) 25 (13) 34 (18) Outside DCE 3 7 42 40 12 13 Failed DCE registration 7 7 1 1 1 1 Fecal residue 3 1 6 6 2 2 Poor distension 0 2 6 6 3 3 Artifacts 0 2 0 1 0 1 Failed segmentation 2 7 8 14 7 14
DCE, dynamic contrast enhanced; Ob1, observer 1; Ob2, observer 2.
Get Radiology Tree app to read full this article<
Get Radiology Tree app to read full this article<
Model Validation and Comparison
Get Radiology Tree app to read full this article<
Table 3
Correlations Between MRI Activity Scores and Crohn’s Disease Endoscopic Index of Severity (CDEIS) and Interobserver Agreement in the Active Segments of the Full Prospective Cohort
Observer 1
( n = 73) Observer 2
( n = 69) Interobserver Agreement
( n = 56) MRI Features_r__P_ Value_r__P_ Value ICC (95% CI) VIGOR score 0.58 <.001 0.59 <.001 0.81 (0.56–0.91) Subjective score 0.39 .001 0.51 <.001 0.44 (0.21–0.63) MaRIA 0.40 .001 0.43 <.001 0.44 (0.21–0.63) London score 0.38 .001 0.45 <.001 0.47 (0.24–0.65) CDMI 0.34 .003 0.48 <.001 0.59 (0.40–0.74)
CDMI, Crohn disease MRI index; CI, confidence interval; ICC, intraclass correlation coefficient; MaRIA, magnetic resonance index of activity; MRI, magnetic resonance imaging; VIGOR, virtual gastrointestinal tract.
Get Radiology Tree app to read full this article<
Get Radiology Tree app to read full this article<
Table 4
Interobserver Agreement for Segmental Scores of the 50-Patient Subset in Active Segments and in All Segments
Active ( n = 43) All ( n = 146) MRI Features ICC (95% CI) ICC (95% CI) Nonparametric ICC (Rothery) VIGOR score 0.70 (0.51–0.82) 0.87 (0.83–0.91) 0.89 Subjective score 0.44 (0.16–0.65) 0.77 (0.69–0.83) 0.53 MaRIA 0.45 (0.18–0.66) 0.77 (0.69–0.83) 0.33 London score 0.44 (0.16–0.65) 0.81 (0.75–0.86) 0.53 CDMI 0.55 (0.30–0.73) 0.86 (0.81–0.90) 0.56
CDMI, Crohn disease MRI index; CI, confidence interval; ICC, intraclass correlation coefficient; MaRIA, magnetic resonance index of activity; MRI, magnetic resonance imaging; VIGOR, virtual gastrointestinal tract.
Original ICC values are shown for both groups, whereas the nonparametric ICC is shown for all segments to account for the skewed distribution in this dataset.
Get Radiology Tree app to read full this article<
Diagnostic Accuracy
Get Radiology Tree app to read full this article<
Table 5
Diagnostic Accuracy for Segmental Magnetic Resonance Imaging Activity Scores for Detection of Active Disease (Crohn’s Disease Endoscopic Index [CDEIS] ≥ 3)
Observer 1 Observer 2 Sensitivity (%) Specificity (%) PPV (%) NPV (%) Accuracy (%) Sensitivity (%) Specificity (%) PPV (%) NPV (%) Accuracy (%) VIGOR score 76 84 63 90 81 74 82 58 90 80 Subjective score 78 67 47 89 70 74 82 58 90 80 MaRIA 67 86 64 88 81 64 91 71 88 84 London score 60 96 84 87 86 57 94 77 86 84 CDMI 60 92 73 86 83 62 91 72 87 83
CDMI, Crohn disease MRI index; MaRIA, magnetic resonance index of activity; NPV, negative predictive value; PPV, positive predictive value; VIGOR, virtual gastrointestinal tract.
Get Radiology Tree app to read full this article<
Get Radiology Tree app to read full this article<
Discussion
Get Radiology Tree app to read full this article<
Get Radiology Tree app to read full this article<
Get Radiology Tree app to read full this article<
Get Radiology Tree app to read full this article<
Get Radiology Tree app to read full this article<
Get Radiology Tree app to read full this article<
Get Radiology Tree app to read full this article<
Get Radiology Tree app to read full this article<
Acknowledgments
Get Radiology Tree app to read full this article<
Supplementary Data
Get Radiology Tree app to read full this article<
Appendix S1
Get Radiology Tree app to read full this article<
Get Radiology Tree app to read full this article<
Get Radiology Tree app to read full this article<
Get Radiology Tree app to read full this article<
References
1. Panes J., Bouhnik Y., Reinisch W., et. al.: Imaging techniques for assessment of inflammatory bowel disease: joint ECCO and ESGAR evidence-based consensus guidelines. J Crohns Colitis 2013; 7: pp. 556-585. http://dx.doi.org/10.1016/j.crohns.2013.02.020
2. Zappa M., Stefanescu C., Cazals-Hatem D., et. al.: Which magnetic resonance imaging findings accurately evaluate inflammation in small bowel Crohn’s disease? A retrospective comparison with surgical pathologic analysis. Inflamm Bowel Dis 2011; 17: pp. 984-993.
3. Rimola J., Rodriguez S., Garcia-Bosch O., et. al.: Magnetic resonance for assessment of disease activity and severity in ileocolonic Crohn’s disease. Gut 2009; 58: pp. 1113-1120.
4. Steward M.J., Punwani S., Proctor I., et. al.: Non-perforating small bowel Crohn’s disease assessed by MRI enterography: Derivation and histopathological validation of an MR-based activity index. Eur J Radiol 2012; 81: pp. 2080-2088.
5. Rimola J., Ordás I., Rodriguez S., et. al.: Magnetic resonance imaging for evaluation of Crohn’s disease: validation of parameters of severity and quantitative index of activity. Inflamm Bowel Dis 2011; 17: pp. 1759-1768.
6. Tielbeek J.A.W., Makanyanga J.C., Bipat S., et. al.: Grading crohn disease activity with MRI: Interobserver variability of MRI features, MRI scoring of severity, and correlation with crohn disease endoscopic index of severity. Am. J. Roentgenol 2013; 201: pp. 1220-1228.
7. Ziech M.L.W., Bipat S., Roelofs J.J.T.H., et. al.: Retrospective comparison of magnetic resonance imaging features and histopathology in Crohn’s disease patients. Eur J Radiol 2011; 80: pp. e299-e305. http://dx.doi.org/10.1016/j.ejrad.2010.12.075
8. Tielbeek J.A.W., Vos F.M., Stoker J.: A computer-assisted model for detection of MRI signs of Crohn’s disease activity: Future or fiction?. Abdom Imaging 2012; 37: pp. 967-973.
9. Naziroglu R.E., Puylaert C.A.J., Tielbeek J.A.W., et. al.: Semi-automatic bowel wall thickness measurements on MR enterography in patients with Crohn’s disease. Br J Radiol 2017; 20160654
10. Li Z., Tielbeek J.A.W., Caan M.W.A., et. al.: Expiration-Phase Template-Based Motion Correction of Free-Breathing Abdominal Dynamic Contrast Enhanced MRI. IEEE Trans Biomed Eng 2015; 62: pp. 1215-1225.
11. Schüffler P.J., Mahapatra D., Tielbeek J.A.W., et. al.: A Model Development Pipeline for Crohn’s Disease Severity Assessment from Magnetic Resonance Images. Abdom Imaging Comput Clin Appl 2013; 8198: pp. 1-10.
12. Harvey R.F., Bradshaw J.M.: A simple index of Crohn’s-disease activity. Lancet 1980; 1: pp. 514.
13. Mary J.Y., Modigliani R.: Development and validation of an endoscopic index of the severity for Crohn’s disease: a prospective multicentre study. Groupe d’Etudes Thérapeutiques des Affections Inflammatoires du Tube Digestif (GETAID). Gut 1989; 30: pp. 983-989.
14. Li Z., Mahapatra D., Tielbeek J., et. al.: Image registration based on autocorrelation of local structure. IEEE Trans Med Imaging 2015; 35: pp. 1.
15. Rothery P.: A nonparametric measure of intraclass correlation. Biometrika 1979; 66: pp. 629-639.
16. van Ierssel S.H., Van Craenenbroeck E.M., Conraads V.M., et. al.: Flow cytometric detection of endothelial microparticles (EMP): effects of centrifugation and storage alter with the phenotype studied. Thromb Res 2010; 125: pp. 332-339.
17. Vuillemin A., Oppert J.M., Guillemin F., et. al.: Self-administered questionnaire compared with interview to assess past-year physical activity. Med Sci Sports Exerc 2000; 32: pp. 1119-1124.
18. Steiger J.H.: Tests for comparing elements of a correlation matrix. Psychol Bull 1980; 87: pp. 245-251.
19. Landis J.R., Koch G.G.: The measurement of observer agreement for categorical data. Biometrics 1977; 33: pp. 159-174.
20. R Core Team : R: a language and environment for statistical computing.2014. Available at: http://www.r-project.org/ R Found. Stat. Comput
21. Coimbra A.J.F., Rimola J., O’Byrne S., et. al.: Magnetic resonance enterography is feasible and reliable in multicenter clinical trials in patients with Crohn’s disease, and may help select subjects with active inflammation. Aliment Pharmacol Ther 2016; 43: pp. 61-72.
22. Ordás I., Rimola J., Rodríguez S., et. al.: Accuracy of magnetic resonance enterography in assessing response to therapy and mucosal healing in patients with Crohn’s disease. Gastroenterology 2014; 146: pp. 374-382. e1