
Rationale and Objectives
To evaluate the precision and reproducibility of a semiautomatic tumor segmentation software in measuring tumor volume of hepatocellular carcinoma (HCC) before the first transarterial chemo-embolization (TACE) on contrast-enhancement magnetic resonance imaging (CE-MRI) and intraprocedural dual-phase C-arm cone beam computed tomography (DP-CBCT) images.
Materials and Methods
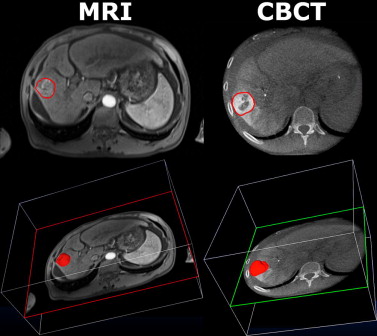
Nineteen HCCs were targeted in 19 patients (one per patient) who underwent baseline diagnostic CE-MRI and an intraprocedural DP-CBCT. The images were obtained from CE-MRI (arterial phase of an intravenous contrast medium injection) and DP-CBCT (delayed phase of an intra-arterial contrast medium injection) before the actual embolization. Three readers measured tumor volumes using a semiautomatic three-dimensional volumetric segmentation software that used a region-growing method employing non-Euclidean radial basis functions. Segmentation time and spatial position were recorded. The tumor volume measurements between image sets were compared using linear regression and Student’s t -test, and evaluated with intraclass-correlation analysis (ICC). The inter-rater Dice similarity coefficient (DSC) assessed the segmentation spatial localization.
Results
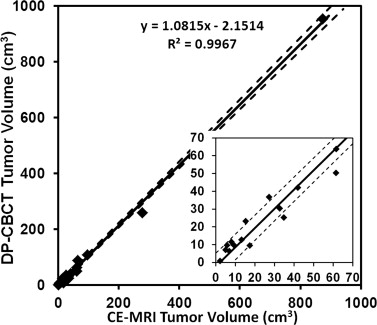
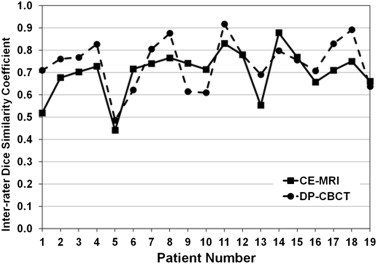
All 19 HCCs were analyzed. On CE-MRI and DP-CBCT examinations, respectively, 1) the mean segmented tumor volumes were 87 ± 8 cm 3 (2–873) and 92 ± 10 cm 3 (1–954), with no statistical difference of segmented volumes by readers of each tumor between the two imaging modalities and the mean time required for segmentation was 66 ± 45 seconds (21–173) and 85 ± 34 seconds (17–214) ( P = .19); 2) the ICCs were 0.99 and 0.974, showing a strong correlation among readers; and 3) the inter-rater DSCs showed a good to excellent inter-user agreement on the spatial localization of the tumor segmentation (0.70 ± 0.07 and 0.74 ± 0.05, P = .07).
Conclusion
This study shows a strong correlation, a high precision, and excellent reproducibility of semiautomatic tumor segmentation software in measuring tumor volume on CE-MRI and DP-CBCT images. The use of the segmentation software on DP-CBCT and CE-MRI can be a valuable and highly accurate tool to measure the volume of hepatic tumors.
Evaluation of treatment response is a key aspect in cancer therapy. On imaging, tumor change after locoregional therapy (ie, transarterial chemo-embolization [TACE]) is used to determine therapeutic success . The three accepted methods to assess response to TACE are measuring changes in tumor size (Response Evaluation Criteria in Solid Tumor [RECIST]), enhancement degree (European Association for the Study of the Liver), and tumor enhancement size (modified Response Evaluation Criteria in Solid Tumors) on magnetic resonance imaging (MRI) . RECIST, described in 2000, is based on the measurement of the longest diameter of a given target lesion or the sum of the longest diameters for a set of target lesions. This unidimensional assessment is made on a single axial slice on cross-sectional imaging (either computed tomography [CT] or MRI). But these criteria are limited for the following reasons: 1) it is a one-dimensional measurement of a tumor volume, 2) it disregards the extent of tumor viability/necrosis after therapy, and 3) it is susceptible to high inter-observer variability . Although RECIST was appropriate at the time of its introduction, the simplicity of RECIST now underuses image processing functionalities available in modern imaging units. With the advent of multidetector CT and MRI, the ability to assess tumor volume using three-dimensional (3D) metrics appear more accurate and precise, as recognized in RECIST version 1.1. In addition, with the increased use of C-arm cone beam CT (CBCT) for interventional oncology, tumor size and enhancement changes can be assessed during the intervention for planning or for treatment success evaluation . A new criterion, volumetric RECIST, was described as a feasible method that can be performed in a realistic time frame to evaluate the tumor volume change after therapy . However, before volume-based metrics can supplant RECIST, these methods must be shown to be accurate and reproducible. A semiautomatic software for tumor volume segmentation has already been evaluated in a preclinical study using the VX2 rabbit hepatic tumor model. In this previous work, the segmentation results from CBCT and diagnostic CT were confirmed by histology . The next step to translate these findings to the clinic and especially in interventional oncology was to confirm the similarity between the liver tumor volume assessments on intraprocedural imaging (dual-phase C-arm CBCT [DP-CBCT]) with the diagnostic imaging gold standard (contrast-enhancement MRI [CE-MRI]). The purpose of this study was to evaluate the correlation, the precision, and the reproducibility of a semiautomatic tumor segmentation software used to measure the tumor volume of hepatocellular carcinoma (HCC) before trans-arterial chemo-embolization (TACE) by comparing CE-MRI, the gold standard in liver imaging, to DP-CBCT imaging.
Material and methods
Patient Study Selection
This was a single institution prospective study (Health Insurance Portability and Accountability Act compliant and institutional review board approved) but the data analysis was done retrospectively. All patients were provided with informed consent before inclusion in the study. The study group included all patients 1) with HCC, 2) scheduled to undergo their first TACE (conventional lipiodol based or drug-eluting beads), 3) without any prior systemic or local therapy, 4) with dynamic CE-MRI within 4 weeks before TACE, and 5) with pre-embolization intraprocedural DP-CBCT. Between May 2, 2011, and April 11, 2012, the liver tumor board discussed the care of 303 patients who underwent TACE. Eligibility criteria for performing TACE were identical to those already published . Of the 303 patients, 249 patients were treated in an angiography suite equipped with DP-CBCT . Of those, 147 patients had HCC, with 60 undergoing their first treatment. Nineteen of these patients had intraprocedural DP-CBCT before chemoembolization and were included in this study. DP-CBCT was performed in all patients unless the CBCT option was not available (in the angiography room) or there was patient-related factors that precluded the use of CBCT (ie, inability to hold breath).
Preprocedural MRI Technique
Get Radiology Tree app to read full this article<
Intraprocedural DP-CBCT Technique
Get Radiology Tree app to read full this article<
Imaging Data Evaluation Overview
Get Radiology Tree app to read full this article<
Semiautomatic Tumor Segmentation
Get Radiology Tree app to read full this article<
Get Radiology Tree app to read full this article<
Dice Similarity Coefficient
Get Radiology Tree app to read full this article<
DSC=2×|RegionA∩RegionB||RegionA|+|RegionB| D
S
C
=
2
×
|
Region
A
∩
Region
B
|
|
Region
A
|
+
|
Region
B
|
where region A and region B of the equation represent the tumor volume segmented by two readers. The DSC varies between 0 and 1, where 0 implies no overlap and 1 represents identical regions with perfect overlap. Landis and Koch described different ranges of values: values greater than 0.75 represent an excellent agreement, below 0.4 a poor agreement, and between 0.75 and 0.40 a good agreement . The inter-user agreement value was calculated as the average of the three DSC values of pairwise comparisons between the readers on each imaging modality. The DSC calculation and visualization was done using MATLAB (MathWorks, Natick, MA) and ImageJ (National Institutes of Health, Bethesda, MD) .
Get Radiology Tree app to read full this article<
Statistical Analysis
Get Radiology Tree app to read full this article<
Results
Get Radiology Tree app to read full this article<
Table 1
Patient’s Characteristics and HCC Staging
Value ( n or Mean ± SD) Baseline characteristics Number of patients/number of tumors 19/19 Age (y) 61 ± 13 Sex (male/female) 13/6 Etiology (alcohol/HCV/HBV/NASH/cryptogenic) 0/10/2/2/5 ECOG performance analysis (0/1/2/3/4) 19/0/0/0/0 Type (unifocal/bifocal/multiple/diffuse) 6/4/8/1 Portal vein thrombosis 2 HCC staging Child-Pugh class (A/B/C) 8/11/0
ECOG, Eastern Cooperative Oncology Group; HBV, hepatitis B virus; HCC, hepatocellular cancer; HCV, hepatitis C virus; NASH, non alcoholic steatohepatitis.
Table 2
Mean Tumor Volume and Segmentation Time Measured on CE-MRI and DP-CBCT by Three Readers for 19 Patients
Patient Number Volume (cm 3 ) ± SD Time (s) ± SD CE-MRI DP-CBCT_P_ Value CE-MRI DP-CBCT_P_ Value 1 15 ± 5 23 ± 4 .26 89 ± 69 120 ± 46 .65 2 62 ± 23 50 ± 14 .41 94 ± 76 161 ± 41 .48 3 8 ± 1 12 ± 3 .24 60 ± 72 40 ± 12 .61 4 13 ± 5 13 ± 1 .87 34 ± 31 89 ± 26 .10 5 17 ± 10 10 ± 5 .19 57 ± 52 77 ± 42 .14 6 33 ± 2 30 ± 14 .82 57 ± 23 76 ± 7 .30 7 35 ± 3 25 ± 3 .02 51 ± 35 156 ± 36 .15 8 6 ± 2 10 ± 1 .17 35 ± 44 30 ± 4 .85 9 42 ± 5 42 ± 7 1.00 58 ± 38 67 ± 54 .83 10 7 ± 1 6 ± 2 .64 21 ± 9 53 ± 26 .18 11 5 ± 1 7 ± 0.3 .12 64 ± 67 17 ± 4 .34 12 873 ± 17 954 ± 86 .29 173 ± 62 214 ± 199 .80 13 9 ± 1 10 ± 1 .64 66 ± 49 51 ± 29 .22 14 278 ± 7 259 ± 9 .09 84 ± 41 90 ± 30 .46 15 96 ± 20 109 ± 22 .59 90 ± 62 72 ± 37 .73 16 65 ± 18 88 ± 15 .16 60 ± 9 109 ± 20 .26 17 62 ± 19 64 ± 5 .87 51 ± 38 96 ± 14 .09 18 27 ± 8 37 ± 2 .19 69 ± 58 77 ± 19 .73 19 2 ± 1 1 ± 0.2 .10 43 ± 27 17 ± 2 .20 Mean ± SD: 87 ± 8 92 ± 10 – 66 ± 45 85 ± 34 .19
CE-MRI, contrast-enhanced magnetic resonance imaging; DP-CBCT, dual phase cone beam computed tomography; SD, standard deviation.
Volume values are in cubic centimeters (cm 3 ) and time values are in seconds (s).
Get Radiology Tree app to read full this article<
Get Radiology Tree app to read full this article<
Get Radiology Tree app to read full this article<
Get Radiology Tree app to read full this article<
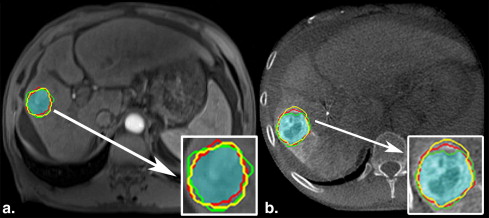
Table 3
Inte-rater DSC for Each Patient according to Imaging Modality: CE-MRI and DP-CBCT
Patient Number DSC Inter-rater CE-MRI DP-CBCT 1 0.52 ± 0.19 0.71 ± 0.02 2 0.68 ± 0.08 0.76 ± 0.05 3 0.70 ± 0.05 0.77 ± 0.03 4 0.73 ± 0.05 0.83 ± 0.01 5 0.44 ± 0.16 0.49 ± 0.10 6 0.72 ± 0.09 0.62 ± 0.11 7 0.74 ± 0.02 0.80 ± 0.04 8 0.77 ± 0.06 0.88 ± 0.2 9 0.74 ± 0.10 0.61 ± 0.07 10 0.71 ± 0.05 0.61 ± 0.08 11 0.83 ± 0.02 0.92 ± 0.02 12 0.78 ± 0.02 0.78 ± 0.02 13 0.55 ± 0.08 0.69 ± 0.15 14 0.88 ± 0.00 0.80 ± 0.04 15 0.77 ± 0.02 0.76 ± 0.03 16 0.66 ± 0.07 0.71 ± 0.04 17 0.71 ± 0.06 0.83 ± 0.04 18 0.75 ± 0.06 0.89 ± 0.03 19 0.66 ± 0.15 0.64 ± 0.08 Average 0.70 ± 0.07 0.74 ± 0.05
CE-MRI, contrast-enhanced magnetic resonance imaging; DP-CBCT, dual-phase cone beam computed tomography; DSC, Dice similarity coefficient.
Table 4
The Mean DSC for Each Reader according to Imaging Modality: CE-MRI and DP-CBCT
Reader Inter-reader DSC CE-MRI DP-CBCT (VT) 0.70 ± 0.11 0.75 ± 0.12 (LG) 0.69 ± 0.13 0.73 ± 0.13 (NB) 0.71 ± 0.13 0.75 ± 0.11
CE-MRI, contrast-enhanced magnetic resonance imaging; DP-CBCT, dual-phase cone beam computed tomography; DSC, Dice similarity coefficient.
Get Radiology Tree app to read full this article<
Discussion
Get Radiology Tree app to read full this article<
Get Radiology Tree app to read full this article<
Get Radiology Tree app to read full this article<
Get Radiology Tree app to read full this article<
Conclusion
Get Radiology Tree app to read full this article<
Get Radiology Tree app to read full this article<
References
1. Bruix J., Sherman M.: Management of hepatocellular carcinoma. Hepatology (Baltimore, Md.) 2005; 42: pp. 1208-1236.
2. Vossen J.A., Buijs M., Kamel I.R.: Assessment of tumor response on MR imaging after locoregional therapy. Tech Vasc Intervent Radiology 2006; 9: pp. 125-132.
3. Therasse P., Arbuck S.G., Eisenhauer E.A., et. al.: New guidelines to evaluate the response to treatment in solid tumors. European Organization for Research and Treatment of Cancer, National Cancer Institute of the United States, National Cancer Institute of Canada. J NCI 2000; 92: pp. 205-216.
4. Eisenhauer E.A., Therasse P., Bogaerts J., et. al.: New response evaluation criteria in solid tumours: revised RECIST guideline (version 1.1). Eur J Cancer 2009; 45: pp. 228-247.
5. Kamel I.R., Liapi E., Reyes D.K., et. al.: Unresectable hepatocellular carcinoma: serial early vascular and cellular changes after transarterial chemoembolization as detected with MR imaging. Radiology 2009; 250: pp. 466-473.
6. Forner A., Ayuso C., Varela M., et. al.: Evaluation of tumor response after locoregional therapies in hepatocellular carcinoma: are response evaluation criteria in solid tumors reliable?. Cancer 2009; 115: pp. 616-623.
7. Lim H.K., Han J.K.: Hepatocellular carcinoma: evaluation of therapeutic response to interventional procedures. Abdominal Imaging 2002; 27: pp. 168-179.
8. Suzuki C., Torkzad M.R., Jacobsson H., et. al.: Interobserver and intraobserver variability in the response evaluation of cancer therapy according to RECIST and WHO-criteria. Acta Oncol 2010; 49: pp. 509-514.
9. Loffroy R., Lin M., Yenokyan G., et. al.: Intra-procedural C-arm dual-phase cone beam CT imaging to predict response to drug-eluting beads transcatheter arterial chemoembolization in patients with hepatocellular carcinoma. Radiology 2012; Epub
10. Lin M., Pellerin O., Bhagat N., et. al.: Quantitative and volumetric EASL and RECIST: feasibility of a semi-automated software method to assess tumor response after transcatheter arterial chemoembolization (TACE). J Vasc Intervent Radiol 2012; 23: pp. 1629-1637.
11. Pellerin O., Lin M., Bhagat N., et. al.: Comparison of semi-automatic volumetric VX2 hepatic tumor segmentation from cone beam CT and multi-detector CT with histology in rabbit models. Acad Radiol 2013; 20: pp. 115-121.
12. Lin M., Loffroy R., Noordhoek N., et. al.: Evaluating tumors in transcatheter arterial chemoembolization (TACE) using dual-phase cone-beam CT. Minimally invasive therapy & allied technologies: MITAT 2011; 20: pp. 276-281.
13. Mori K., Yoshioka H., Takahashi N., et. al.: Triple arterial phase dynamic MRI with sensitivity encoding for hypervascular hepatocellular carcinoma: comparison of the diagnostic accuracy among the early, middle, late, and whole triple arterial phase imaging. AJR Am J Roentgenolo 2005; 184: pp. 63-69.
14. Feldkamp L., Davis L., Kress J.: Practical cone-beam algorithm. J Opt Soc Am 1984; 1: pp. 612-619. A1
15. Miyayama S., Yamashiro M., Okuda M., et. al.: Detection of corona enhancement of hypervascular hepatocellular carcinoma by C-arm dual-phase cone-beam CT during hepatic arteriography. Cardiovas Intervent Radiology 2011; 34: pp. 81-86.
16. Loffroy R., Lin M., Rao P., et. al.: Comparing the detectability of hepatocellular carcinoma by C-arm dual-phase cone-beam computed tomography during hepatic arteriography with conventional contrast-enhanced magnetic resonance imaging. Cardiovasc Intervent Radiology 2012; 35: pp. 97-104.
17. Dice L.R.: Measures of the amount of ecologic association between species. Ecol Soc Am 1945; 26: pp. 297-302.
18. Qazi A.A., Pekar V., Kim J., et. al.: Auto-segmentation of normal and target structures in head and neck CT images: a feature-driven model-based approach. Med Phys 2011; 38: pp. 6160-6170.
19. Zou K.H., Warfield S.K., Bharatha A., et. al.: Statistical validation of image segmentation quality based on a spatial overlap index1: scientific reports. Acad Radiol 2004; 11: pp. 178-189.
20. Mory B, Ardon R, Yezzi AJ, et al. Non-Euclidean image-adaptive radial basis functions for 3D interactive segmentation. 2009 IEEE 12th International Convention on Computer Vision 2009; 787–794.
21. Landis J.R., Koch G.G.: The measurement of observer agreement for categorical data. Biometrics 1977; 33: pp. 159-174.
22. Heimann T., van Ginneken B., Styner M.A., et. al.: Comparison and evaluation of methods for liver segmentation from CT datasets. IEEE Trans Med Imaging 2009; 28: pp. 1251-1265.
23. Shrout P.E., Fleiss J.L.: Intraclass correlations: uses in assessing rater reliability. Psychol Bull 1979; 86: pp. 420-428.
24. Bland J.M., Altman D.G.: Statistical methods for assessing agreement between two methods of clinical measurement. Lancet 1986; 1: pp. 307-310.
25. Dachman A.H., MacEneaney P.M., Adedipe A., et. al.: Tumor size on computed tomography scans: is one measurement enough?. Cancer 2001; 91: pp. 555-560.
26. Hopper K.D., Kasales C.J., Eggli K.D., et. al.: The impact of 2D versus 3D quantitation of tumor bulk determination on current methods of assessing response to treatment. J Comp Assisted Tomogr 1996; 20: pp. 930-937.
27. Prasad S.R., Jhaveri K.S., Saini S., et. al.: CT tumor measurement for therapeutic response assessment: comparison of unidimensional, bidimensional, and volumetric techniques initial observations. Radiology 2002; 225: pp. 416-419.