
Rationale and Objectives
Quantitatively analyze the computed tomography (CT) attenuation effects caused by bismuth shields, which are used to reduce superficial organ dose.
Materials and Methods
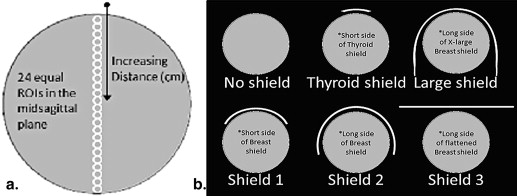
The solid water uniformity section of the American College of Radiology CT phantom was scanned with a modified chest CT protocol. Scans were performed with a bismuth breast shield in multiple configurations, emphasizing three clinically relevant orientations. Attenuation effects were measured as changes in mean Hounsfield unit (HU) values of equal midsagittal regions of interest (ROI). Multiple statistical techniques were used in regression analysis.
Results
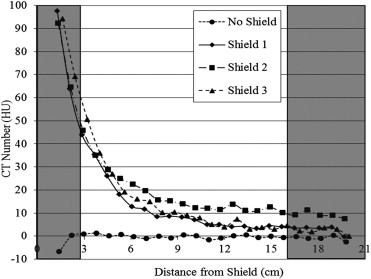
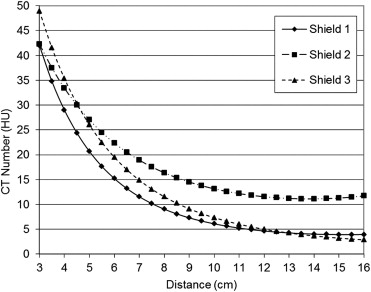
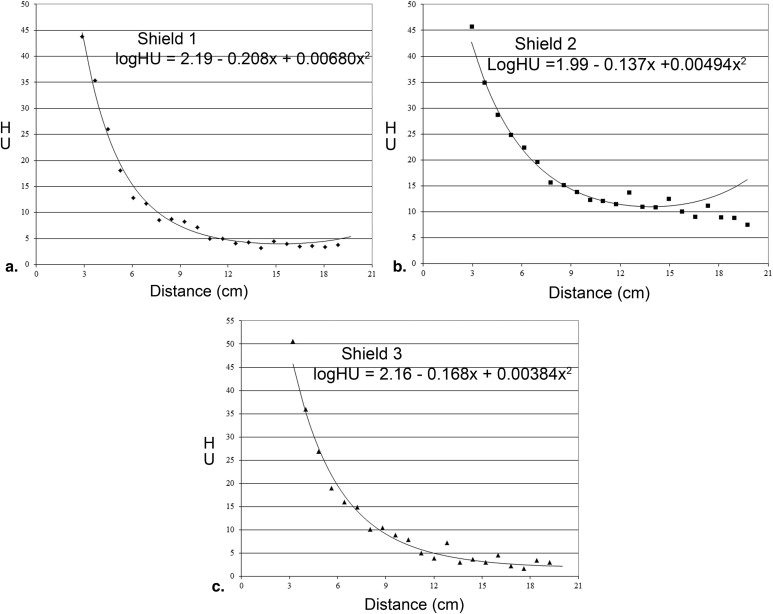
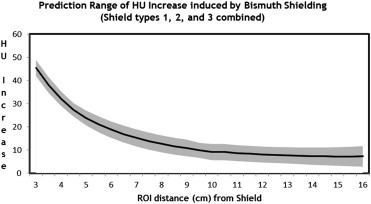
Bismuth shielding resulted in significant positive shifts of the expected Hounsfield unit values. The mean nonshielded CT attenuation was −0.16 ± 0.75 HU. Based on the clinically relevant ROI distance from the shield (∼3–16 cm), the shielded values ranged from 43.8–4 HU, 45.8–10.1 HU, and 50.6–4.5 HU for shields 1, 2, and 3, respectively. All shield configurations displayed a statistically significant shift ( P < .0001) at all distance ranges. The best fitting regression model was a quadratic function of distance versus logarithmic function of HU. A prediction table of the approximate shift in water HU values as a function of ROI distance from the shield was generated per shield type from their respective close-fitting regressions.
Conclusions
The data support the claim that bismuth shields increase the attenuation of water, which can cause inaccurate characterization of simple fluid, giving the appearance of complex fluid or even solid density. However, there is potential for anticipation of the attenuation effects to validate continued use of these shields for dose reduction.
Computed tomography (CT) is responsible for a disproportionally high dose of radiation in relation to the number of studies performed annually . Patient radiation dose from exposure to diagnostic CT examinations has significantly increased in recent years because of more CT studies being performed, raising concerns as a potential cause of malignancy . CT accounts for up to two thirds of medical radiation exposure with more than a quarter billion examinations performed annually worldwide, as reported in 2004 . Because of this significant exposure, institutions have implemented a multifaceted approach to CT dose reduction . One such technique that has been shown to be effective is bismuth shielding of sensitive organs .
Studies show significant dose reduction to superficial radiosensitive organs, such as breasts and thyroid gland, when using bismuth shielding. In vivo studies demonstrate the dose reduction for the breast to range from 34% to 41% and the thyroid up to 30% . Although bismuth shielding has consistently demonstrated significant reduction in radiation dose, controversy surrounds the use of this device.
Get Radiology Tree app to read full this article<
 Open full size image
Figure 1
A 56 year-old female with history of left breast cancer after lumpectomy. This patient presented for multiple follow-up studies after remote left breast lumpectomy for malignant neoplasm of the breast. Two computed tomography scans of the chest performed with (a) and without (b) a bismuth shield, less than 1 year apart, demonstrate increased attenuation in the fluid-containing left breast lesion with the use of the shield (increase of about 30–43 Hounsfield units [HU] at 3.2–5.8 cm from the shield). In fact, when the study with the shield was initially read and only compared to the most recent one, this finding was labeled as an unchanging mass. Grossly the lesion does not change in size or shape; however, given the history of prior malignancy, having a finding that measures relatively high in density and is labeled as a “mass” adds further concern to the medical team caring for this patient as well as to the patient.
Get Radiology Tree app to read full this article<
Get Radiology Tree app to read full this article<
Methods and materials
Get Radiology Tree app to read full this article<
Get Radiology Tree app to read full this article<
Phantom, CT Protocol, Bismuth Shields
Get Radiology Tree app to read full this article<
Get Radiology Tree app to read full this article<
Table 1
Technique Chart for American College of Radiology Phantom Scans on Siemens Flash Computed Tomography
Acquisition Reconstruction 120 kVp B31f 180 effective mAs 3 mm reconstructed slice thickness 1.2 mm × 32 (38.4 mm) beam width 400 mm field of view Pitch = 1 0.5-second tube rotation time CTDI 12.32 mGy
CTDI, computed tomography dose index.
Get Radiology Tree app to read full this article<
Get Radiology Tree app to read full this article<
Get Radiology Tree app to read full this article<
CT Attenuation Assessment
Get Radiology Tree app to read full this article<
Statistical Analysis
Get Radiology Tree app to read full this article<
Results
Get Radiology Tree app to read full this article<
Get Radiology Tree app to read full this article<
Get Radiology Tree app to read full this article<
Get Radiology Tree app to read full this article<
Get Radiology Tree app to read full this article<
Get Radiology Tree app to read full this article<
Get Radiology Tree app to read full this article<
Table 2
Predicted Ranges of Increase in Attenuation Values Based on Distance ∗
Distance (cm) HU Increase Range: Min-Max Mean Increase 3 41.9–48.9 45.4 3.5 34.7–41.5 38.1 4 29.0–35.3 32.15 4.5 24.4–30.2 27.3 5 20.6–27.0 23.8 5.5 17.6–24.5 21.05 6 15.2–22.3 18.75 6.5 13.2–20.5 16.85 7 11.5–18.9 15.2 7.5 10.1–17.5 13.8 8 9.0–16.3 12.65 8.5 8.0–15.3 11.65 9 7.3–14.5 10.9 9.5 6.6–13.1 9.85 10 5.6–12.6 9.1 10.5 5.6–12.6 9.1 11 5.2–12.1 8.65 11.5 4.9–11.8 8.35 12 4.6–11.5 8.05 12.5 4.4–11.3 7.85 13 4.2–11.2 7.7 13.5 3.9–11.1 7.5 14 3.6–11.1 7.35 14.5 3.4–11.1 7.25 15 3.2–11.2 7.2 15.5 3.0–11.4 7.2 16 2.8–11.7 7.25
HU, Hounsfield unit.
Get Radiology Tree app to read full this article<
Get Radiology Tree app to read full this article<
Discussion
Get Radiology Tree app to read full this article<
Get Radiology Tree app to read full this article<
Get Radiology Tree app to read full this article<
Get Radiology Tree app to read full this article<
Get Radiology Tree app to read full this article<
Get Radiology Tree app to read full this article<
Get Radiology Tree app to read full this article<
Acknowledgment
Get Radiology Tree app to read full this article<
References
1. Antypas E.J., Sokhandon F., Farah M., et. al.: A Comprehensive approach to CT radiation dose reduction: one institution’s experience. Am J Roentgenol 2011; 197: pp. 935-940.
2. Brenner D.J., Hall E.J.: Computed tomography—an increasing source of radiation exposure. N Engl J Med 2007; 357: pp. 2277-2284.
3. Frush D.P., Applegate K.: Computed tomography and radiation: understanding the issues. J Am Coll Radiol 2004; 1: pp. 113-119.
4. Catuzzo P., Aimonetto S., Fanelli G., et. al.: Dose reduction in multislice CT by means of bismuth shields: results of in vivo measurements and computed evaluation. La Radiol Med 2010; 115: pp. 152-169.
5. Mukundan S., Wang P.I., Frush D.P., et. al.: MOSFET dosimetry for radiation dose assessment of bismuth shielding of the eye in children. Am J Roentgenol 2007; 188: pp. 1648-1650.
6. Lee K., Lee W., Lee J., et. al.: Dose reduction and image quality assessment in MDCT using AEC (D-DOM & Z-DOM) and in-plane bismuth shielding. Radiat Protection Dosim 2010; 141: pp. 162-167.
7. Fricke B.L., Donnelly L.F., Frush D.P., et. al.: In-Plane Bismuth Breast Shields for Pediatric CT: Effects on Radiation Dose and Image Quality Using Experimental and Clinical Data. American Journal of Roentgenology 2003; 180: pp. 407-411.
8. Yilmaz M.H., Albayram S., Yaşar D., et. al.: Female breast radiation exposure during thorax multidetector computed tomography and the effectiveness of bismuth breast shield to reduce breast radiation dose. J Computer Assisted Tomogr 2007; 31: pp. 138-142.
9. Yilmaz M.H., Yaşar D., Albayram S., et. al.: Coronary calcium scoring with MDCT: the radiation dose to the breast and the effectiveness of bismuth breast shield. Eur J Radiol 2007; 61: pp. 139-143.
10. Colombo P., Pedroli G., Nicoloso M., et. al.: Evaluation of the efficacy of a bismuth shield during CT examinations. Radiol Med (Torino) 2004; 108: pp. 560-568.
11. Vollmar S.V., Kalender W.A.: Reduction of dose to the female breast in thoracic CT: a comparison of standard-protocol, bismuth-shielded, partial and tube-current-modulated CT examinations. Eur Soc Radiol 2008; 18: pp. 1674-1682.
12. Kalra M.K., Dang P., Singh S., et. al.: In-plane shielding for CT: effect of off-centering, automatic exposure control and shield-to-surface distance. Korean J Radiol 2009; 10: pp. 156.
13. Geleijns J., Salvadó Artells M., Veldkamp W.J.H., et. al.: Quantitative assessment of selective in-plane shielding of tissues in computed tomography through evaluation of absorbed dose and image quality. Eur Radiol 2006; 16: pp. 2334-2340.
14. Lee Y.H., Park E.T., Cho P.K., et. al.: Comparative analysis of radiation dose and image quality between thyroid shielding and unshielding during CT examination of the neck. Am J Roentgenol 2011; 196: pp. 611-615.
15. Cobelli R., Zompatori M., De Luca G., et. al.: Clinical usefulness of computer tomography study without contrast injection in the evaluation of acute pulmonary embolism. J Comput Assist Tomogr 2005; 29: pp. 6-12.
16. New P.F., Aronow S.: Attenuation measurements of whole blood and blood fractions in computed tomography. Radiology 1976; 121: pp. 635-640.
17. Wittram C., Maher M.M., Halpern E.F., et. al.: Attenuation of acute and chronic pulmonary emboli. Radiology 2005; 235: pp. 1050-1054.
18. Leswick D.A., Hunt M.M., Webster S.T., et. al.: Thyroid shields versus z-axis automatic tube current modulation for dose reduction at neck CT. Radiology 2008; 249: pp. 572-580.