
Rationale and Objectives
To find signs in vector-electrocardiography (VECG) predicting the ventricular fibrillatory propensity (VF-PROP) of iodixanol and mannitol solutions after injection into the left coronary artery (LCA) of pigs.
Materials and Methods
Five plasma-isotonic solutions perfused LCA: Iod 320 + Na/Ca (iodixanol 320 mg I/mL, 19 mM NaCl, 0.3 mM CaCl 2 ), Iod 320 + Mann (iodixanol 320 mg I/mL, 50 mM mannitol), Mann + Na/Ca (240 mM mannitol, 19 mM NaCl, 0.3 mM CaCl 2 ), Mann (275 mM mannitol), and Ringer (representing “physiologic electrolytes”). The first two solutions have at 37°C viscosity 13 mPas and the others <1 mPas. In eight pigs, 20 mL of each solution was injected twice for 10 seconds, and in 15 pigs, each solution was injected for 11–40 seconds (0.5 mL/second) through a wedged catheter in the LCA. If ventricular fibrillation (VF) occurred, injection was stopped and heart was defibrillated. If VF did not occur, perfusion period was 40 seconds. A higher frequency of VF and a shorter period from start of injection until start of VF gave a solution a higher ranking of VF-PROP.
Results
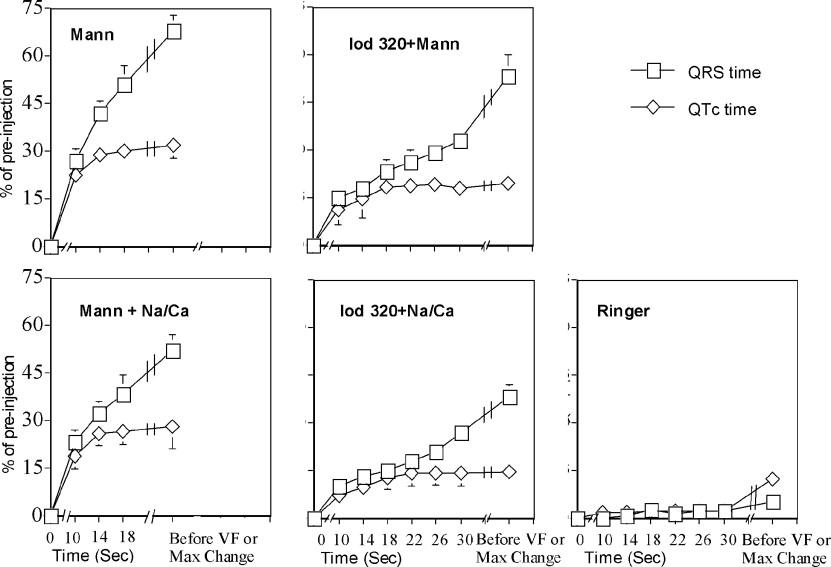
The 10-second injections caused no VF. Ringer and Iod 320 + Na/Ca caused no VF after 40-second injections, whereas the other solutions caused VF. Ranking the solutions from lowest to highest VF- PROP gave: Ringer = Iod 320 + Na/Ca < Iod 320 + Mann < Mann + Na/Ca < Mann. Prolongation of QRS time and QTc time were the only VECG signs that showed significant differences ( P < .05) between all solutions and correctly ranked the VF-PROP of all solutions in both animal groups.
Conclusion
The results fit with the concept that a more physiologic electrolyte composition and a higher viscosity of a test solution will, after start of injection of that solution into LCA, delay changes in the electrolyte composition in myocardial interstitial fluid and also delay start of VF. If a plasma isotonic contrast medium (CM) with lower viscosity than that of iodixanol at 320 mgI/mL were created, we conclude that such a CM should have electrolyte composition closer to that of Ringer than present composition (19 mM NaCl and 0.3 mM CaC1 2 ) to counteract the effects of faster diffusion of nonphysiologic electrolyte composition from the low-viscosity CM to myocardial interstitial fluid.
In a previous study in pigs ( ), the original aim was to evaluate the roles of electrolyte content and “chemotoxicity” (see Discussion for aspects on this term) of an iodine contrast medium (CM) iodixanol with regard to its propensity to cause ventricular fibrillation (VF) after prolonged injection into the left coronary artery (LCA). However, it turned out that the viscosity of the CM solutions had an important role in the fibrillatory propensity of the test solutions.
The fibrillatory propensities (VF-PROP) of four test solutions and one control solution (Ringer), all iso-osmolal to plasma, were compared. The solutions ( Table 1 ) were:
Table 1
Physical and Chemical Properties of the Test Solutions
Iodine Concentration (mg I/mL) Electrolytes (mM) Viscosity (mPas) 37°C Osmolality (Osm/kg H 2 O) pH Na Ca Mann ⁎ 0 0 0 0.96 0.30 6.0 Mann † + Na/Ca 0 19 0.3 0.92 0.30 6.0 Iod 320 + Mann ‡ 320 0 0 13.8 0.31 7.4 Iod 320 + Na/Ca 320 19 0.3 13.1 0.30 7.4 Ringer 0 130 2.0 0.84 0.27 6.0
Na/Ca = 19 mM NaCl and 0.3 mM CaCl 2 ; Iod-320 = iodixanol 320 mg I/mL; Ringer = 130 mM Na + , 4 mM K + , 2 mM Ca ++ , 1 mM Mg ++ , 112 mM Cl − , 30 mM acetate.
Get Radiology Tree app to read full this article<
Get Radiology Tree app to read full this article<
Get Radiology Tree app to read full this article<
Get Radiology Tree app to read full this article<
Get Radiology Tree app to read full this article<
Table 2
Ranking of the VF-PROP of Test Solutions After Injections into the Left Coronary Artery
n = Number of Injections Mann A ( n = 15) Mann + Na/Ca B ( n = 15) Iod-320 + Mann C ( n = 15) Iod-320 + Na/Ca D ( n = 15) Ringer E ( n = 13) Number of VF 15/15 (C ⁎ D ⁎⁎⁎ E ⁎⁎⁎ ) 14/15 (D ⁎⁎⁎ E ⁎⁎ ) 9/15 (A ⁎ D ⁎⁎ E ⁎ ) 0/15 (A ⁎⁎⁎ B ⁎⁎⁎ C ⁎⁎ ) 0/13 (A ⁎⁎⁎ B ⁎⁎ C ⁎ ) Incidence of VF 100% 93% 60% 0% 0% Period from start of injection to start of VF (seconds) 24 ± 2 (B ⁎ C ⁎ D ⁎⁎⁎ E ⁎⁎⁎ ) 30 ± 2 (A ⁎ C ⁎ D ⁎⁎ E ⁎⁎ ) 35 ± 4 (A ⁎ B ⁎ D ⁎⁎ E ⁎⁎ ) ∞ (A ⁎⁎⁎ B ⁎⁎ C ⁎⁎ ) ∞ (A ⁎⁎⁎ B ⁎⁎ C ⁎⁎ )
VF-PROP = ventricular fibrillatory propensity; Mann = D-mannitol; Na/Ca = 19 mM NaCl and 0.3 mM CaCl 2 ; Iod-320 = iodixanol 320 mg I/mL; time to VF (seconds) = mean ± SEM; ∞ = fibrillation did not occur during a 20-minute observation after injection.
A, B, C, D, or E within brackets after a measured value means a significant difference versus the solutions within the bracket (
The test solutions also have the names A, B, C, D, and E. (A) had highest VF-PROP; then (B); followed by (C); (D) and (E) had lowest VF-PROP.
VF-PROP is based on incidence of VF and length of period from start of injection to start of VF.
Wedged catheter (period of injection 11–40 seconds).
Get Radiology Tree app to read full this article<
Get Radiology Tree app to read full this article<
Get Radiology Tree app to read full this article<
Get Radiology Tree app to read full this article<
Get Radiology Tree app to read full this article<
Get Radiology Tree app to read full this article<
VF starts when perfusion of test solution through the LCA has made the electrolyte composition of the interstitial fluid of the myocardium, supplied by the LCA, sufficiently non-physiologic. The more physiologic the electrolyte composition of the perfusion fluid, and the higher its viscosity, the slower the electrolyte composition of the myocardial interstitial fluid is changed after start of perfusion and VF occurs later (or not at all). ( )
Get Radiology Tree app to read full this article<
Get Radiology Tree app to read full this article<
Material and methods
Get Radiology Tree app to read full this article<
Animal Preparation
Get Radiology Tree app to read full this article<
Experimental Procedure
Get Radiology Tree app to read full this article<
Get Radiology Tree app to read full this article<
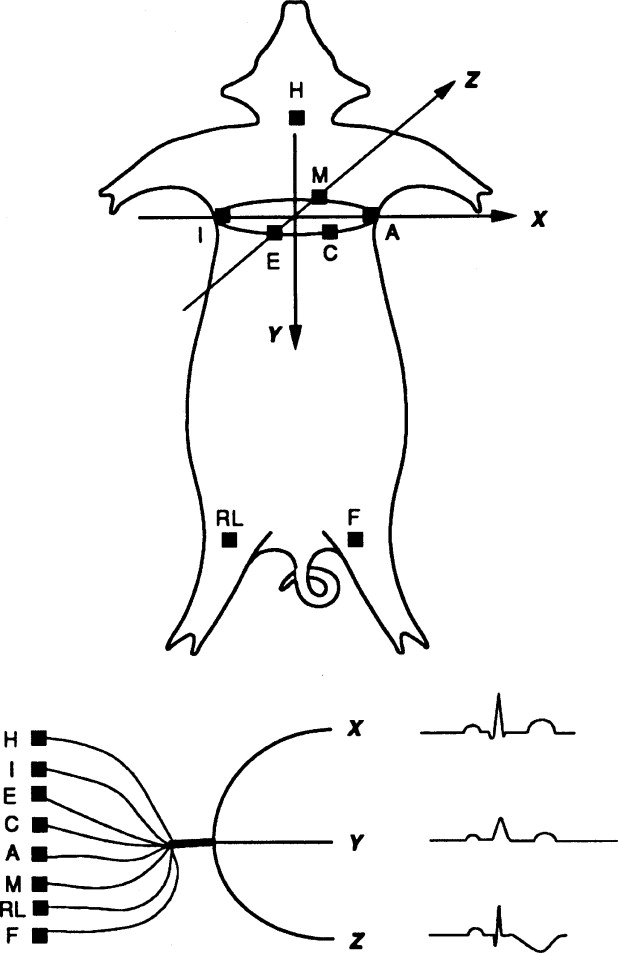
VECG
Get Radiology Tree app to read full this article<
Get Radiology Tree app to read full this article<
Measuring Changes in the Magnitude of the Vector
Get Radiology Tree app to read full this article<
Get Radiology Tree app to read full this article<
Get Radiology Tree app to read full this article<
Table 3
VECG Parameters
Abbreviation Unit Parameter QRS-time msec Time between beginning and end of QRS complex QTc-time msec Time between beginning of QRS complex and end of T wave Correction of the QT time for heart rate using Bazett’s formula QRS-VD μVsec QRS vector difference. Change (with regard to reference complex) in the area of the QRS-vector complex ([integral of vector magnitude [volt] over time [seconds] from start of QRS complex to end of QRS –complex). The reference complex is the last QRS complex before start of injection of test solution QRS-max mV Maximum magnitude of vector within the QRS complex QRS-SpA μV 2 Spatial area. The area in space traced out by the VECG vector from start of QRS-complex to end of QRS complex ST-VM mV ST vector magnitude. The magnitude measured 20 msec after the end of the QRS-complex T-max mV Maximum magnitude of vector within the T wave
Table 4
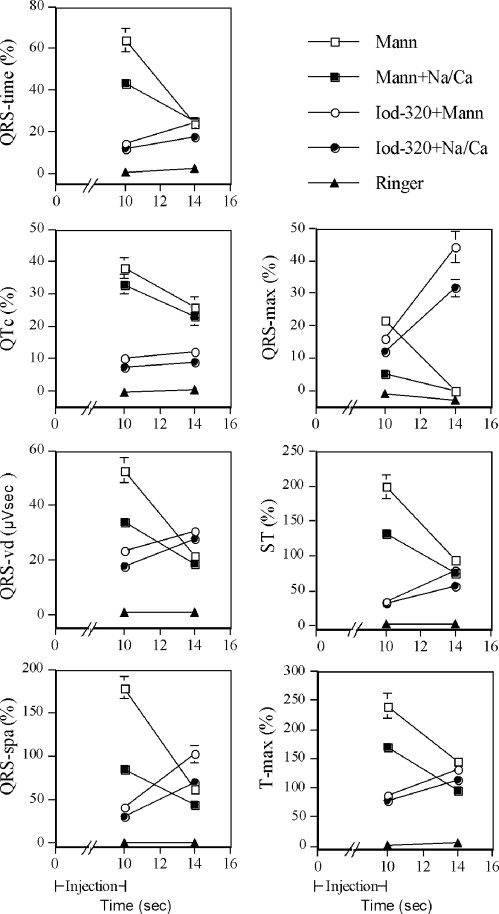
Changes in Vectorelectrocardiogram 10 Seconds After Start of Injection of the Test Solutions into the Left Main Coronary Artery in Pigs
Mann A ( n = 16) Mann + Na/Ca B ( n = 16) Iod-320 + Mann C ( n = 16) Iod-320 + Na/Ca D ( n = 16) Ringer E ( n = 16) QRS time (%) 64 ± 5.6 (BCDE) 43 ± 2.8 (ACDE) 15 ± 1.3 (ABDE) 12 ± 1.0 (ABCE) 1 ± 1 (ABCD) QTc (%) 38 ± 2.1 (BCDE) 33 ± 3.0 (ACDE) 10 ± 0.8 (ABDE) 7 ± 0.8 (ABCE) 0 ± 1.0 (ABCD) QRS-VD (μVsec) 53 ± 4.5 (BCDE) 34 ± 2.3 (ACDE) 21 ± 1.4 (ABDE) 17 ± 1.2 (ABCE) 1 ± 0.0 (ABCD) QRS-SpA (%) 179 ± 13 (BCDE) 85 ± 6.8 (ACDE) 42 ± 3.2 (ABDE) 30 ± 2.6 (ABCE) 0 ± 1 (ABCD) QRS-max (%) 22 ± 2.2 (BCDE) 5 ± 1.3 (ACDE) 16 ± 1.6 (ABDE) 12 ± 1.0 (ABCE) –1 ± 0.6 (ABCD) ST-VM (%) 194 ± 18 (BCDE) 134 ± 8.6 (ACDE) 32 ± 2.8 (ABE) 31 ± 3.7 (ABE) 20 ± 1.8 (ABCD) T max (%) 240 ± 21 (BCDE) 170 ± 11 (ACDE) 86 ± 2.9 (ABE) 79 ± 4.9 (ABE) 2 ± 1 (ABCD)
Mann = D-mannitol; Na/Ca = 19 mM NaCl and 0.3 mM CaCl 2 ; Iod-320 = iodixanol 320 mg I/mL.
A, B, C, D, or E within brackets after a measured value means a significant difference versus the solutions named within the bracket ( P < .05). Data are mean ± SEM.
The changes are expressed in (%) or (μVsec) in comparison with last vector ECG complex before start of injection of test solution.
Nonwedged catheter (injection period 10 seconds). The test solutions also have the names A, B, C, D, and E.
Table 5
Changes in Vectorelectrocardiogram at 16 Seconds After Start of Injection of the Test Solutions into the Left Main Coronary Artery in Pigs
Mann A ( n = 13) Mann + Na/Ca B ( n = 15) Iod-320 + Mann C ( n = 14) Iod-320 + Na/Ca D ( n = 15) Ringer E ( n = 13) QRS time (%) 53 ± 5 (BCDE) 39 ± 5 (ACDE) 25 ± 4 (ABDE) 17 ± 3 (ABCE) 2 ± 1 (ABCD) QTc (%) 30 ± 1.9 (BCDE) 26 ± 2.2 (ACDE) 19 ± 2.1 (ABDE) 15 ± 0.7 (ABCE) 8 ± 1.0 (ABCD) QRS-VD (μVsec) 41 ± 5.9 (BE) 28 ± 3.2 (ACE) 44 ± 3.1 (BDE) 37 ± 2.8 (BCE) 3 ± 0.5 (ABCD) QRS-SpA (%) 176 ± 17 (BCDE) 78 ± 9 (ACDE) 447 ± 30 (ABDE) 282 ± 28 (ABCE) 10 ± 3 (ABCD) QRS-max (%) 26 ± 2.8 (CDE) 22 ± 2.8 (CDE) 119 ± 23 (ABDE) 77 ± 10 (ABCE) 0 ± 1 (ABCD) ST-VM (%) 281 ± 22 (CDE) 240 ± 28 (CDE) 169 ± 20 (ABE) 151 ± 14 (ABE) 72 ± 8 (ABCD) T max (%) 422 ± 46 (BCDE) 290 ± 30 (ACDE) 148 ± 15 (ABDE) 88 ± 10 (ABCE) 7 ± 2 (ABCD)
Mann = D-mannitol; Na/Ca = 19 mM NaCl and 0.3 mM CaCl 2 ; Iod-320 = iodixanol 320 mg I/ml.
A, B, C, D, or E within brackets after a measured value means a significant difference versus the solution(s) within the bracket ( P < .05). Data are mean ± SEM.
The changes are expressed in (%) or (μVsec) in comparison with last vector ECG complex before start of injection of test solution.
Two pigs receiving Mann and one pig receiving Iod-320 + Mann were not included because they fibrillated at 11–13 seconds after start of injection.
Wedged catheter (injection period: 11–40 seconds). The test solutions also have the names A, B, C, D and E.
Get Radiology Tree app to read full this article<
Measuring Changes in the Direction and Magnitude of the Vector
Get Radiology Tree app to read full this article<
Search for VECG Parameters Predicting VF-Propensity of Test Solutions
Get Radiology Tree app to read full this article<
Statistical Analysis
Get Radiology Tree app to read full this article<
Results
Effects on VECG Parameters After Short Injections
Measurement of magnitude of VECG parameters
Get Radiology Tree app to read full this article<
Get Radiology Tree app to read full this article<
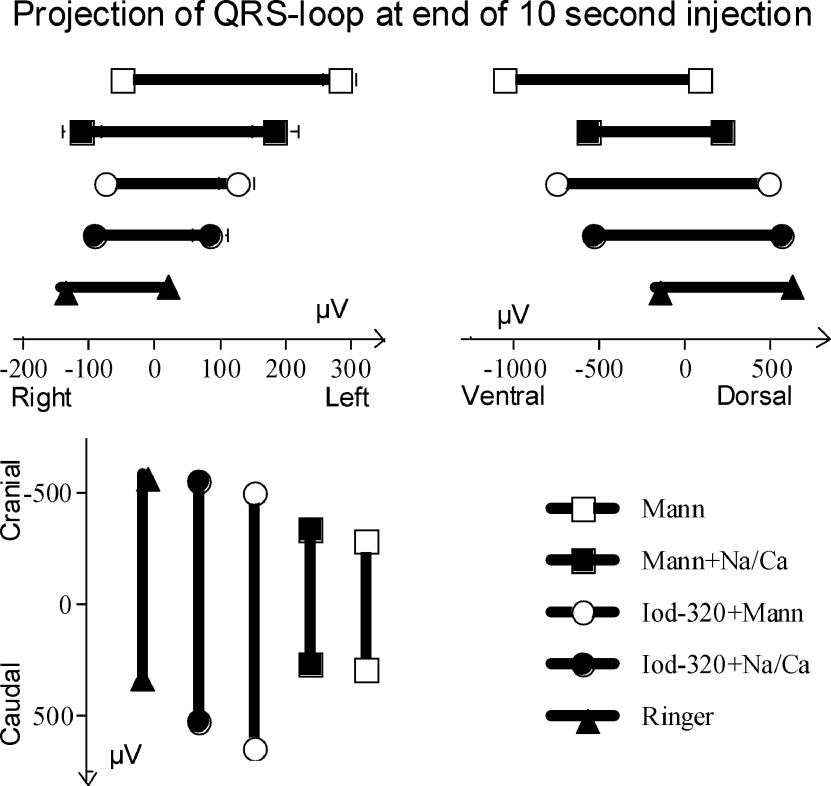
Measurement of position in space of the QRS-loop
Get Radiology Tree app to read full this article<
Effects on VECG Parameters During Long Injections
Measurement of magnitude of VECG parameters
Get Radiology Tree app to read full this article<
Get Radiology Tree app to read full this article<
Get Radiology Tree app to read full this article<
Measurement of position in space of QRS loop
Get Radiology Tree app to read full this article<
Get Radiology Tree app to read full this article<
Changes in VECG Parameters that “Truly” Predict VF-PROP of Test Solution
Get Radiology Tree app to read full this article<
Get Radiology Tree app to read full this article<
Get Radiology Tree app to read full this article<
Changes in VECG Parameters that “Falsely” Predict VF-PROP of Test Solutions
Get Radiology Tree app to read full this article<
Occurrence of Extrasystoles
Get Radiology Tree app to read full this article<
Discussion
About the Concept “Chemotoxicity”
Get Radiology Tree app to read full this article<
Choice of D-Mannitol to Represent Osmotic Effects
Get Radiology Tree app to read full this article<
Choice of Adding 19 mM Na + and 0.3 mM Ca ++ Ions to Mannitol and Iodixanol
Get Radiology Tree app to read full this article<
Get Radiology Tree app to read full this article<
Get Radiology Tree app to read full this article<
Role of Electrolytes in the Animal Model Used
Get Radiology Tree app to read full this article<
Get Radiology Tree app to read full this article<
Role of Viscosity of Test Solution
Get Radiology Tree app to read full this article<
Get Radiology Tree app to read full this article<
Prolongation of QRS Time (%) and QTc (%)
Get Radiology Tree app to read full this article<
Get Radiology Tree app to read full this article<
Get Radiology Tree app to read full this article<
Get Radiology Tree app to read full this article<
Get Radiology Tree app to read full this article<
Some Mechanisms Involved When Changes in VECG Give False Predictions of VF-PROP
Get Radiology Tree app to read full this article<
Get Radiology Tree app to read full this article<
Get Radiology Tree app to read full this article<
Get Radiology Tree app to read full this article<
Get Radiology Tree app to read full this article<
Get Radiology Tree app to read full this article<
Changes of Position of the QRS Loop
Get Radiology Tree app to read full this article<
Conclusion
Get Radiology Tree app to read full this article<
Get Radiology Tree app to read full this article<
Get Radiology Tree app to read full this article<
References
1. Chai C.-M., Almén T., Bååth L., et. al.: Adding sodium and calcium ions to the contrast medium iodixanol reduces the risk of ventricular fibrillation during perfusion of the left coronary artery in pigs. Acad Radiol 2004; 11: pp. 583-593.
2. de Haën C., Morisetti A., Bertani F., et. al.: The factor time in acute intravenous toxicity studies of contrast media. Invest Radiol 1994; 29: pp. S108-S110.
3. Frank E.: An accurate, clinically practical system for spatial vectorcardiography. Circulation 1956; XIII: pp. 737-749.
4. Besjakov J., Chai C.M., Bååth L., et. al.: Addition of electrolytes and oxygen to iohexol.1993.University of LundSweden
5. Besjakov J., Chai C.M., Bååth L., Almén T.: Comparison between oxygenated iohexol solution enriched with electrolytes and other low-osmotic contrast media. Invest Radiol 1994; 29: pp. S238-S241.
6. Flinck A., Selin K., Dellborg M., et. al.: Addition of sodium to iohexol. Acta Radiol 1994; 35: pp. 619-625.
7. Flinck A., Selin K., Björneld L., et. al.: Iodixanol and iohexol in cardioangiography. Acta Radiol 2000; 41: pp. 384-389.
8. Flinck A., Selin K.: Vectorcardiographic changes during cardioangiography with iodixanol and ioxaglate. Int J Cardiol 2000; 76: pp. 173-180.
9. Kløw N.E., Tande P., Hevrøy O., et. al.: Mechanism of ECG changes and arrhythmogenic properties of low osmolality contrast media during coronary arteriography in dog. Cardiovasc Res 1990; 24: pp. 303-308.
10. Lepeschkin E.: Physiologic influences on transfer factors between heart currents and body surface potentials.Nelson C.V.The theoretical basis of electrocardiography.1976.Clarendon PressOxford:pp. 135-161.
11. Spear J.F., Michelson E.L., Moore E.N.: Reduced space constant in slowly conducting regions of chronically infarcted canine myocardium. Circ Res 1983; 53: pp. 176-185.
12. Murdoch D., Euler D., Becker D., et. al.: Ventricular fibrillation during coronary angiography: an analysis of mechanism. Am Heart J 1985; 109: pp. 265-273.
13. Better O.S., Rubinstein I., Winaver J.M., et. al.: Mannitol therapy revisited (1940–1997). Kidney Int 1997; 51: pp. 886-894.
14. Morris T.W.: Ventricular fibrillation during right coronary arteriography with I ioxaglate, iohexol and iopamidol in dogs. Invest Radiol 1988; 23: pp. 205-208.
15. Hayakawa K., Yamashita K.: Low-osmolality contrast media-induced ventricular fibrillation. Invest Radiol 1989; 24: pp. 298-301.
16. Bååth L., Almén T.: Reduction of the risk of ventricular fibrillation in the isolated rabbit heart by small additions of electrolytes to non-ionic monomeric contrast media. Acta Radiol 1989; 30: pp. 327-333.
17. Bååth L., Almén T., Öksendal A.: Effect of sodium addition to nonionic contrast media on cardiac contractile force. Acta Radiol 1990; 31: pp. 99-104.
18. Bååth L., Besjakov J., Öksendal A.: Sodium-calcium balance in nonionic contrast media: effects on the risk of ventricular fibrillation in the isolated rabbit heart. Invest Radiol 1993; 28: pp. 223-227.
19. Jacobsen E.A., Klöw N.E., Mortensen E., et. al.: Sodium addition to nonionic contrast media: effects on cardiac monophasic action potentials and hemodynamics in dog model. Invest Radiol 1991; 26: pp. 888-893.
20. Pedersen H.K., Jacobsen E.A., Refsum H.: Contrast media-induced ventricular fibrillation: an experimental study of the effects of dimeric contrast media during wedged catheter injection in dogs. Acad Radiol 1994; 1: pp. 136-144.
21. Jynge P., Holten T., Öksendal A.: Sodium-calcium balance and cardiac function with isotonic iodixanol. Invest Radiol 1993; 28: pp. 20-25.
22. Jynge P.: Sodium-calcium balance in coronary angiography and experimental experience with iodixanol. Eur Radiol 1996; 6: pp. S8-S12.
23. Misumi K., Tateno O., Fujiki M., et. al.: The risk of contrast media-induced ventricular fibrillation is low in canine coronary arteriography with ioxilan. J Vet Med Sci 2000; 62: pp. 421-426.
24. Jynge P., Blankson H., Schjott J., et. al.: Contractile responses to electrolyte changes during coronary bolus perfusion. Invest Radiol 1995; 30: pp. 173-180.
25. Falck G., Olsen H., Jynge P.: Biophysical factors and contractile function during coronary bolus perfusion: An experimental study in the isolated guinea pig heart. Acad Radiol 1997; 4: pp. 253-263.