
Rationale and Objectives
The relative roles of arterial spin-labeling (ASL) perfusion imaging and magnetic resonance morphological assessment in diagnosing Alzheimer’s disease (AD) have not been established. Our purposes were to directly compare the diagnostic performance of ASL regional cerebral blood flow (rCBF) measurement and that of morphological assessment, and to determine whether or not the combination of the two methods improves diagnostic performance.
Materials and Methods
We analyzed 23 consecutive, retrospectively identified AD patients and 23 healthy control subjects. For each subject, both high-resolution T1-weighted images and ASL perfusion images were obtained. A linear discriminant analysis was performed to distinguish the AD patients from the control subjects based on the three imaging parameters: 1) globally normalized gray matter (GM) density determined by voxel-based morphometry (VBM) procedures, 2) normalized rCBF calculated from ASL data, and 3) the combination of the two. The discriminative abilities of these methods were evaluated by the area under the curve (AUC) derived from receiver-operating characteristics analysis.
Results
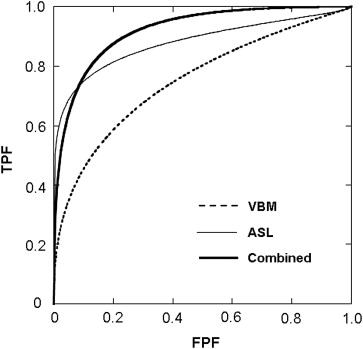
The morphological assessment based on the globally normalized GM density resulted in an AUC of 0.779, whereas ASL-normalized rCBF analysis achieved better performance (AUC = 0.893). The combination of the two methods performed better (AUC = 0.919) than either method alone.
Conclusion
Normalized rCBF measurement by ASL may perform better than morphological analysis based on the VBM procedure in discriminating AD patients from healthy control subjects. The combination of the two approaches was more effective than either method alone.
Alzheimer’s disease (AD) has elicited a special research interest in brain imaging techniques to visualize its neurodegenerative evolution, particularly to assist in early diagnosis for the opportune start of recently developed efficacious therapies such as the administration of cholinesterase inhibitors. Moreover, early stages of AD are considered a relevant target for future therapies. Imaging studies using positron emission tomography with 18 F-fluoro-deoxyglucose (FDG-PET) and single-photon emission tomography (SPECT) have revealed a characteristic regional pattern of diminished glucose metabolism and cerebral blood flow (CBF) in posterior cingulate and temporoparietal cortices in the early stages of AD . Although functional studies are considered promising biomarkers for early AD stages, morphometric studies have been the mainstream approach with magnetic resonance imaging (MRI). Volume loss of gray matter (GM) in medial temporal structures such as the entorhinal cortex and hippocampus has been reported to be diagnostic for AD . MRI is advantageous over functional nuclear medicine techniques because it does not expose the patient to radiation and because it is available more widely. The recent introduction of quantitative and fully automated image analysis methods facilitates bias-free analysis of structural MR images, and its usefulness in characterizing and diagnosing AD has been proven by multiple researchers. Voxel-based morphometry (VBM) is one of the most widely used among such automated techniques.
In addition to morphological imaging, recent advances in MRI allow for the assessment of functional parameters, such as cerebral perfusion. In particular, arterial spin labeling (ASL) has recently drawn much attention as a new tool for cerebral perfusion imaging . ASL has been considered a promising functional MR technique for AD diagnosis by virtue of its noninvasiveness and its ability to quantitate regional CBF (rCBF) .
Get Radiology Tree app to read full this article<
Materials and methods
Get Radiology Tree app to read full this article<
Subjects
Get Radiology Tree app to read full this article<
Get Radiology Tree app to read full this article<
Get Radiology Tree app to read full this article<
MRI
Get Radiology Tree app to read full this article<
Data Analysis
Get Radiology Tree app to read full this article<
Get Radiology Tree app to read full this article<
ASL Perfusion Imaging
Get Radiology Tree app to read full this article<
Statistical Analyses
Get Radiology Tree app to read full this article<
Get Radiology Tree app to read full this article<
Get Radiology Tree app to read full this article<
Get Radiology Tree app to read full this article<
Results
Get Radiology Tree app to read full this article<
Table 1
Demographic and Clinical Characteristics of the Study Subjects
AD ( n = 23) HC ( n = 23)P Value Age (y) ∗ 74.6 ± 8.9 73.2 ± 6.9 NS Sex (M/F) 9/14 11/12 NS MMSE score ∗ 21.1 ± 4.4 29.4 ± 0.9 < .0001
AD, Alzheimer’s disease patients; HC, healthy controls.
Get Radiology Tree app to read full this article<
Get Radiology Tree app to read full this article<
Get Radiology Tree app to read full this article<
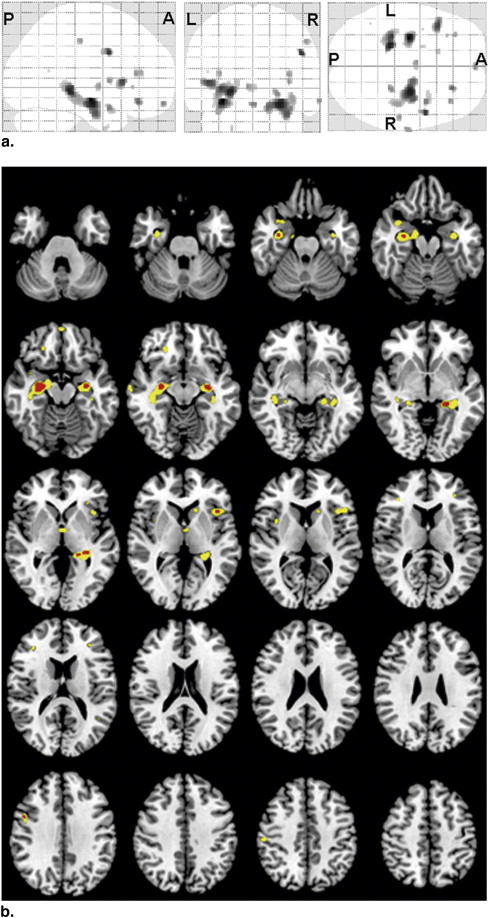
Table 2
Areas with Significantly ( P < .001, uncorrected) Reduced Globally Normalized GM Density in AD Patients Compared with HC Subjects
Region Location (mm) Extent (voxels) t Value x y z L hippocampus −30 −12 −12 241 4.97 R hippocampus 27 −12 −15 779 4.63 L hippocampus −21 −33 −3 388 4.58 R inferior frontal gyrus 48 6 34 45 4.35 L inferior frontal gyrus −44 20 6 114 4.26 R middle frontal gyrus 23 35 −14 33 4.04 R superior temporal gyrus 38 6 −20 66 3.86 L gyrus rectus 0 60 −15 9 3.82 R hippocampus 24 −33 −5 34 3.78 R inferior frontal gyrus 36 33 13 20 3.71 L thalamus −5 −4 1 30 3.71 R insula 36 6 6 18 3.70 R postcentral gyrus 53 −22 45 21 3.69 R middle temporal gyrus 66 −13 −12 20 3.67 L inferior frontal gyrus −33 38 15 14 3.65 L inferior frontal gyrus −32 29 1 5 3.46 L caudate nucleus −15 20 4 24 3.44 L uncus −21 3 −39 7 3.43 L superior temporal gyrus −39 3 −17 1 3.35 L superior temporal gyrus −45 −54 16 1 3.30
R, right; L, left.
Table 3
Results of Linear Discriminant Analysis Including the Globally Normalized GM Density, nrCBF, and Their Combinations at Different P Values
P Value Sensitivity (%) Specificity (%) Accuracy (%) AUC VBM (Globally normalized GM density) .001 73.9 87.0 80.4 0.779 .0005 69.6 87.0 78.3 0.763 .0001 65.2 78.3 71.7 0.760 ASL (nrCBF) .001 91.3 60.9 80.4 0.875 .0005 91.3 73.9 82.6 0.877 .0001 82.6 73.9 78.3 0.893 .00005 82.6 82.6 82.6 0.872 .00001 82.6 82.6 82.6 0.877 Combined VBM .001 87.0 82.6 84.8 0.919 ASL .0001 Cross-validated 82.6 82.6 82.6 —
ASL, arterial spin labeling; AUC, area under the curve; nrCBF, normalized regional cerebral blood flow; VBM, voxel-based morphometry.
Get Radiology Tree app to read full this article<
Get Radiology Tree app to read full this article<
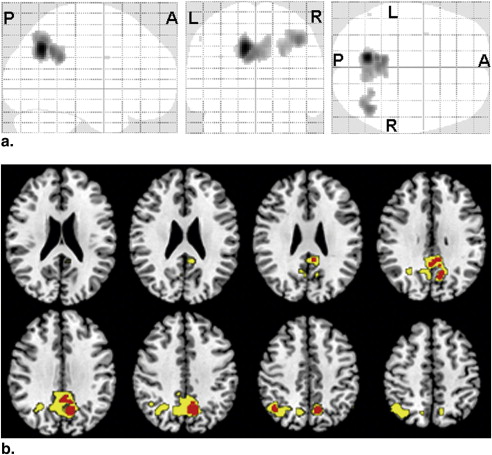
Table 4
Areas with Significantly ( P < .001, uncorrected) Reduced nrCBF in AD Patients Compared with HC Subjects
Region Location (mm) Extent (voxels) t Value x y z L precuneus −10 −60 38 507 5.73 L posterior cingulate −10 −52 38 114 4.33 R inferior parietal lobule 42 −60 46 208 4.27 R posterior cingulate 4 −49 34 12 3.84 R precuneus 6 −63 40 283 3.77 L precentral −34 2 30 2 3.31 L inferior parietal lobule −54 −60 48 2 3.30
nrCBF, normalized regional cerebral blood flow; R, right; L, left.
Get Radiology Tree app to read full this article<
Get Radiology Tree app to read full this article<
Get Radiology Tree app to read full this article<
Discussion
Get Radiology Tree app to read full this article<
Get Radiology Tree app to read full this article<
Get Radiology Tree app to read full this article<
Get Radiology Tree app to read full this article<
Get Radiology Tree app to read full this article<
Get Radiology Tree app to read full this article<
Get Radiology Tree app to read full this article<
Conclusion
Get Radiology Tree app to read full this article<
Get Radiology Tree app to read full this article<
References
1. Minoshima S., Giordani B., Berent S., et. al.: Metabolic reduction in the posterior cingulate cortex in very early Alzheimer’s disease. Ann Neurol 1997; 42: pp. 85-94.
2. Kogure D., Matsuda H., Ohnishi T., et. al.: Longitudinal evaluation of early Alzheimer’s disease using brain perfusion SPECT. J Nucl Med 2000; 41: pp. 1155-1162.
3. Ishii K., Sasaki M., Yamaji S., et. al.: Demonstration of decreased posterior cingulate perfusion in mild Alzheimer’s disease by means of H 2 15 O positron emission tomography. Eur J Nucl Med 1997; 24: pp. 670-673.
4. Jack C.R., Petersen R.C., O’Brien P.C., et. al.: MR-based hippocampal volumetry in the diagnosis of Alzheimer’s disease. Neurology 1992; 42: pp. 183-188.
5. Jack C.R., Petersen R.C., Xu Y.C., et. al.: Medial temporal atrophy on MRI in normal aging and very mild Alzheimer’s disease. Neurology 1997; 49: pp. 786-794.
6. Frisoni G.B., Testa C., Zorzan A., et. al.: Detection of grey matter loss in mild Alzheimer’s disease with voxel based morphometry. J Neurol Neurosurg Psychiatry 2002; 73: pp. 657-664.
7. Karas G.B., Burton E.J., Rombouts S.A., et. al.: A comprehensive study of gray matter loss in patients with Alzheimer’s disease using optimized voxel-based morphometry. Neuroimage 2003; 18: pp. 895-907.
8. Ashburner J., Friston K.J.: Voxel-based morphometry-the methods. Neuroimage 2000; 11: pp. 805-821.
9. Detre J.A., Leigh J.S., Williams D.S., et. al.: Perfusion imaging. Magn Reson Med 1992; 23: pp. 37-45.
10. Petersen E., Zimine I., Ho Y.-C., et. al.: Non-invasive measurement of perfusion: a critical review of arterial spin labelling techniques. Br J Radiol 2006; 79: pp. 688-701.
11. Sandson T.A., O’Connor M., Sperling R.A., et. al.: Noninvasive perfusion MRI in Alzheimer’s disease: a preliminary report. Neurology 1996; 47: pp. 1339-1342.
12. Alsop D.C., Detre J.A., Grossman M.: Assessment of cerebral blood flow in Alzheimer’s disease by spin-labeled magnetic resonance imaging. Ann Neurol 2000; 47: pp. 93-100.
13. Johnson N.A., Jahng G.-H., Welner M.W., et. al.: Pattern of cerebral hypoperfusion in Alzheimer disease and mild cognitive impairment measured with arterial spin-labeling MR imaging: initial experience. Radiology 2005; 234: pp. 851-859.
14. McKhann G., Drachman D., Folstein M., et. al.: Clinical diagnosis of Alzheimer’s disease: report of the NINCDS-ADRDA Work Group under the auspices of Department of Health and Human Services Task Force on Alzheimer’s Disease. Neurology 1984; 34: pp. 939-944.
15. American Psychiatric Association: Diagnostic and statistical manual of mental disorders: DSM-IV.1994.American Psychiatric AssociationWashington, DC:
16. Folstein M.F., Folstein S.E., McHugh P.R.: “Mini-Mental State”: a practical method for grading the cognitive state of patients for the clinician. J Psychiatr Res 1975; 12: pp. 189-198.
17. Román G.C., Tatemichi T.K., Erkinjuntti T., et. al.: Vascular dementia: diagnostic criteria for research studies. Report of the NINDS-AIREN International Workshop. Neurology 1993; 43: pp. 250-260.
18. Zung W.W.: A self-rating depression scale. Arch Gen Psychiatry 1965; 12: pp. 63-70.
19. Petersen E.T., Lim T., Golay X.: Model-free arterial spin labeling quantification approach for perfusion MRI. Magn Reson Med 2006; 55: pp. 219-232.
20. Ashburner J.: A fast diffeomorphic image registration algorithm. Neuroimage 2007; 38: pp. 95-113.
21. Matsunari I., Samuraki M., Chen W.-P., et. al.: Comparison of 18F-FDG PET and optimized voxel-based morphometry for detection of Alzheimer’s disease: aging effect on diagnostic performance. J Nucl Med 2007; 48: pp. 1961-1970.
22. Ishii K., Sasaki M., Matsui M., et. al.: A diagnostic method for suspected Alzheimer’s disease using H(2)15O positron emission tomography perfusion Z score. Neuroradiology 2000; 42: pp. 787-794.
23. Yoshiura T., Hiwatashi A., Noguchi T., et. al.: Arterial spin labelling at 3-T MR imaging for detection of individuals with Alzheimer’s disease. Eur Radiol 2009; 19: pp. 2819-2825.
24. Klein A., Andersson J., Ardekani B.A., et. al.: Evaluation of 14 nonlinear deformation algorithms applied to human brain MRI registration. Neuroimage 2009; 46: pp. 786-802.
25. Testa C., Laakso M.P., Sabattoli F., et. al.: A comparison of accuracy of voxel-based morphometry and hippocampal volumetry in Alzheimer’s disease. J Magn Reson Imaging 2004; 19: pp. 274-282.
26. Hirata Y., Matsuda H., Nemoto K., et. al.: Voxel-based morphometry to discriminate early Alzheimer’s disease from controls. Neurosci Lett 2005; 382: pp. 269-274.
27. Kawachi T., Ishii K., Sakamoto S., et. al.: Comparison of the diagnostic performance of FDG-PET and VBM-MRI in very mild Alzheimer’s disease. Eur J Nucl Med Mol Imaging 2006; 33: pp. 801-809.
28. Asllani I., Habeck C., Scarmeas N., et. al.: Multivariate and univariate analysis of continuous arterial spin labeling perfusion MRI in Alzheimer’s disease. J Cereb Blood Flow Metab 2008; 28: pp. 725-736.
29. Chao L.L., Buckley S.T., Kornak J., et. al.: ASL perfusion MRI predicts cognitive decline and conversion from MCI to dementia. Alzheimer Dis Assoc Disorder 2010; 24: pp. 19-27.
30. Petersen E.T., Mouridsen K., Golay X., et. al.: The QUASAR reproducibility study. Part II: results from a multi-center arterial spin labeling test-retest study. Neuroimage 2010; 49: pp. 104-113.
31. Matsuda H.: Role of neuroimaging in Alzheimer’s disease, with emphasis on brain perfusion SPECT. J Nucl Med 2007; 48: pp. 1289-1300.
32. Matsuda H., Kitayama N., Ohnishi T., et. al.: Longitudinal evaluation of both morphologic and functional changes in the same individuals with Alzhiermer’s disease. J Nucl Med 2002; 43: pp. 304-311.
33. Raji C.A., Lee C., Lopez O.L., et. al.: Initial experience in using continuous arterial spin-labeling MR imaging for early detection of Alzheimer disease. AJNR Am J Neuroradiol 2010; 31: pp. 847-855.
34. Ishii K., Kawachi T., Sasaki H., et. al.: Voxel-based morphometric comparison between early- and late-onset mild Alzheimer’s disease and assessment of diagnostic performance of Z score images. AJNR Am J Neuroradiol 2005; 25: pp. 333-340.
35. Sakamoto S., Ishii K., Sasaki M., et. al.: Differences in cerebral metabolic impairment between early and late onset types of Alzheimer’s disease. J Neurol Sci 2002; 200: pp. 27-32.
36. Frisoni G.B., Testa C., Sabattoli F., et. al.: Structural correlates of early and late onset Alzheimer’s disease: voxel based morphometric study. J Neurol Neurosurg Psychiatry 2005; 76: pp. 112-114.
37. Kanetaka H., Mastuda H., Asada T., et. al.: Effects of partial volume correction on discrimination between very early Alzheimer’s dementia and controls using brain perfusion SPECT. Eur J Nucl Med Mol Imaging 2004; 31: pp. 975-980.
38. Colliot O., Chetelat G., Chupin M., et. al.: Discrimination between Alzheimer disease, mild cognitive impairment, and normal aging by using automated segmentation of the hippocampus. Radiology 2008; 248: pp. 194-201.
39. Fischl B., Dale A.M.: Measuring the thickness of the human cerebral cortex from magnetic resonance images. Proc Natl Acad Sci USA 2000; 97: pp. 11050-11055.
40. Feczko E., Augustinack J.C., Fischl B., et. al.: An MRI-based method for measuring volume, thickness and surface area of entorhinal, perirhinal, and posterior parahippocampal cortex. Neurobiol Aging 2009; 30: pp. 420-431.
41. Dickerson B.C., Feczko E., Augustinack J.C., et. al.: Differential effects of aging and Alzheimer’s disease on medial temporal lobe cortical thickness and surface area. Neurobiol Aging 2009; 30: pp. 432-440.
42. Wilke M., Kassubek J., Ziyeh S., et. al.: Automated detection of gray matter malformations using optimized voxel-based morphometry: a systematic approach. NeuroImage 2003; 20: pp. 330-343.