
Rationale and Objectives
This study aimed to compare long-axis diameter to average computed tomography (CT) diameter measurements of lung adenocarcinomas manifesting as solid lung nodules ≤30 mm on CT, as referenced to pathologic measurements, and to determine the impact of the two CT measurement approaches on tumor (T)-staging of nodules.
Materials and Methods
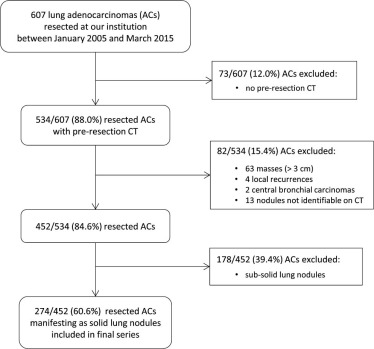
This institutional review board-approved study included all 274 radiologic solid adenocarcinomas resected at our institution over 10 years. Two observers measured long- and short-axis diameters on pre-resection chest CT in lung and mediastinal windows. T-stages were determined. CT measurements and T-stages were compared to pathology measurements and T-stages using Wilcoxon signed rank test and McNemar test. Inter- and intraobserver variability was determined with intraclass correlation coefficients (ICC) and Bland-Altman plots.
Results
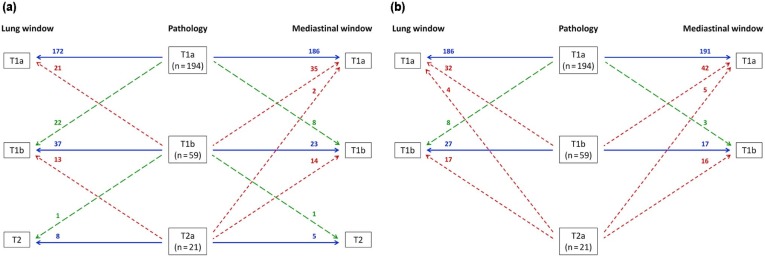
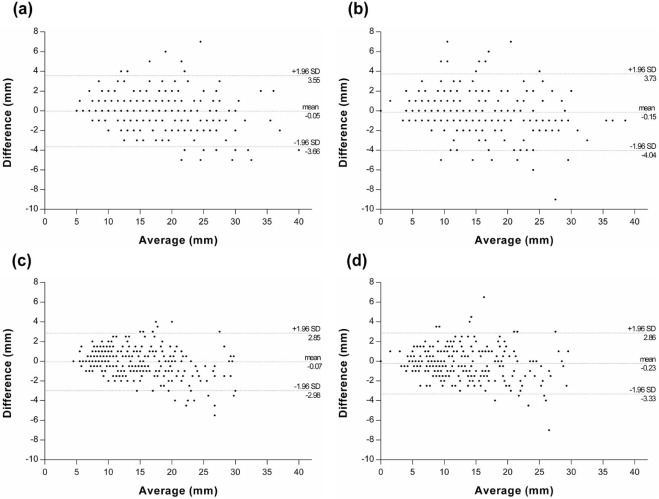
For lung and mediastinal windows, nodule size was significantly larger using long-axis diameter rather than average diameter (16.93 vs. 14.92 mm, P < .001; and 14.02 vs. 12.17 mm, P < .001, respectively). The correlation of CT with pathologic measurements was stronger with long-axis than with average diameter (ICC 0.808 vs. 0.730; and 0.731 vs. 0.621, respectively). Lung window measurements correlated stronger with pathology than mediastinal window measurements. CT T-stages differed from pathology T-stages in more than 20% of nodules ( P < .001). Inter- and intraobserver variability was small with long-axis and average diameter (ICC range 0.96–0.991, and 0.970–0.993, respectively), but long-axis diameter showed wider scatter on Bland-Altman plots.
Conclusions
Long-axis CT diameter is preferable for T-staging because it better reflects the pathology T-stage. Average CT diameter might be used for longitudinal nodule follow-up because it shows less measurement variability and is more conservative in size assessment.
Introduction
The size of solid lung nodules detected on computed tomography (CT) has a substantial impact on their management. Indeed, current management guidelines consider nodule size a key parameter for both incidentally detected nodules and those seen in the framework of CT lung cancer screening . The approaches to how nodule size is measured and expressed, however, differ. Whereas some authors recommend that the long-axis diameter of a nodule should be used , others suggest that the average of long-axis and short-axis diameters should be calculated . To date, no general consensus has been reached over which of these two approaches is more accurate.
This may, in part, be caused by the paucity of studies comparing CT measurements of solid nodules to measurements obtained by pathology, which is commonly considered the reference standard for determining nodule size . Such comparisons could help quantify potential differences between the two measurement approaches and gauge the consequences that these differences have for the management of solid nodules, notably with respect to tumor (T)-staging.
Get Radiology Tree app to read full this article<
Materials and Methods
Study Material
Get Radiology Tree app to read full this article<
Get Radiology Tree app to read full this article<
Get Radiology Tree app to read full this article<
Get Radiology Tree app to read full this article<
Get Radiology Tree app to read full this article<
CT Acquisition
Get Radiology Tree app to read full this article<
Nodule Measurements
CT
Get Radiology Tree app to read full this article<
Get Radiology Tree app to read full this article<
Pathology
Get Radiology Tree app to read full this article<
TABLE 1
The Number of Nodules Allocated to Stages T1a, T1b, and T2a, by Pathology and CT Measurements
Pathology CT Average Diameter Long-axis Diameter Lung Window Mediastinal Window Lung Window Mediastinal Window T1a † 194(70.80%) 222(81.02%) 238(86.86%) 193(70.44%) 223(81.39%) T1b † 59(21.53%) 52(18.98%) 36(13.14%) 72(26.28%) 45(16.42%) T2a † 21(7.66%) 0 \* 0 \* 9(3.28%) 6(2.19%)
AJCC, American Joint Committee on Cancer; CT, computed tomography.
The overall number of nodules was 274.
Get Radiology Tree app to read full this article<
Get Radiology Tree app to read full this article<
Get Radiology Tree app to read full this article<
Statistical Analysis
Get Radiology Tree app to read full this article<
Get Radiology Tree app to read full this article<
Comparison of CT diameters and pathology diameters
Get Radiology Tree app to read full this article<
Get Radiology Tree app to read full this article<
Get Radiology Tree app to read full this article<
Comparison of long-axis diameter and average CT diameter
Get Radiology Tree app to read full this article<
Variability of CT measurements
Get Radiology Tree app to read full this article<
Get Radiology Tree app to read full this article<
Results
Get Radiology Tree app to read full this article<
Get Radiology Tree app to read full this article<
TABLE 2
Mean Diameters ± Standard Deviation (95%CI) of All 274 Nodules Measured by Pathology and the Two Observers on CT
Pathology Diameter (mm) CT Diameter (mm) Average Diameter Long-axis Diameter Lung Window Mediastinal Window Lung Window Mediastinal Window 17.76 ± 8.28
(16.78; 18.75) Observer 1 14.89 ± 5.78 12.06 ± 6.44 16.90 ± 6.69 13.94 ± 7.35 (14.20; 15.58) (11.29; 12.82) (16.11; 17.69) (13.07; 14.81) Observer 2 14.96 ± 6.28 12.29 ± 6.76 16.95 ± 7.23 14.09 ± 7.76 (14.21; 15.70) (11.49; 13.09) (16.09; 17.81) (13.17; 15.01)
CI, confidence interval; CT, computed tomography.
Get Radiology Tree app to read full this article<
Comparison of CT Diameters and Pathology Diameters
Long-axis CT Diameter
Get Radiology Tree app to read full this article<
Get Radiology Tree app to read full this article<
Get Radiology Tree app to read full this article<
Average CT Diameter
Get Radiology Tree app to read full this article<
Get Radiology Tree app to read full this article<
Comparison of Long-axis Diameter and Average CT Diameter
Get Radiology Tree app to read full this article<
Get Radiology Tree app to read full this article<
Variability of CT Measurements
Interobserver Variability
Get Radiology Tree app to read full this article<
Get Radiology Tree app to read full this article<
Get Radiology Tree app to read full this article<
Intraobserver Variability
Get Radiology Tree app to read full this article<
Get Radiology Tree app to read full this article<
Discussion
Get Radiology Tree app to read full this article<
Get Radiology Tree app to read full this article<
Get Radiology Tree app to read full this article<
Get Radiology Tree app to read full this article<
Get Radiology Tree app to read full this article<
Get Radiology Tree app to read full this article<
Get Radiology Tree app to read full this article<
Get Radiology Tree app to read full this article<
Get Radiology Tree app to read full this article<
Acknowledgment
Get Radiology Tree app to read full this article<
Get Radiology Tree app to read full this article<
References
1. MacMahon H., Austin J.H., Gamsu G., et. al.: Guidelines for management of small pulmonary nodules detected on CT scans: a statement from the Fleischner Society. Radiology 2005; 237: pp. 395-400.
2. Gould M.K., Donington J., Lynch W.R., et. al.: Evaluation of individuals with pulmonary nodules: when is it lung cancer? Diagnosis and management of lung cancer, 3rd ed: American College of Chest Physicians evidence-based clinical practice guidelines. Chest 2013; 143: pp. e93S-120S.
3. Callister M.E., Baldwin D.R., Akram A.R., et. al.: British Thoracic Society guidelines for the investigation and management of pulmonary nodules. Thorax 2015; 70: pp. ii1-ii54.
4. Kazerooni E.A., Austin J.H., Black W.C., et. al.: ACR-STR practice parameter for the performance and reporting of lung cancer screening thoracic computed tomography (CT): 2014 (Resolution 4). J Thorac Imaging 2014; 29: pp. 310-316.
5. American Joint Committee on Cancer : AJCC cancer staging manual.7th ed.2010.SpringerNew York
6. Detterbeck F.C., Postmus P.E., Tanoue L.T.: The stage classification of lung cancer: diagnosis and management of lung cancer, 3rd ed: American College of Chest Physicians evidence-based clinical practice guidelines. Chest 2013; 143: pp. e191S-210S.
7. Rami-Porta R., Ball D., Crowley J., et. al.: The IASLC Lung Cancer Staging Project: proposals for the revision of the T descriptors in the forthcoming (seventh) edition of the TNM classification for lung cancer. J Thorac Oncol 2007; 2: pp. 593-602.
8. National Comprehensive Cancer Network : Clinical Practice Guidelines in Oncology: Non-Small Cell Lung Cancer. Available at: https://www.nccn.org/professionals/physician_gls/f_guidelines.asp Accessed January 5, 2017
9. Anderson K.R., Heidinger B.H., Chen Y., et. al.: Measurement bias of gross pathologic as compared to radiologic tumor size of resected lung adenocarcinomas; implications for the T-Stage revisions in the 8th edition of the AJCC Cancer Staging Manual. Am J Clin Pathol 2017;
10. Hansell D.M., Bankier A.A., MacMahon H., et. al.: Fleischner society: glossary of terms for thoracic imaging. Radiology 2008; 246: pp. 697-722.
11. Bossuyt P.M., Reitsma J.B., Bruns D.E., et. al.: The STARD statement for reporting studies of diagnostic accuracy: explanation and elaboration. Ann Intern Med 2003; 138: pp. W1-W12.
12. Pawaroo D., Cummings N.M., Musonda P., et. al.: Non-small cell lung carcinoma: accuracy of PET/CT in determining the size of T1 and T2 primary tumors. AJR Am J Roentgenol 2011; 196: pp. 1176-1181.
13. Aydin F., Dertsiz L., Budak E.S., et. al.: Measurements of tumor size using CT and PET compared to histopathological size in non-small cell lung cancer. Diagn Interv Radiol 2013; 19: pp. 271-278.
14. Henschke C.I., McCauley D.I., Yankelevitz D.F., et. al.: Early lung cancer action project: overall design and findings from baseline screening. Lancet 1999; 354: pp. 99-105.
15. Bland J.M., Altman D.G.: Statistical methods for assessing agreement between two methods of clinical measurement. Lancet 1986; 1: pp. 307-310.
16. Ridge C.A., Huang J., Cardoza S., et. al.: Comparison of multiplanar reformatted CT lung tumor measurements to axial tumor measurement alone: impact on maximal tumor dimension and T stage. AJR Am J Roentgenol 2013; 201: pp. 959-963.
17. Lampen-Sachar K., Zhao B., Zheng J., et. al.: Correlation between tumor measurement on computed tomography and resected specimen size in lung adenocarcinomas. Lung Cancer 2012; 75: pp. 332-335.
18. Bhure U.N., Lardinois D., Kalff V., et. al.: Accuracy of CT parameters for assessment of tumour size and aggressiveness in lung adenocarcinoma with bronchoalveolar elements. Br J Radiol 2010; 83: pp. 841-849.
19. Isaka T., Yokose T., Ito H., et. al.: Comparison between CT tumor size and pathological tumor size in frozen section examinations of lung adenocarcinoma. Lung Cancer 2014; 85: pp. 40-46.
20. Baltayiannis N., Chandrinos M., Anagnostopoulos D., et. al.: Lung cancer surgery: an up to date. J Thorac Dis 2013; 5: pp. S425-S439.
21. Cetinkaya E., Turna A., Yildiz P., et. al.: Comparison of clinical and surgical-pathologic staging of the patients with non-small cell lung carcinoma. Eur J Cardiothorac Surg 2002; 22: pp. 1000-1005.
22. Macpherson R.E., Higgins G.S., Murchison J.T., et. al.: Non-small-cell lung cancer dimensions: CT-pathological correlation and interobserver variation. Br J Radiol 2009; 82: pp. 421-425.
23. Yu H.M., Liu Y.F., Hou M., et. al.: Evaluation of gross tumor size using CT, 18F-FDG PET, integrated 18F-FDG PET/CT and pathological analysis in non-small cell lung cancer. Eur J Radiol 2009; 72: pp. 104-113.
24. UICC (International Union Against Cancer) : TNM supplement: a commentary on uniform use.2012.John Wiley & Sons, Ltd.New York
25. Hsu P.K., Huang H.C., Hsieh C.C., et. al.: Effect of formalin fixation on tumor size determination in stage I non-small cell lung cancer. Ann Thorac Surg 2007; 84: pp. 1825-1829.
26. Zhao B., James L.P., Moskowitz C.S., et. al.: Evaluating variability in tumor measurements from same-day repeat CT scans of patients with non-small cell lung cancer. Radiology 2009; 252: pp. 263-272.
27. Solomon J., Mileto A., Nelson R.C., et. al.: Quantitative features of liver lesions, lung nodules, and renal stones at multi-detector row CT examinations: dependency on radiation dose and reconstruction algorithm. Radiology 2016; 279: pp. 185-194.
28. Kim H., Park C.M., Lee S.M., et. al.: A comparison of two commercial volumetry software programs in the analysis of pulmonary ground-glass nodules: segmentation capability and measurement accuracy. Korean J Radiol 2013; 14: pp. 683-691.
29. Bartholmai B.J., Koo C.W., Johnson G.B., et. al.: Pulmonary nodule characterization, including computer analysis and quantitative features. J Thorac Imaging 2015; 30: pp. 139-156.
30. van Riel S.J., Sanchez C.I., Bankier A.A., et. al.: Observer variability for classification of pulmonary nodules on low-dose CT images and its effect on nodule management. Radiology 2015; 277: pp. 863-871.
31. Ridge C.A., Yildirim A., Boiselle P.M., et. al.: Differentiating between subsolid and solid pulmonary nodules at CT: inter- and intraobserver agreement between experienced thoracic radiologists. Radiology 2016; 278: pp. 888-896.