
Rationale and Objectives
Current clinical practice favors imaging rather than biopsy to diagnose hepatocellular carcinoma (HCC). There is a need to better understand tumor biology and aggressiveness of HCC. Our goal is to investigate magnetic resonance imaging (MRI) features of HCC that are associated with faster growth rates (GRs).
Materials and Methods
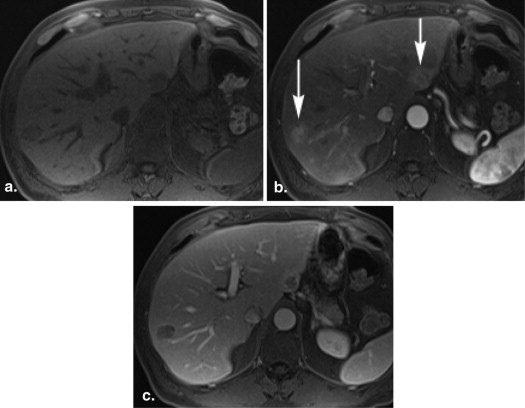
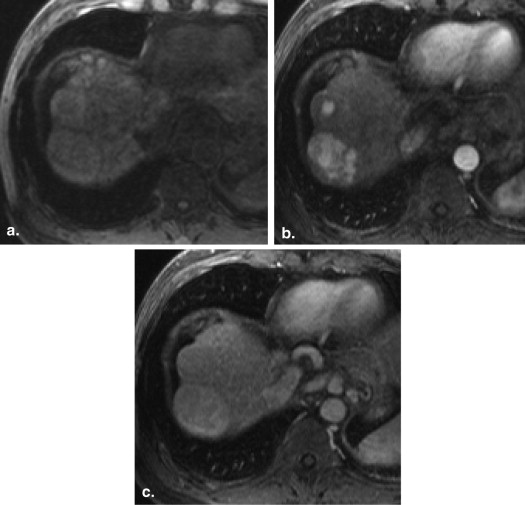
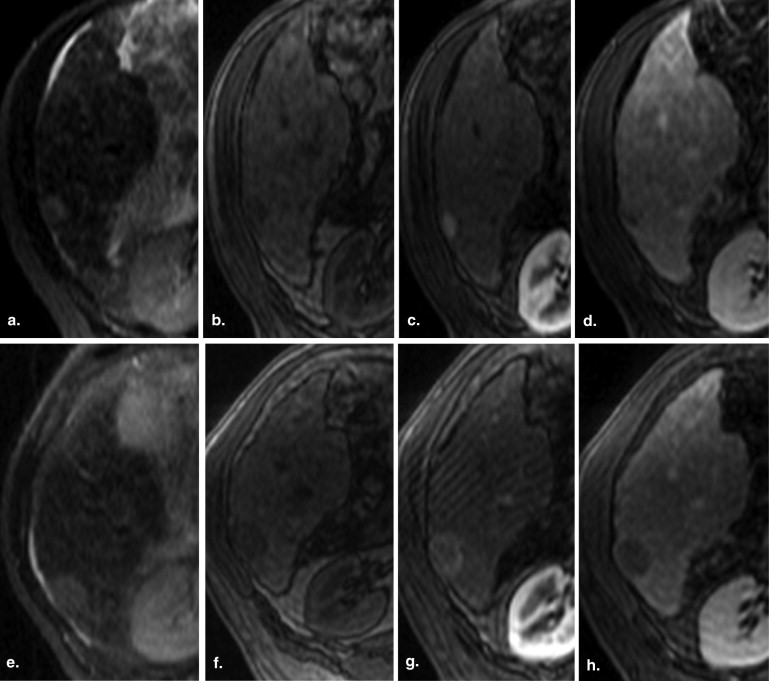
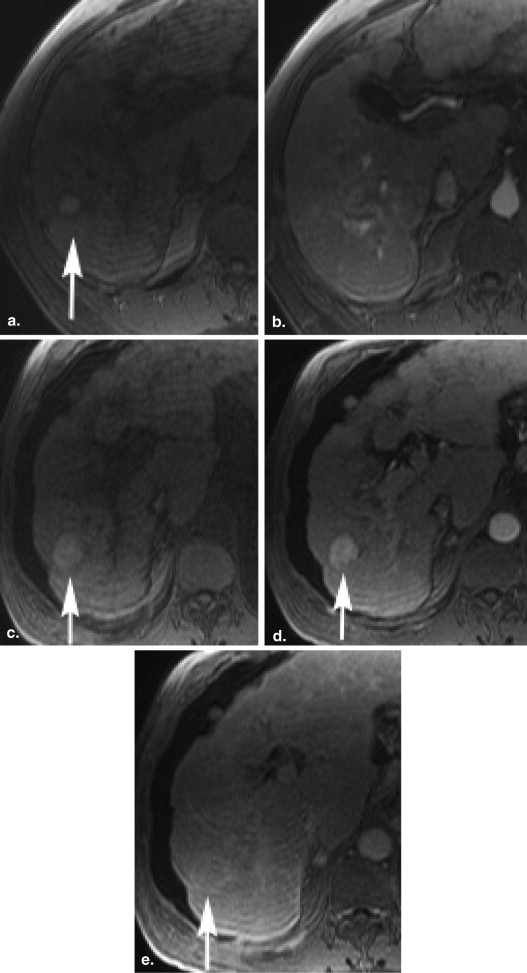
After approval from institutional review board, a retrospective evaluation was performed of pre–liver transplant patients. Fifty-two patients who developed a >2 cm HCC on serial imaging were included in the study group, with a total of 60 HCCs seen. Precursor foci were identified on serial MRIs before the specific diagnostic features of >2 cm HCC could be made, and GRs and MRI features, including signal on T1- and T2-weighted images (WI), the presence of intralesional steatosis on chemical shift imaging, and enhancement pattern were analyzed. GRs were correlated with imaging features.
Results
The average GR of precursor lesions to >2 cm HCC was determined to be 0.23 cm/mo (standard deviation [SD], 0.32), with a doubling time of 5.26 months (SD, 5.44). The presence of increased signal intensity (SI) on T2-WI was associated with significantly higher growth ( P = .0002), whereas increased intensity on T1-WI at the initial study was associated with a significantly lower GR ( P = .0162). Furthermore, lesions with hypervascular enhancement with washout pattern had significantly higher GR ( P = .0164). There is no evidence of differences in GRs seen in lesions with steatosis.
Conclusions
Small precursor lesions with increased SI on T2-WI and a washout pattern of enhancement are associated with faster GRs, which may suggest more aggressive tumor biology. These features may be helpful in patient management and surveillance for HCC.
Currently, in the United States, liver transplant is offered to patients with hepatocellular carcinoma (HCC) as the best method of improving long-term survival. Cirrhotic patients with small HCC (one lesion that measures 2–5 cm or up to three lesions that measure <3 cm each) are candidates for transplant. Patients with HCCs that meet these size and number criteria and have no evidence of extrahepatic disease or tumor macrovascular invasion are awarded a higher position on transplant lists . Most transplant centers in North America use imaging as a method of establishing the diagnosis of HCC and forgo biopsy because of concerns of tumor seeding, complications related to the procedure, and the concern for sampling error. However, there is growing evidence that size-based criteria do not adequately predict tumor aggressiveness and prognosis in individual patients .
Evidence accumulated in the past two decades strongly favors the existence of a sequence in hepatocarcinogenesis from dysplastic nodules to small HCC (<2 cm) to large HCC . Prior researchers have found an association between the size, differentiation, and intratumoral arterial density in HCC and the presence of fat . These pathologic features have imaging correlates that may be useful in making a diagnosis of HCC.
Get Radiology Tree app to read full this article<
Materials and methods
Get Radiology Tree app to read full this article<
Get Radiology Tree app to read full this article<
Get Radiology Tree app to read full this article<
Image Analysis
Get Radiology Tree app to read full this article<
Get Radiology Tree app to read full this article<
Get Radiology Tree app to read full this article<
Get Radiology Tree app to read full this article<
Get Radiology Tree app to read full this article<
Get Radiology Tree app to read full this article<
Get Radiology Tree app to read full this article<
Get Radiology Tree app to read full this article<
Get Radiology Tree app to read full this article<
Statistical Analyses
GR and DT Calculated for Follow-up Data Only
Get Radiology Tree app to read full this article<
Get Radiology Tree app to read full this article<
DT=log(2)×tlog(Volumelast−Volumefirst) DT
=
log
(
2
)
×
t
log
(
Volumelast
−
Volumefirst
)
and t is time in months between the first and the last visit.
Get Radiology Tree app to read full this article<
Descriptive Statistics
Get Radiology Tree app to read full this article<
Get Radiology Tree app to read full this article<
Get Radiology Tree app to read full this article<
Get Radiology Tree app to read full this article<
Get Radiology Tree app to read full this article<
Results
Get Radiology Tree app to read full this article<
Table 1
Demographics
Race Percent Diagnosis Percent African-American 23.08 Biliary 5.77 Asian 19.23 Alcoholism 3.85 Caucasian 42.31 Hepatitis B 17.31 Hispanic 1.92 Hepatitis C 63.46 Other 13.46 Other 3.85 Unknown 5.77
Table 2
Tumor Growth Rates (GR) and Doubling Times (DT)

Growth rates in centimeter per month and doubling time in months.
Get Radiology Tree app to read full this article<
Get Radiology Tree app to read full this article<
Get Radiology Tree app to read full this article<
Get Radiology Tree app to read full this article<
Get Radiology Tree app to read full this article<
Get Radiology Tree app to read full this article<
Get Radiology Tree app to read full this article<
Get Radiology Tree app to read full this article<
Kappa Values
Get Radiology Tree app to read full this article<
Table 3
Kappa Values to Assess Agreement Among Readers: Assessment of All HCC and Precursor Lesions
Variable Kappa Standard Error_z__P_ Value T1 0.55344 0.030946 17.8840 <.0001 T2 0.57725 0.034807 16.5841 <.0001 Fat on DGRE 0.63716 0.042914 14.8473 <.0001
HCC, hepatocellular carcinoma; DGRE, Dual gradient-echo.
Get Radiology Tree app to read full this article<
Discussion
Get Radiology Tree app to read full this article<
Get Radiology Tree app to read full this article<
Get Radiology Tree app to read full this article<
Get Radiology Tree app to read full this article<
Get Radiology Tree app to read full this article<
Get Radiology Tree app to read full this article<
Get Radiology Tree app to read full this article<
Get Radiology Tree app to read full this article<
Conclusions
Get Radiology Tree app to read full this article<
Get Radiology Tree app to read full this article<
References
1. http://optn.transplant.hrsa.gov/PoliciesandBylaws2/policies/pdfs/policy_8.pdf .
2. Duffy J.P., Vardanian A., Benjamin E., et. al.: Liver transplantation criteria for hepatocellular carcinoma should be expanded: a 22-year experience with 467 patients at UCLA. Ann Surg 2007 Sep; 246: pp. 502-509.
3. Zavaglia C., DeCarlis L., Alberta A.B., et. al.: Predictors of long-term survival after liver transplantation for hepatocellular carcinoma. Am J Gastroenterol 2005; 100: pp. 2708-2716.
4. Coleman W.B.: Mechanisms of human hepatocarcinogenesis. Curr Mol Med 2003; 3: pp. 573-588.
5. Efremidis S.C., Hytiroglou P.: The multistep process of hepatocarcinogenesis in cirrhosis with imaging correlation. Eur Radiol 2002; 12: pp. 753-764.
6. Shah T.U., Sebeka R.C., Pamuklar E., et. al.: The risk of hepatocellular carcinoma in cirrhotic patients with small liver nodules on MRI. Am J Gastroenterol 2006; 101: pp. 533-540.
7. Kojiro M., Wanless I.R., Alves V., et. al.: Pathologic diagnosis of early hepatocellular carcinoma: a report of the international consensus group for hepatocellular neoplasia. Hepatology 2009; 49: pp. 658-664.
8. Goodman Z.D.: Neoplasms of the liver. Modern Pathology 2007; 20: pp. S49-S60.
9. Martin J., Sentis M., Zidan A., et. al.: Fatty metamorphosis of hepatocellular carcinoma: detection with chemical shift gradient-echo MR imaging. Radiology 1995 Apr; 195: pp. 125-130.
10. Kutami R., Nakashima Y., Nakashima O., et. al.: Pathomorphologic study on the mechanism of fatty change in small hepatocellular carcinoma of humans. J Hepatol 2000; 33: pp. 282-289.
11. Choi D., Mitchell D.G., Vera S.K., et. al.: Hepatocellular carcinoma with indeterminate or false negative initial MR imaging: effect on eligibility for curative treatment—initial observations. Radiology 2007; 244: pp. 776-783.
12. Furlan A., Marin D., Agnello F., et. al.: Hepatocellular carcinoma presenting at contrast-enhanced multi-detector-row computed tomography or gadolinium-enhanced magnetic resonance imaging as a small (≤2 cm), indeterminate nodule: growth rate and optimal interval time for imaging follow-up. J Comput Assist Tomogr 2012 Jan-Feb; 36: pp. 20-25.
13. http://www.acr.org/Quality-Safety/Resources/LI-RADS .
14. Earls J.P., Rofsky N.M., DeCorato D.R., et. al.: Breath-hold single-dose gadolinium-enhanced three-dimensional MR aortography: usefulness of a timing examination and MR power injector. Radiology 1996 Dec; 201: pp. 705-710.
15. Schwartz M.: A biomathematical approach to clinical tumor growth. Cancer 1961; 14: pp. 1272-1294.
16. Lee M.H., Kim S.H., Park M.J., et. al.: Gadoxetic acid–enhanced hepatobiliary phase MRI and high-b-value diffusion-weighted imaging to distinguish well-differentiated hepatocellular carcinomas from benign nodules in patients with chronic liver disease. AJR Am J Roentgenol 2011 Nov; 197: pp. W868-W875.
17. Bartolozzi C., Ciano D., Donate F., et. al.: Focal liver lesions: MR imaging-pathologic correlation. Eur Radiol 2001; 11: pp. 1374-1388.
18. Honda H., Kaneko K., Kanazawa Y., et. al.: MR imaging of hepatocellular carcinomas: effect of Cu and Fe contents on signal intensity. Abdom Imaging 1997; 22: pp. 60-66.
19. Matsui O., Kadoya M., Kameyama T., et. al.: Adenomatous hyperplastic nodules in the cirrhotic liver: differentiation from hepatocellular carcinoma with MR imaging. Radiology 1989; 173: pp. 123-126.
20. Earls J.P., Theise N.D., Weinreb J.C., et. al.: Dysplastic nodules and hepatocellular carcinoma: thin-section MR imaging of explanted cirrhotic livers with pathologic correlation. Radiology 1996; 201: pp. 207-214.
21. Van den Bos I.C., Hussain S.M., Dwarkasing R.S., et. al.: MR imaging of hepatocellular carcinoma: relationship between lesion size and imaging findings, including signal intensity and dynamic enhancement patterns. J Magn Reson Imaging 2007; 26: pp. 1548-1555.
22. Muramatsu Y., Nawano S., Takayasu K., et. al.: Early hepatocellular carcinoma: MR imaging. Radiology 1991; 181: pp. 209-213.
23. Ebara M., Fukuda H., Kojima Y., et. al.: Small hepatocellular carcinoma: relationship of signal intensity to histopathologic findings and metal content of the tumor and surrounding hepatic parenchyma. Radiology 1999; 210: pp. 81-88.
24. Matsui O., Kadoya M., Kameyama T., et. al.: Benign and malignant nodules in cirrhotic livers: distinction based on blood supply. Radiology 1991; 178: pp. 493-497.
25. Kojiro M., Nakashima O.: Histopathologic evaluation of hepatocellular carcinoma with a special reference to small early stage tumor. Semin Liver Dis 1999; 19: pp. 287-296.
26. Shinmura R., Matsui O., Kobayashi S., et. al.: Cirrhotic nodules: association between MR imaging signal intensity and intranodular blood supply. Radiology 2005; 237: pp. 512-519.
27. Hyodo T., Murakami T., Imai Y., et. al.: Hypovascular nodules in patients with chronic liver disease: Risk factors for development of hypervascular hepatocellular carcinoma. Radiology 2013 Feb; 266: pp. 480-490.
28. Mitchell D.G., Palazzo J., Hann H., et. al.: Hepatocellular tumors with high signal on T1-weighted MR imaging: chemical shift MR imaging and histologic correlation. J Comput Assist Tom 1991; 15: pp. 762-769.
29. Kelekis N.L., Semelka R.C., Woosley J.T.: Malignant lesions of the liver with high signal intensity on T1-Weighted MR images. Journal of Magnetic Resonance Imaging 1996; 6: pp. 291-294.
30. Yu J.S., Chung J.J., Kim J.H., Kim K.W., et. al.: Fat-containing nodules in the cirrhotic liver: chemical shift MRI features and clinical implications. AJR 2007; 188: pp. 1009-1016.
31. Bali N.C., Befeler A.S., Bieneman B.K., et. al.: Fat containing HCC: findings on CT and MRI including serial contrast-enhanced imaging. Accad Radiol 2009; 16: pp. 963-968.
32. Yoshikawa J., Matsui O., Takashima T., et. al.: Fatty metamorphosis in hepatocellular carcinoma: radiologic features in 10 cases. AJR Am J Roentgenol 1988; 151: pp. 717-720.
33. Kobayashi S., Matsui O., Gabata T., et. al.: Gadolinium ethoxybenzyl diethylenetriamine pentaacetic acid-enhanced magnetic resonance imaging findings of borderline lesions at high risk for progression to hypervascular classic hepatocellular carcinoma. J Comput Assist Tomogr 2011; 35: pp. 181-186.
34. Sato M., Watanabe Y., Lee T., et. al.: Well-differentiated hepatocellular carcinoma: clinicopathological features and results of hepatic resection. Am J Gastroenterol 1995; 90: pp. 112-116.
35. Pupulim L.F., Hakim A., Barrau V., et. al.: Fatty hepatocellular carcinoma: radiofrequency ablation—imaging findings. Radiology March 2009; 250: pp. 940-948.
36. Matsui O.: Imaging of multistep human hepatocarcinogenesis by CT during intra-arterial contrast injection. Intervirology 2004; 47: pp. 271-276.
37. Takayasu K., Muramatsu Y., Mizuguchi Y., et. al.: Imaging of early hepatocellular carcinoma and adenomatous hyperplasia (dysplastic nodules) with dynamic CT and a combination of CT and angiography: experience with respected liver specimens. Intervirology 2004; 47: pp. 199-208.
38. Takayasu K., Muramatsu Y., Furukawa H., et. al.: Early hepatocellular carcinoma: appearance at CT during arterial portography and CT arteriography with pathologic correlation. Radiology 1995; 194: pp. 101-105.
39. Takayasu K., Furukawa H., Wakao F., et. al.: CT diagnosis of early hepatocellular carcinoma: sensitivity, findings, and CT-pathologic correlation. AJR Am J Roentgenol 1995; 164: pp. 885-890.
40. Yamamoto T., Kaneda K., Hirohashi K., et. al.: Sinusoidal capillarization and arterial blood supply continuously proceed with the advance of the stages of hepatocarcinogenesis in the rat. Jpn J Cancer Res 1996 May; 87: pp. 442-450.
41. Park Y.N., Kim Y.B., Yang K.M., et. al.: Increased expression of vascular endothelial growth factor and angiogenesis in the early stage of multistep hepatocarcinogenesis. Arch Pathol Lab Med 2000 Jul; 124: pp. 1061-1065.
42. Bruix J., Sherman M.: Management of hepatocellular carcinoma: an update. Hepatology 2011 March; 53: pp. 1020-1022.
43. European Association for the Study of the Liver, European Organisation for Research and Treatment of Cancer: Journal of Hepatology 2012; 56: pp. 908-943.
44. Kubota K., Ina H., Okada Y., et. al.: Growth rate of primary single hepatocellular carcinoma: determining optimal screening interval with contrast enhanced computed tomography. Dig Dis Sci 2003; 48: pp. 581-586.
45. Okada S., Okazaki N., Nose H., et. al.: Follow-up examination schedule of postoperative HCC patients based on tumor volume doubling time. Hepatogastroenterology 1993; 40: pp. 311-315.
46. Shea J.C., Sung J.L., Chen D.S., et. al.: Early detection of hepatocellular carcinoma by real-time ultrasonography. A prospective study. Cancer 1985; 56: pp. 660-666.
47. Yoshino M.: Growth kinetics of hepatocellular carcinoma. Jpn J Clin Oncol 1983; 13: pp. 45-52.
48. Taouli B., Goh J.S., Lu Y., et. al.: Growth rate of hepatocellular carcinoma: evaluation with serial computed tomography or magnetic resonance imaging. J Comput Assist Tomogr 2005; 29: pp. 425-429.