
Rationale and Objectives
Sodium magnetic resonance imaging (MRI) of the kidneys has been used to spatially map areas of sodium-concentrating activity and to quantify the corticomedullary sodium gradient in various physiologic and pathophysiologic conditions. In this case study, sodium MRI of a clinically well-functioning transplanted kidney was performed to determine whether its sodium gradient could be detected and quantified using this method.
Materials and Methods
Sodium MRI was performed on a 3T scanner with a commercial rectangular sodium surface coil placed on the lower abdomen over the palpable transplanted kidney. A three-dimensional gradient echo sequence, modified for multinuclear imaging, was applied to acquire 23 Na images.
Results
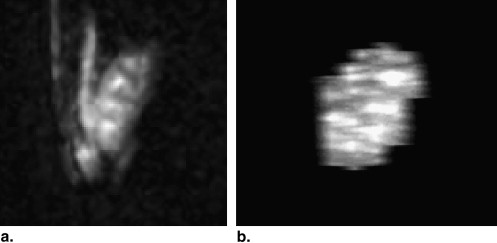
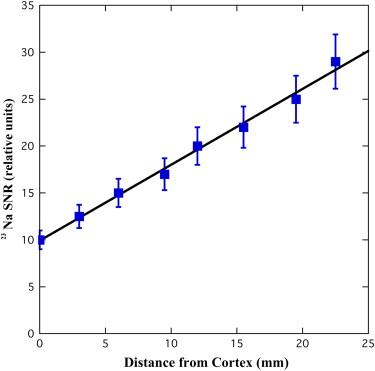
Five main renal pyramids within the medulla were detected, and the corticomedullary sodium gradient was quantified in each renal pyramid by both region of interest–based and pixel-by-pixel analyses, resulting in a mean medulla/cortex signal-to-noise ratio of 1.8 ± 0.1 ( n = 5) and a mean linear increase slope of 1.1 ± 0.1 relative arbitrary units per mm ( n = 5).
Conclusions
The feasibility and usability of 23 Na MRI of a human renal allograft was demonstrated. Further studies are required to determine the clinical significance of this technique in the follow-up of patients after renal transplantation.
Sodium magnetic resonance imaging (MRI) is a noninvasive tool to map the sodium spatial distribution in the imaged organ and has been described for various targeted applications . In the kidney, sodium MRI may have a unique role since a well functioning kidney will maintain a corticomedullary sodium gradient to keep body fluids and electrolytes in homeostasis .
In recent years, there have been several reports of using 23 Na MRI to noninvasively measure the corticomedullary sodium gradient in animal models . It has been shown that the sodium gradient measured by 23 Na MRI was linear, and sensitive to physiologic and pathophysiologic changes as diuresis , hydronephrosis , and acute tubular necrosis .
Get Radiology Tree app to read full this article<
Get Radiology Tree app to read full this article<
Materials and methods
Subject
Get Radiology Tree app to read full this article<
MRI Acquisition
Get Radiology Tree app to read full this article<
Data Processing and Image Analysis
Get Radiology Tree app to read full this article<
Get Radiology Tree app to read full this article<
Get Radiology Tree app to read full this article<
Results
Get Radiology Tree app to read full this article<
Get Radiology Tree app to read full this article<
Get Radiology Tree app to read full this article<
Get Radiology Tree app to read full this article<
Get Radiology Tree app to read full this article<
Get Radiology Tree app to read full this article<
Discussion
Get Radiology Tree app to read full this article<
Get Radiology Tree app to read full this article<
Get Radiology Tree app to read full this article<
Table 1
A Comparison between the Transplanted Kidney Sodium Data and Previously Studied Intact Kidneys
Transplanted Kidney ( n = 1) Intact Kidneys ( n = 6) SNR: whole kidney 19.6 18.2 ± 2.5 SNR: cortex 12.9 11.8 ± 1.3 SNR: medulla 28.3 28.3 ± 3.3 Number of renal pyramids 5.0 5.0 ± 0.2 Sodium gradient: Medulla/cortex ROI ratio 1.8 2.4 ± 0.1 Linear slope (Rel.u./mm) 1.1 ( r 2 = 0.98) 1.6 ± 0.2 ( r 2 = 0.96 ± 0.01)
SNR, signal-to-noise ratio; ROI, region of interest.
Get Radiology Tree app to read full this article<
Get Radiology Tree app to read full this article<
Get Radiology Tree app to read full this article<
Get Radiology Tree app to read full this article<
Acknowledgments
Get Radiology Tree app to read full this article<
References
1. Ouwerkerk R.: Sodium magnetic resonance imaging: from research to clinical use. J Am Coll Radiol 2007; 4: pp. 739-741.
2. Jamison R.L., Kriz W.: Urinary concentrating mechanism.1982.Oxford University Press, IncNew York
3. Maril N., Margalit R., Mispelter J., et. al.: Functional sodium magnetic resonance imaging of the intact rat kidney. Kidney Int 2004; 65: pp. 927-935.
4. Maril N., Margalit R., Mispelter J., et. al.: Sodium magnetic resonance imaging of diuresis: spatial and kinetic response. Magn Reson Med 2005; 53: pp. 545-552.
5. Maril N., Margalit R., Rosen S., et. al.: Detection of evolving acute tubular necrosis with renal 23Na MRI: studies in rats. Kidney Int 2006; 69: pp. 765-768.
6. Neuberger T., Gulani V., Webb A.: Sodium renal imaging in mice at high magnetic fields. Magn Reson Med 2007; 58: pp. 1067-1071.
7. Maril N., Rosen Y., Reynolds G.H., et. al.: Sodium MRI of the human kidney at 3 Tesla. Magn Reson Med 2006; 56: pp. 1229-1234.
8. Callaghan C.J., Bradley J.A.: Current status of renal transplantation. Methods Mol Biol 2006; 333: pp. 1-28.
9. Haacke E.M., Brown R.W., Thompson M.R., et. al.: 1999.John Wiley & SonsNew York
10. Grenier N., Hauger O., Delmas Y., et. al.: MR imaging of nephropathies. Abdom Imaging 2006; 31: pp. 213-223.