
Rationale and Objectives
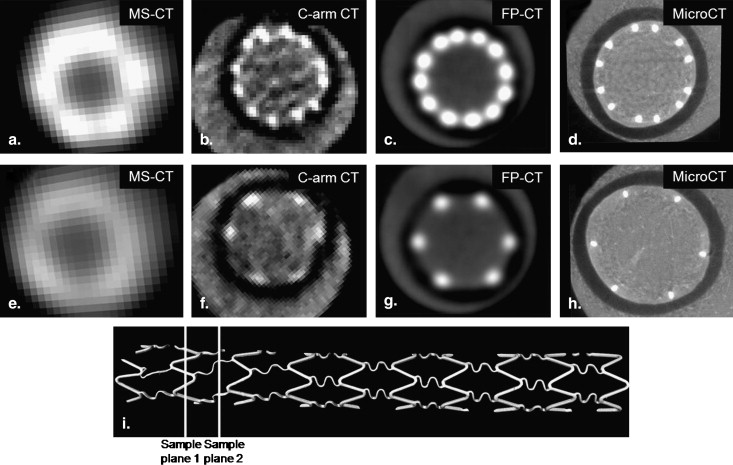
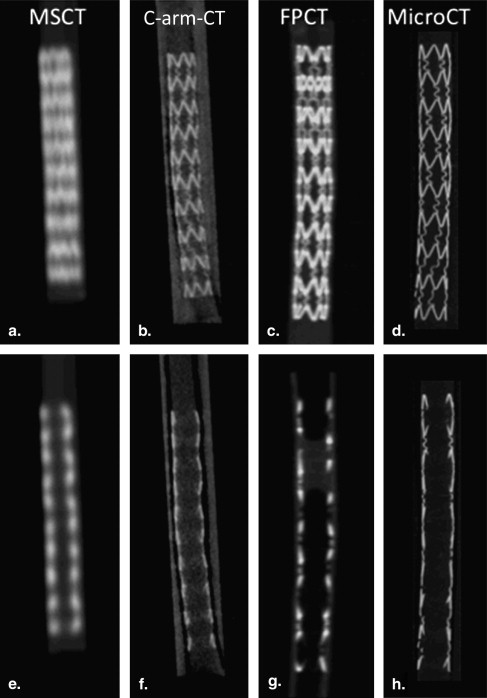
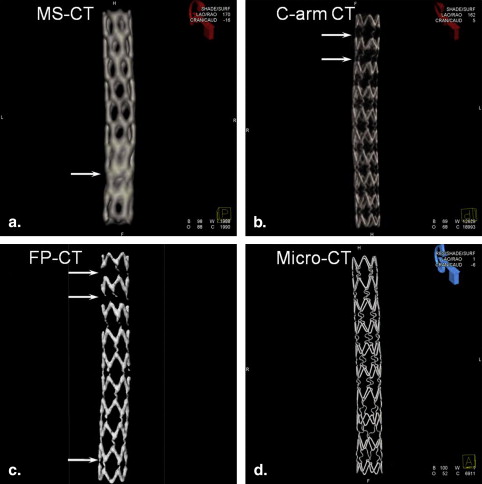
Small metallic stents are increasingly used in the treatment of cerebral aneurysms and for revascularization in ischemic strokes. Realistic three-dimensional datasets of a stent were obtained by using three x-ray–based imaging methods in current clinical use. Multislice-CT (MS-CT), C-arm flat detector-CT (C-arm CT, ACT), and flat panel-CT (FP-CT) were compared with high-resolution laboratory MicroCT scans that served as a reference standard. The purpose was to assess and compare the quality and accuracy of current clinical three-dimensional reconstructions of a vascular stents.
Material & Methods
A 3 × 20 mm Cypher stent was deployed in a straight polytetrafluoroethylene tube and filled with nondiluted iodine contrast and BaSO 4 . MS-CT images of the static tube phantom and stent were acquired using GE LightSpeed VCT Series, C-arm CT images were obtained using Artis (DynaCT, Siemens), FP-CT were obtained using a preclinical research CT (GE), and MicroCT images were obtained using eXplore Locus SP (GE). DICOM datasets were analyzed using Amira and Matlab.
Results
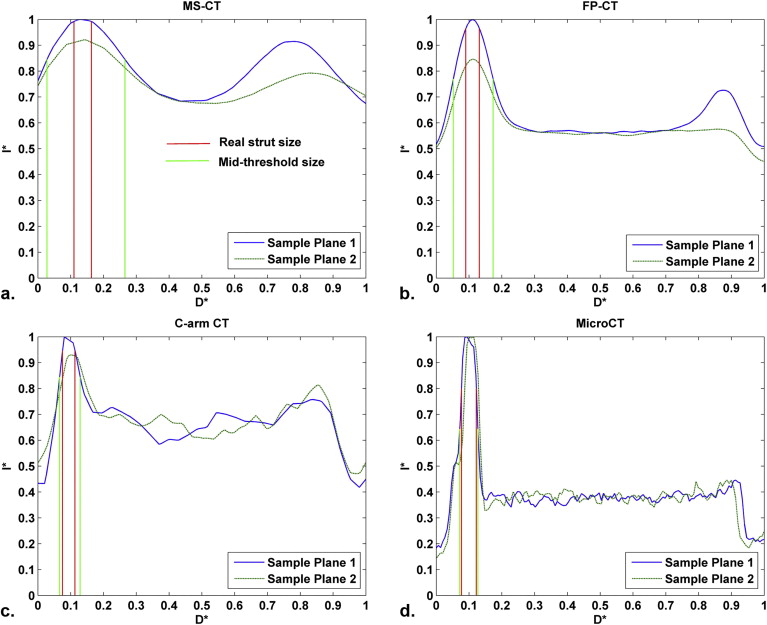
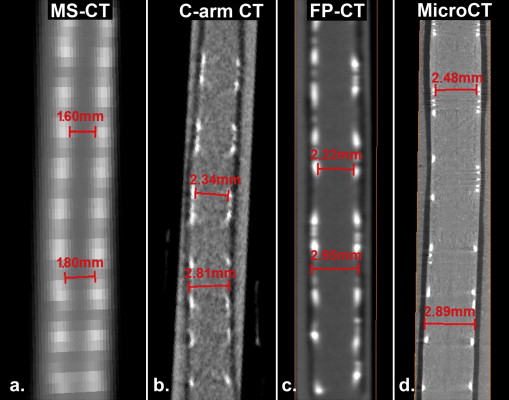
Because of blooming effects, the maximum intensity projections (MIPs) and volume renderings generated from MS-CT showed significantly increased strut dimensions with no distinction between the regular struts and connector struts while the lumen diameter is artificially reduced. The shape of the reconstructed stent surface differed remarkably from the real stent. C-arm CT and FP-CT volume renderings more accurately represented the struts. Consistently capturing the structure of the connectors and the strut shape definition was highly threshold dependent. The stent lumen was about 30% underestimated by MS-CT when compared to MicroCT.
Conclusion
The spatial resolution of current clinical CT for imaging of small metallic stents is insufficient to visualize fine geometrical details. Further improvement in the spatial resolution of clinical imaging technologies combined with better software and hardware for image postprocessing will be necessary for detailed structural analysis, evaluation of the stent lumen in vivo, and to permit accurate assessment of stent patency and early detection potential in-stent stenosis.
X-ray computed tomographic (CT) angiography plays a major role as the primary imaging tool for the diagnosis of vascular disease, such as coronary and cerebrovascular arteriosclerosis. It has also become increasingly popular for planning endovascular therapy, postprocedure control, and follow-up exams to detect in-stent stenosis or stent thrombosis. Because of increased temporal and spatial resolution, 64-multislice CT (MS-CT) systems are capable of providing more accurate visualization of small arteries and stented lesions . In a recent multicenter trial, MS-CT has reached a sensitivity of 99% to detect significant coronary artery disease. On the other hand, the specificity remained at 68%, still relatively low, which in part was due to blooming effects, compromising diagnostic accuracy especially in calcified lesions .
Several CT artifacts make sufficiently accurate visualization of a small stent lumen and its patency a similarly challenging problem , especially in stents with <3 mm diameter . Blooming effects occur because of beam hardening, causing the struts to appear thicker and resulting in underestimation of the inner stent lumen . Partial volume effects can occur when an object lying off-center protrudes partially into the x-ray beam . Partial volume averaging is based on limited spatial resolution yielding a CT number that represents the average attenuation with a given voxel.
Get Radiology Tree app to read full this article<
Get Radiology Tree app to read full this article<
Get Radiology Tree app to read full this article<
Get Radiology Tree app to read full this article<
Get Radiology Tree app to read full this article<
Materials and methods
Three-dimensional Reconstruction of the Stent and Vessel Wall
Get Radiology Tree app to read full this article<
Get Radiology Tree app to read full this article<
Table 1
Imaging Detector Resolution and Reconstruction Dataset Voxel Size
Scanner Primary Application Measured (M) or Vendor-supplied (V) Spatial Resolution Stent Image Voxel Size (mm) MS-CT (VCT) Clinical 0.74 mm STD, 0.37 mm EDGE (V) 0.18 × 0.18 × 0.625 FP-CT Preclinical 0.26 mm STD (M) ∗ 0.04 × 0.04 × 0.04 C-arm CT Clinical 0.13 mm (V) 0.096 × 0.096 × 0.096 Micro-CT Preclinical 0.04 mm (V) 0.014 × 0.014 × 0.014
CT, computed tomography; FP, flat panel; MS, multislice; VCT, volumetric CT.
Get Radiology Tree app to read full this article<
Get Radiology Tree app to read full this article<
Get Radiology Tree app to read full this article<
Get Radiology Tree app to read full this article<
Get Radiology Tree app to read full this article<
Get Radiology Tree app to read full this article<
Stent and Vessel Wall Surface
Get Radiology Tree app to read full this article<
Get Radiology Tree app to read full this article<
Get Radiology Tree app to read full this article<
Results
Get Radiology Tree app to read full this article<
Get Radiology Tree app to read full this article<
Get Radiology Tree app to read full this article<
Table 2
Lumen Measurements at Several Locations Along the Stent
MS-CT C-arm CT FP-CT MicroCT Threshold = 2100 Threshold = 1900 Threshold = 16,000 Threshold = 5000 Threshold = 8000 1.5 (mm) 1.1 (mm) 2.2 (mm) 1.9 (mm) 2.5 (mm) 1.7 1.2 2.3 2 2.3 1.6 1.3 2.1 2.1 2.5 1.7 1.5 2.4 2.0 2.5 1.8 1.5 2.0 2.1 2.5 1.9 1.2 1.4 1.5
The lumen diameter was estimated by measuring the distance between the luminal edges of the struts.
CT, computed tomography; FP, flat panel; MS, multislice; VCT, volumetric CT.
Get Radiology Tree app to read full this article<
Get Radiology Tree app to read full this article<
Get Radiology Tree app to read full this article<
Get Radiology Tree app to read full this article<
Get Radiology Tree app to read full this article<
Get Radiology Tree app to read full this article<
Get Radiology Tree app to read full this article<
Get Radiology Tree app to read full this article<
Discussion
Get Radiology Tree app to read full this article<
Get Radiology Tree app to read full this article<
Get Radiology Tree app to read full this article<
Get Radiology Tree app to read full this article<
Get Radiology Tree app to read full this article<
Get Radiology Tree app to read full this article<
Get Radiology Tree app to read full this article<
Get Radiology Tree app to read full this article<
Get Radiology Tree app to read full this article<
Get Radiology Tree app to read full this article<
Conclusion
Get Radiology Tree app to read full this article<
Get Radiology Tree app to read full this article<
References
1. Otsuka M., Tanimoto S., Sianos G., et. al.: “Radio-lucent” and “radio-opaque” coronary stents characterized by multislice computed tomography. Int J Cardiol 2009; 132: e8–10
2. Pugliese F., Mollet N.R., Hunink M.G., et. al.: Diagnostic performance of coronary CT angiography by using different generations of multisection scanners: single-center experience. Radiology 2008; 246: pp. 384-393.
3. Rollano-Hijarrubia E., Stokking R., van der Meer F., et. al.: Imaging of small high-density structures in CT A phantom study. Acad Radiol 2006; 13: pp. 893-908.
4. Meijboom W.B., Meijs M.F., Schuijf J.D., et. al.: Diagnostic accuracy of 64-slice computed tomography coronary angiography: a prospective, multicenter, multivendor study. J Am Coll Cardiolv 2008; 52: pp. 2135-2144.
5. Pugliese F., Cademartiri F., van Mieghem C., et. al.: Multidetector CT for visualization of coronary stents. Radiographics 2006; 26: pp. 887-904.
6. Pugliese F., Gruszczynska K., Alberghina F., et. al.: Coronary computed tomography angiography in patients after percutaneous coronary intervention (PCI): focus on post-processing and visualization techniques. Med Sci Monit 2007; 13: pp. 152-157.
7. Pugliese F., Weustink A.C., Van Mieghem C., et. al.: Dual source coronary computed tomography angiography for detecting in-stent restenosis. Heart 2008; 94: pp. 848-854.
8. Jung I.J., Koepfli P., Husmann L., et. al.: Multidetector CT Imaging of coronary artery stents: is this method ready for use. Korean Circ J 2007; 37: pp. 521-529.
9. Barrett J.F., Keat N.: Artifacts in CT: recognition and avoidance. Radiographics 2004; 24: pp. 1679-1691.
10. Nieman K., Cademartiri F., Raaijmakers R., et. al.: Noninvasive angiographic evaluation of coronary stents with multi-slice spiral computed tomography. Herz 2003; 28: pp. 136-142.
11. Cademartiri F., Palumbo A.A., Maffei E., et. al.: Non invasive imaging of coronary arteries with 64-slice CT and 1.5T MRI: challenging invasive techniques. Acta Biomed 2007; 78: pp. 6-15.
12. Maintz D., Seifarth H., Flohr T., et. al.: Improved coronary artery stent visualization and in-stent stenosis detection using 16-slice computed-tomography and dedicated image reconstruction technique. Invest Radiol 2003; 38: pp. 790-795.
13. Schepis T., Koepfli P., Leschka S., et. al.: Coronary artery stent geometry and in-stent contrast attenuation with 64-slice computed tomography. Eur Radiol 2007; 17: pp. 1464-1473.
14. Boll D.T., Merkle E.M., Paulson E.K., et. al.: Coronary stent patency: dual-energy multidetector CT assessment in a pilot study with anthropomorphic phantom. Radiology 2008; 247: pp. 687-695.
15. Halpern E.J., Halpern D.J., Yanof J.H., et. al.: Is coronary stent assessment improved with spectral analysis of dual energy CT?. Acad Radiol 2009; 16: pp. 1241-1250.
16. de Ribamar Costa J., Mintz G.S., Carlier S.G., et. al.: Intravascular ultrasound assessment of drug-eluting stent expansion. Am Heart J 2007; 153: pp. 297-303.
17. Kume T., Akasaka T., Kawamoto T., et. al.: Visualization of neointima formation by optical coherence tomography. Int Heart J 2005; 46: pp. 1133-1136.
18. Choo K.S., Lee T.H., Choi C.H., et. al.: Assessment of the intracranial stents patency and re-stenosis by 16-slice CT angiography with optimized sharp kernel: preliminary study. J Korean Neurosurg Soc 2009; 45: pp. 284-288.
19. Turk A.S., Rowley H.A., Niemann D.B., et. al.: CT angiographic appearance of in-stent restenosis of intracranial arteries treated with the Wingspan stent. AJNR Am J Neuroradiol 2007; 28: pp. 1752-1754.
20. Levy E.I., Turk A.S., Albuquerque F.C., et. al.: Wingspan in-stent restenosis and thrombosis: incidence, clinical presentation, and management. Neurosurgery 2007; 61: pp. 644-650. discussion 50–51
21. Benndorf G., Claus B., Strother C.M., et. al.: Increased cell opening and prolapse of struts of a neuroform stent in curved vasculature: value of angiographic computed tomography: technical case report. Neurosurgery 2006; 58: ONS-E380; discussion ONS-E
22. Benndorf G., Ionescu M., Alvarado M.V.Y., et. al.: Wall shear stress in intracranial self-expanding stents studied using ultra-high-resolution 3D reconstructions. AJNR Am J Neuroradiol 2009; 30: pp. 479-486.
23. Alvarado M.V.Y., Ebrahimi N., Benndorf G.: Study of conformability of the new LEO PLUS stent to a curved vascular model using flat-panel detector computed tomography (DynaCT). Neurosurgery 2009; 64: pp. S130-S134.
24. Ebrahimi N., Claus B., Lee C.Y., et. al.: Stent conformity in curved vascular models with simulated aneurysm necks using flat-panel CT: an in vitro study. AJNR Am J Neuroradiol 2007; 28: pp. 823-829.
25. Buhk J.H., Lingor P., Knauth M.: Angiographic CT with intravenous administration of contrast medium is a noninvasive option for follow-up after intracranial stenting. Neuroradiology 2008; 50: pp. 349-354.
26. Benndorf G., Strother C.M., Claus B., et. al.: Angiographic CT in cerebrovascular stenting. AJNR Am J Neuroradiol 2005; 26: pp. 1813-1818.
27. Mahnken A.H., Seyfarth T., Flohr T., et. al.: Flat-panel detector computed tomography for the assessment of coronary artery stents—phantom study in comparison with 16-slice spiral computed tomography. Invest Radiol 2005; 40: pp. 8-13.
28. Schambach S.J., Bag S., Groden C., et. al.: Vascular imaging in small rodents using micro-CT. Methods 2010; 50: pp. 26-35.
29. Benndorf G., Ionescu M., Alvarado M.V.Y., et. al.: Anomalous hemodynamic effects of a self-expanding intracranial stent: comparing in-vitro and ex-vivo models using ultra-high resolution MicroCT based CFD. J Biomech 2010; 43: pp. 740-748.
30. Ross W., Cody D.D., Hazle J.D.: Design and performance characteristics of a digital flat-panel computed tomography system. Med Phys 2006; 33: pp. 1888-1901.
31. Chartrand-Lefebvre C., Cadrin-Chenevert A., Bordeleau E., et. al.: Coronary computed tomography angiography: overview of technical aspects, current concepts, and perspectives. Can Assoc Radiol J 2007; 58: pp. 92-108.
32. Sanz J., Dellegrottaglie S., Fuster V., et. al.: Calcium scoring and contrast-enhanced CT angiography. Curr Mol Med 2006; 6: pp. 525-539.
33. Dewey M., Hamm B.: CT coronary angiography: examination technique, clinical results, and outlook on future developments. Rofo 2007; 179: pp. 246-260.
34. van Werkum J.W., Heestermans A.A., Zomer A.C., et. al.: Predictors of coronary stent thrombosis: the Dutch Stent Thrombosis Registry. J Am Coll Cardiol 2009; 53: pp. 1399-1409.
35. Ebrahimi N., Nasseri F., Brunner T., et. al.: Improved visualization of self-expanding nitinol stents using 2K matrix for angiographic CT (DynaCT).2007.ASNR Seattle
36. Obenauer S., Dullin C., Heuser M.: Flat panel detector-based volumetric computed tomography (fpVCT): performance evaluation of volumetric methods by using different phantoms in comparison to 64-multislice computed tomography. Invest Radiol 2007; 42: pp. 291-296.