
Rationale and Objectives
Spectral computed tomography (CT) imaging is widely used in the diagnosis of various cancers. This study aimed to analyze the characteristics of lung squamous cell carcinoma (SC) and adenocarcinoma (AC) using spectral CT imaging.
Methods
Sixty patients who were examined via spectral CT imaging and confirmed as having AC or SC via surgery and pathology were enrolled in this research project. A spectrum CT scanner was used, and both plain and enhanced CT scans were conducted to acquire spectral images. All patients’ samples were used to detect the expression of thyroid transcription factor-1 (TTF-1) and epidermal growth factor receptor (EGFR) in cancer cells via immunohistochemical methods.
Results
Among the 27 cases with AC, 18 cases were identified as TTF-1 positive, 9 cases were found to be TTF-1 negative, 20 cases were confirmed as EGFR positive, and 7 cases were found to be EGFR negative. Among the 33 patients with SC, 6 cases were identified as TTF-1 positive, 27 cases were found to be TTF-1 negative, 19 cases were confirmed as EGFR positive, and 14 cases were found to be EGFR negative. No statistically significant differences were observed in normalized iodine concentration (NIC), K values, and calcium content between the TTF-1-positive and TTF-1-negative groups when considering patients. Statistically significant differences in NIC and K values were noted between the EGFR-positive and EGFR-negative groups among patients with AC, but no such difference was observed regarding calcium content. Significant differences in NIC, K values, and calcium content were observed between the EGFR-positive and EGFR-negative groups among patients with SC.
Conclusions
In lung cancer cells, the parameters of spectral CT imaging, including NIC and K values, reflect the microvessel density and blood supply. Calcium content is an indicator of the growth status of lung SC.
Introduction
Currently, lung cancer is the most common malignancy and has the highest morbidity and mortality rates worldwide, and its incidence and mortality rate tend to increase with age . Given the increasing aging population, extensive attention has been focused on the increasing morbidity associated with lung cancer and the deaths caused by lung cancer. Certainly, smoking is the main cause of lung cancer, along with certain environmental factors, and rates of lung cancer differ distinctly based on age, sex, race, occupation, and geography . The heterogeneity and complexity of lung cancer are determined by genes that play crucial roles in its occurrence, type, development, and prognosis . According to the World Health Organization classification system for lung tumors, from a clinical standpoint, lung carcinomas are broadly divided into non–small cell lung carcinoma (NSCLC) and small cell lung carcinoma (SCLC). NSCLC is usually classified into squamous cell carcinoma (SC), adenocarcinoma (AC), and large cell carcinoma . The SC is the most common type of lung cancer, and it is closely related to smoking .
Despite the various research projects that have been conducted and great medical progress, a cure for lung cancer is not an achievable goal at present . However, we can improve the diagnosis and treatment of this disease. Immunohistochemical staining techniques can localize certain antigens in tissue through a specific antigen-antibody reaction , and these techniques can further differential diagnosis of tumors . Immunohistochemical staining techniques also play an important role in the histologic classification of tumors and their pathologic analysis, as well as in the choice of clinical treatment and the determination of operation scope . Immunohistochemical detection is highly accurate in the diagnosis of lung cancer, and its role has been widely recognized. Spectral computed tomography (CT) imaging systems are frequently used as a diagnostic tool in various cancers because of their tremendous applications and advantages . The density of materials and images at different levels of kiloelectron volts (keV) can be obtained from the spectral CT imaging. Spectral CT imaging is also capable of displaying the x-ray attenuation coefficient changed with the x-ray energy, at different lesions and tissues, offering valuable insights into the elemental composition of tissue and paving the way for novel CT contrast agents by detecting element-specific patterns . Moreover, spectral CT imaging is used to create spectral analysis graphs and spectral attenuation curves for lesions and to carry out multiparameter quantitative analysis, which may reflect the histologic characteristics of a lesion to a certain extent .
Get Radiology Tree app to read full this article<
Materials and Methods
Clinical Data
Get Radiology Tree app to read full this article<
Examination Methods
Get Radiology Tree app to read full this article<
IHC and Gene Expression
Get Radiology Tree app to read full this article<
Get Radiology Tree app to read full this article<
Statistical Analysis
Get Radiology Tree app to read full this article<
Results
Positivity or Negativity of TTF-1 and EGFR in Patients with ACs and SCs
Get Radiology Tree app to read full this article<
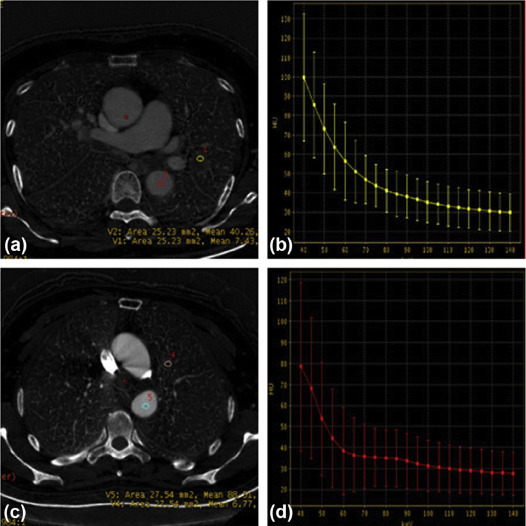
Spectrum Parameters of the TTF-1-Positive and TTF-1-Negative Groups Among Patients with ACs
Get Radiology Tree app to read full this article<
![Figure 2, The statistical results of spectrum parameters of thyroid transcription factor-1 (TTF-1)-positive and TTF-1-negative groups among patients with ACs ( P > .05 for normalized iodine concentration [NIC], K value, and calcium content). (Color version of figure is available online.)](https://storage.googleapis.com/dl.dentistrykey.com/clinical/SpectralCTImagingofLungCancer/1_1s20S1076633218302009.jpg)
Get Radiology Tree app to read full this article<
Spectrum Parameters of the TTF-1-Positive and TTF-1-Negative Groups Among Patients with SCs
Get Radiology Tree app to read full this article<
![Figure 3, The statistical results of spectrum parameters of thyroid transcription factor-1 (TTF-1)-positive and TTF-1-negative groups among patients with SCs ( P > .05 for normalized iodine concentration [NIC], K value, and calcium content). (Color version of figure is available online.)](https://storage.googleapis.com/dl.dentistrykey.com/clinical/SpectralCTImagingofLungCancer/2_1s20S1076633218302009.jpg)
Get Radiology Tree app to read full this article<
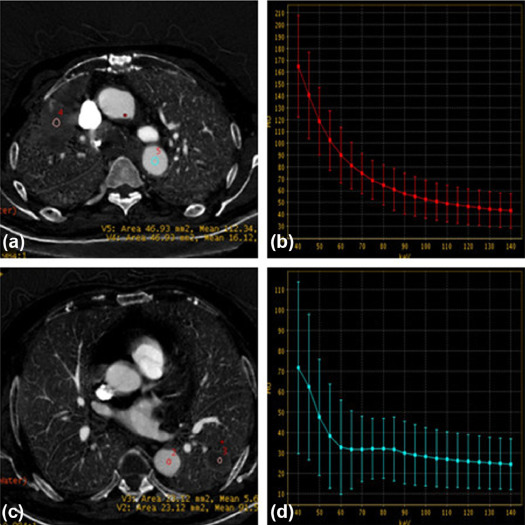
Spectrum Parameters of the EGFR-Positive and EGFR-Negative Groups Among Patients with ACs
Get Radiology Tree app to read full this article<
![Figure 4, The statistical results of spectrum parameters of epidermal growth factor receptor (EGFR)-positive and EGFR-negative groups among patients with ACs ( P < .05 for normalized iodine concentration [NIC] and K value; P > .05 for calcium content). (Color version of figure is available online.)](https://storage.googleapis.com/dl.dentistrykey.com/clinical/SpectralCTImagingofLungCancer/3_1s20S1076633218302009.jpg)
Get Radiology Tree app to read full this article<
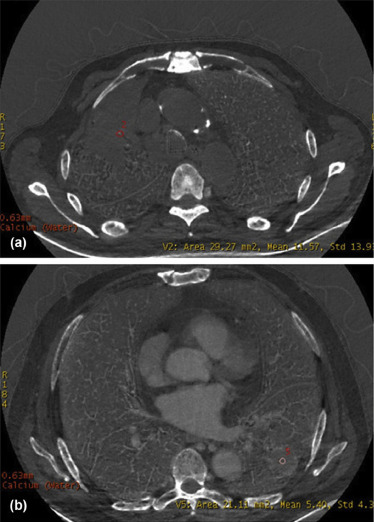
Spectrum Parameters of the EGFR-Positive and EGFR-Negative Groups Among Patients with SCs
Get Radiology Tree app to read full this article<
![Figure 6, The statistical results of spectrum parameters of epidermal growth factor receptor (EGFR)-positive and EGFR-negative groups among patients with SCs ( P < .05 for normalized iodine concentration [NIC], K value, and calcium content). (Color version of figure is available online.)](https://storage.googleapis.com/dl.dentistrykey.com/clinical/SpectralCTImagingofLungCancer/5_1s20S1076633218302009.jpg)
Get Radiology Tree app to read full this article<
Discussion
Get Radiology Tree app to read full this article<
Get Radiology Tree app to read full this article<
Get Radiology Tree app to read full this article<
Get Radiology Tree app to read full this article<
Get Radiology Tree app to read full this article<
Get Radiology Tree app to read full this article<
References
1. Bosetti C., Bertuccio P., Malvezzi M., et. al.: Cancer mortality in Europe, 2005–2009, and an overview of trends since 1980. Ann Oncol 2013; 24: pp. 2657-2671.
2. Radziszewska A., Karczmarek-Borowska B., Gradalska-Lampart M., et. al.: [Epidemiology, prevention and risk morbidity factors for lung cancer]. Pol Merkur Lekarski 2015; 38: pp. 113-118.
3. Torre L.A., Siegel R.L., Jemal A.: Lung cancer statistics. Adv Exp Med Biol 2016; 893: pp. 1-19.
4. Vogelstein B., Papadopoulos N., Velculescu V.E., et. al.: Cancer genome landscapes. Science 2013; 339: pp. 1546-1558.
5. Travis W.D., Brambilla E., Nicholson A.G., et. al.: The 2015 World Health Organization Classification of lung tumors: impact of genetic, clinical and radiologic advances since the 2004 classification. J Thorac Oncol 2015; 10: pp. 1243-1260.
6. Filipits M.: New developments in the treatment of squamous cell lung cancer. Curr Opin Oncol 2014; 26: pp. 152-158.
7. Petersen I., Warth A.: [Lung cancer. Developments, concepts and preview of the new WHO classification]. Pathologe 2014; 35: pp. 547-556.
8. Chandra V., Choi Y.B., Hwang H.L., et. al.: Immunohistochemical localization of LLC1 in human tissues and its limited expression in non-small cell lung cancer. Histol Histopathol 2015; 30: pp. 1111-1120.
9. Radu T.G., Mogoanta L., Busuioc C.J., et. al.: Histological and immunohistochemical aspects of papillary thyroid cancer. Rom J Morphol Embryol 2015; 56: pp. 789-795.
10. Im K.S., Kim N.H., Lim H.Y., et. al.: Analysis of a new histological and molecular-based classification of canine mammary neoplasia. Vet Pathol 2014; 51: pp. 549-559.
11. Danad I., Fayad Z.A., Willemink M.J., et. al.: New applications of cardiac computed tomography: dual-energy, spectral, and molecular CT imaging. JACC Cardiovasc Imaging 2015; 8: pp. 710-723.
12. Mullner M., Schlattl H., Hoeschen C., et. al.: Feasibility of spectral CT imaging for the detection of liver lesions with gold-based contrast agents—a simulation study. Phys Med 2015; 31: pp. 875-881.
13. Li M., Zheng X., Gao F., et. al.: Spectral CT imaging of intranodular hemorrhage in cases with challenging benign thyroid nodules. Radiol Med 2016; 121: pp. 279-290.
14. Zhu X., Li H., Cao B., et. al.: [The research of clinical pathological features of ALK positive lung cancer in 525 patients and the discussion of detection methods]. Zhongguo Fei Ai Za Zhi 2014; 17: pp. 226-232.
15. Li Y., Pan Y., Wang R., et. al.: ALK-rearranged lung cancer in Chinese: a comprehensive assessment of clinicopathology, IHC, FISH and RT-PCR. PLoS ONE 2013; 8: e69016
16. Shan L., Lian F., Guo L., et. al.: Detection of ROS1 gene rearrangement in lung adenocarcinoma: comparison of IHC, FISH and real-time RT-PCR. PLoS ONE 2015; 10: e0120422
17. Wang B., Wang B., Zhang L., et. al.: [Correlation between expression of TUBB3/STMN1 and EGFR signaling pathway in non-small cell lung cancer]. Zhongguo Fei Ai Za Zhi 2013; 16: pp. 547-552.
18. Masroor M., Mir R., Javid J., et. al.: Cell free EGFR mRNA expression and implications for survival and metastasis in non-small cell lung cancer cases. Asian Pac J Cancer Prev 2015; 16: pp. 6445-6449.
19. Larsen A.K., Ouaret D., El Ouadrani K., et. al.: Targeting EGFR and VEGF(R) pathway cross-talk in tumor survival and angiogenesis. Pharmacol Ther 2011; 131: pp. 80-90.
20. Eberhard A., Kahlert S., Goede V., et. al.: Heterogeneity of angiogenesis and blood vessel maturation in human tumors: implications for antiangiogenic tumor therapies. Cancer Res 2000; 60: pp. 1388-1393.
21. Shanzhi W., Yiping H., Ling H., et. al.: The relationship between TTF-1 expression and EGFR mutations in lung adenocarcinomas. PLoS ONE 2014; 9: e95479
22. Kong X.Y., Du J., Feng Z.C.: [Temporal expression of thyroid transcription factor-1 in fetal and neonatal human lungs]. Zhongguo Dang Dai Er Ke Za Zhi 2006; 8: pp. 30-32.
23. Mine Y., Ito N., Tagawa M., et. al.: [Metastatic calcification associated with malignancy]. Gan No Rinsho 1988; 34: pp. 2044-2051.
24. Mahoney M.C., Shipley R.T., Corcoran H.L., et. al.: CT demonstration of calcification in carcinoma of the lung. AJR Am J Roentgenol 1990; 154: pp. 255-258.
25. Chbicheb S., Yao X., Rodeau J.L., et. al.: EGR1 expression: a calcium and ERK1/2 mediated PPARgamma-independent event involved in the antiproliferative effect of 15-deoxy-Delta12,14-prostaglandin J2 and thiazolidinediones in breast cancer cells. Biochem Pharmacol 2011; 81: pp. 1087-1097.