
Rationale and Objectives
Although spin-echo (SE) sequence has some advantages over gradient-echo sequence in brain imaging, gradient-echo sequence is commonly used for T1-weighted imaging (T1WI) at 3 T because contrast on SE T1WI is widely believed to be poor at 3 T. Recently, gray-white matter contrast on single-slice and multi-slice SE imaging with interslice gap was reported as better at 3 T than at 1.5 T. This study examined the feasibility of interleaved SE T1WI of the brain at 3 T. This study also examined whether presaturation pulse (PP) sufficiently suppresses intra-arterial signals because these signals tend to be hyperintense due to longer T1 at 3 T.
Materials and Methods
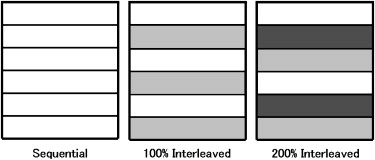
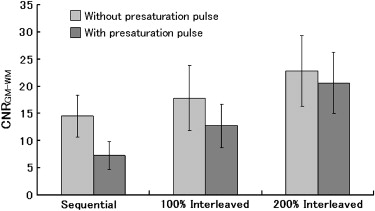
Subjects consisted of 18 healthy volunteers. Two sets of T1WI were performed using SE sequence. One set consisted of imaging without PP, and the other consisted of imaging with PP. Each set contained three types of gapless imaging as follows; sequential, 100% interleaved, and 200% interleaved imaging. In each subject, contrast-to-noise ratio between gray-matter and white-matter (CNR GM-WM ) and intra-arterial signals were evaluated.
Results
CNR GM-WM was significantly higher on interleaved images than on sequential images, regardless of PP ( P < .0001). PP sufficiently suppressed intra-arterial signals ( P < .0001).
Conclusion
CNR GM-WM on SE T1WI at 3 T can be improved by interleaved acquisition, and PP sufficiently suppressed intra-arterial signals. Interleaved SE T1WI with PP appears clinically feasible at 3 T.
Gradient-echo (GRE) magnetic resonance (MR) sequences, such as magnetization-prepared rapid acquisition gradient echo and spoiled gradient echo, are commonly used for T1-weighted imaging at 3 T , since the contrast between gray matter (GM) and white matter (WM) on spin-echo (SE) T1-weighted imaging is widely believed to be lower at 3 T than at 1.5 T . On the other hand, some reports assessed a better contrast-to-noise ratio at 3 T by using optimized parameters on SE T1-weighted sequence .
SE sequence has several advantages in use for T1-weighted imaging. One is that magnetic susceptibility artifacts are less prominent on SE sequence than on GRE sequence . Another advantage of SE sequence is that patent intra-arterial lumens appear hypointense (“flow-void”) on SE images, which enable differentiation between patent lumens and subacute intraluminal clots. On the other hand, GRE sequence appears not only intra-arterial subacute clots but also patent intra-arterial lumens as hyperintensity, so intra-arterial subacute clots could be easily missed on GRE . GRE imaging alone should not be used to determine the patency of aneurysms or cerebral arteriovenous malformations in the absence of corroborative images, particularly SE sequence . We recently demonstrated that contrast between GM and WM on single-slice SE T1-weighted MR images is better at 3 T than at 1.5 T . Moreover, we revealed that the influence of multi-slice imaging on contrast between GM and WM is significantly higher at 3 T than at 1.5 T, and suggested that SE T1-weighted imaging may be applicable at 3 T with sufficient interslice gap.
Get Radiology Tree app to read full this article<
Materials and methods
Subjects
Get Radiology Tree app to read full this article<
Imaging Protocols
Get Radiology Tree app to read full this article<
Get Radiology Tree app to read full this article<
Get Radiology Tree app to read full this article<
Analysis of Contrast-to-Noise Ratio (CNR)
Get Radiology Tree app to read full this article<
Get Radiology Tree app to read full this article<
Get Radiology Tree app to read full this article<
Analysis of Intra-arterial Signal
Get Radiology Tree app to read full this article<
Get Radiology Tree app to read full this article<
Results
Get Radiology Tree app to read full this article<
Get Radiology Tree app to read full this article<
Get Radiology Tree app to read full this article<
Table 1
Vertebral and Basilar Intra-arterial Signal Grade in 18 Volunteers
Sequential 100% Interleaved 200% Interleaved Without PP With PP Without PP With PP Without PP With PP Vertebral artery Grade 0 1 (6) 18 (100) 1 (6) 18 (100) 1 (6) 18 (100) Grade 1 2 (11) 0 (0) 4 (22) 0 (0) 4 (22) 0 (0) Grade 2 15 (83) 0 (0) 13 (72) 0 (0) 13 (72) 0 (0)P value <.0001 <.0001 <.0001 Basilar artery Grade 0 0 (0) 18 (100) 1 (6) 18 (100) 1 (6) 18 (100) Grade 1 10 (56) 0 (0) 4 (22) 0 (0) 4 (22) 0 (0) Grade 2 8 (44) 0 (0) 13 (72) 0 (0) 13 (72) 0 (0)P value <.0001 <.0001 <.0001
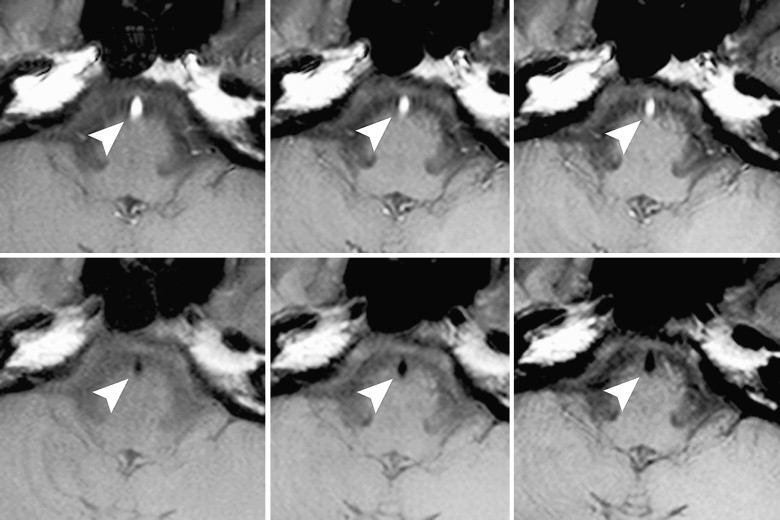
Vertebral and basilar intra-arterial signal grading with or without presaturation pulse (PP). Grade 0, no signal; grade 1, mixed signals; grade 2, entirely hyperintense signal. Intra-arterial signals were significantly diminished by application of PP. Percentages are shown in parentheses.
Get Radiology Tree app to read full this article<
Discussion
Get Radiology Tree app to read full this article<
Get Radiology Tree app to read full this article<
Get Radiology Tree app to read full this article<
Get Radiology Tree app to read full this article<
Get Radiology Tree app to read full this article<
Get Radiology Tree app to read full this article<
Conclusion
Get Radiology Tree app to read full this article<
References
1. Nobauer-Huhmann I.M., Ba-Ssalamah A., Mlynarik V., et. al.: Magnetic resonance imaging contrast enhancement of brain tumors at 3 tesla versus 1.5 tesla. Invest Radiol 2002; 37: pp. 114-119.
2. Sasaki M., Inoue T., Tohyama K., et. al.: High-field MRI of the central nervous system: current approaches to clinical and microscopic imaging. Magn Reson Med Sci 2003; 2: pp. 133-139.
3. Scarabino T., Nemore F., Giannatempo G.M., et. al.: 3.0 T magnetic resonance in neuroradiology. Eur J Radiol 2003; 48: pp. 154-164.
4. Ross J.S.: The high-field-strength curmudgeon. AJNR Am J Neuroradiol 2004; 25: pp. 168-169.
5. Kuhl C.K., Traber F., Schild H.H.: Whole-body high-field-strength (3.0-T) MR imaging in clinical practice. Part I. Technical considerations and clinical applications. Radiology 2008; 246: pp. 675-696.
6. Schmitz B.L., Gron G., Brausewetter F., et. al.: Enhancing gray-to-white matter contrast in 3 T T1 spin-echo brain scans by optimizing flip angle. AJNR Am J Neuroradiol 2005; 26: pp. 2000-2004.
7. Lu H., Nagae-Poetscher L.M., Golay X., et. al.: Routine clinical brain MRI sequences for use at 3.0 Tesla. J Magn Reson Imaging 2005; 22: pp. 13-22.
8. Farahani K., Sinha U., Sinha S., et. al.: Effect of field strength on susceptibility artifacts in magnetic resonance imaging. Comput Med Imaging Graph 1990; 14: pp. 409-413.
9. Yousem D.M., Balakrishnan J., Debrun G.M., et. al.: Hyperintense thrombus on GRASS MR images: potential pitfall in flow evaluation. AJNR Am J Neuroradiol 1990; 11: pp. 51-58.
10. Fushimi Y., Miki Y., Urayama S., et. al.: Gray matter-white matter contrast on spin-echo T1-weighted images at 3 T and 1.5 T: a quantitative comparison study. Eur Radiol 2007; 17: pp. 2921-2925.
11. Felmlee J.P., Ehman R.L.: Spatial presaturation: a method for suppressing flow artifacts and improving depiction of vascular anatomy in MR imaging. Radiology 1987; 164: pp. 559-564.
12. U.S. Department of Health and Human Services FDA, Center for Devices and Radiological Health Guidance for Industry and FDA Staff-Criteria for Significant Risk Investigations of Magnetic Resonance Diagnostic Devices. 2003. Available at: http://www.fda.gov/cdrh/ode/guidance/793.html . Accessed February 5, 2009.
13. Kneeland J.B., Shimakawa A., Wehrli F.W.: Effect of intersection spacing on MR image contrast and study time. Radiology 1986; 158: pp. 819-822.
14. Majumdar S., Sostman H.D., MacFall J.R.: Contrast and accuracy of relaxation time measurements in acquired and synthesized multislice magnetic resonance images. Invest Radiol 1989; 24: pp. 119-127.
15. Watanabe A., Boesch C., Obata T., et. al.: Effect of multislice acquisition on T1 and T2 measurements of articular cartilage at 3 T. J Magn Reson Imaging 2007; 26: pp. 109-117.
16. Chang Y., Bae S.J., Lee Y.J., et. al.: Incidental magnetization transfer effects in multislice brain MRI at 3.0 T. J Magn Reson Imaging 2007; 25: pp. 862-865.
17. Duvvuri U., Roberts D.A., Leigh J.S., et. al.: Magnetization transfer imaging of the brain: A quantitative comparison of results obtained at 1.5 and 4.0 T. J Magn Reson Imaging 1999; 10: pp. 527-532.
18. Melhem E.R., Jara H., Yucel E.K.: Multislice T1-weighted hybrid RARE in CNS imaging: assessment of magnetization transfer effects and artifacts. J Magn Reson Imaging 1996; 6: pp. 903-908.
19. Schmitz B.L., Aschoff A.J., Hoffmann M.H., et. al.: Advantages and pitfalls in 3 T MR brain imaging: a pictorial review. AJNR Am J Neuroradiol 2005; 26: pp. 2229-2237.
20. Mascalchi M., Bianchi M.C., Mangiafico S., et. al.: MRI and MR angiography of vertebral artery dissection. Neuroradiology 1997; 39: pp. 329-340.
21. Hirabuki N., Fujita N., Hashimoto T., et. al.: Follow-up MRI in dural arteriovenous malformations involving the cavernous sinus: emphasis on detection of venous thrombosis. Neuroradiology 1992; 34: pp. 423-427.
22. Oehler M.C., Schmalbrock P., Chakeres D., et. al.: Magnetic susceptibility artifacts on high-resolution MR of the temporal bone. AJNR Am J Neuroradiol 1995; 16: pp. 1135-1143.
23. Sakurai K., Fujita N., Harada K., et. al.: Magnetic susceptibility artifact in spin-echo MR imaging of the pituitary gland. AJNR Am J Neuroradiol 1992; 13: pp. 1301-1308.
24. Abduljalil A.M., Robitaille P.M.: Macroscopic susceptibility in ultra high field MRI. J Comput Assist Tomogr 1999; 23: pp. 832-841.
25. Abduljalil A.M., Kangarlu A., Yu Y., et. al.: Macroscopic susceptibility in ultra high field MRI. II: acquisition of spin echo images from the human head. J Comput Assist Tomogr 1999; 23: pp. 842-844.
26. Hori M., Okubo T., Uozumi K., et. al.: T1-weighted fluid-attenuated inversion recovery at low field strength: a viable alternative for T1-weighted intracranial imaging. AJNR Am J Neuroradiol 2003; 24: pp. 648-651.
27. Alibek S., Adamietz B., Cavallaro A., et. al.: Contrast-enhanced T1-weighted fluid-attenuated inversion-recovery BLADE magnetic resonance imaging of the brain: an alternative to spin-echo technique for detection of brain lesions in the unsedated pediatric patient?. Acad Radiol 2008; 15: pp. 986-995.