
Rationale and Objectives
The study aimed to evaluate the usefulness of dual-energy computed tomography (DECT) before and after calcium subtraction in the diagnosis of spinal bone bruise.
Materials and Methods
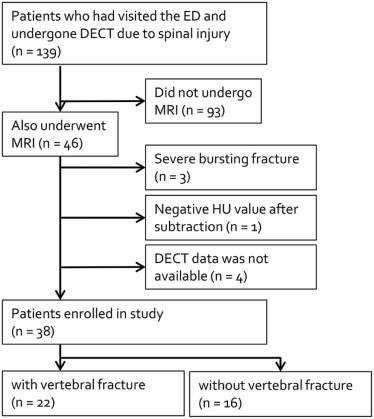
Among the patients who visited our emergency department between January 2013 and July 2014 who underwent both spinal DECT and magnetic resonance imaging, 38 patients (men:women = 25:13; mean age: 55.6 years, range: 28–82) were included. The patients were divided into two groups, those with and without acute spinal compression fracture, based on magnetic resonance imaging findings. In the fracture group ( n = 22), the ratio of Hounsfield unit (HU) values was calculated between the fracture level and the next normal inferior vertebra in the DECT before and after calcium subtraction. In the non-fracture group ( n = 16), the ratios of HU values were calculated between two normal adjacent vertebrae. The mean HU ratios were compared between the two groups.
Results
The mean HU ratio was higher in the fracture group (calcium subtraction: before: 1.57 and 1.59; after: 1.74 and 1.76) than the non-fracture group (before: 1.07 and 1.08; after: 1.07 and 1.07) ( P < 0.001). The mean HU ratio between before and after calcium subtraction images was different only in the fracture group ( P < 0.05). There was no significant difference in the area under the curve, sensitivity, specificity, positive and negative predictive values, and accuracy (before: 0.846, 87.5%, 81.2%, 87.5%, 81.2%, 85%; after: 0.865, 91.7%, 81.2%, 88%, 86.7%, 87.5% in high energy) between the images before and after calcium subtraction.
Conclusion
The HU ratio between the fractured and next normal vertebra was diagnostic for spinal bone bruise on DECT images both before and after calcium subtraction.
Introduction
Vertebral compression fractures are very common and are associated with decreased quality of life and increased mortality. Patients with a diagnosed vertebral compression fracture have 15% higher mortality rates than those without . Thus, accurate diagnosis and appropriate treatment are important for the improvement of mobility and function . However, the determination of a recent fracture is sometimes challenging, such as when the fractures are occult bone lesions (often referred to as bone bruises), which may not be revealed by conventional radiography, or when patients have multiple compression fractures of variable chronicity .
In acute vertebral compression fractures, such as those due to trauma, bone marrow lesions commonly present a “bone bruise” pattern, which is histologically heterogeneous in nature and associated with microtrabecular fractures of cancellous bone, hemorrhage, and swelling of the marrow with or without substantial disruption of the adjacent bone or overlying articular cartilage .
Get Radiology Tree app to read full this article<
Get Radiology Tree app to read full this article<
Get Radiology Tree app to read full this article<
Get Radiology Tree app to read full this article<
Materials and Methods
Patients
Get Radiology Tree app to read full this article<
Get Radiology Tree app to read full this article<
CT Protocol
Get Radiology Tree app to read full this article<
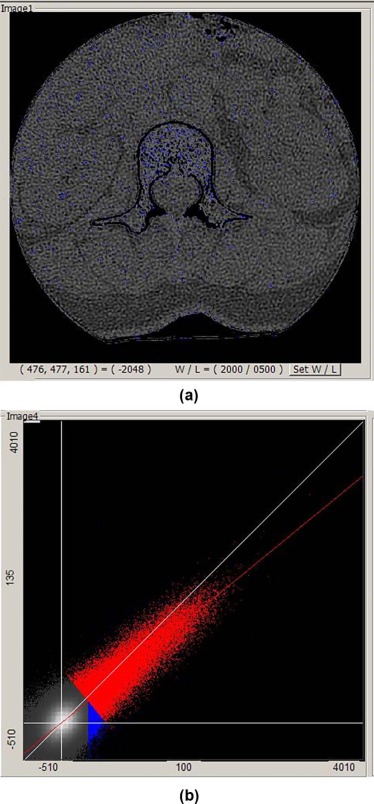
CT Image Reconstruction and Post-processing
Get Radiology Tree app to read full this article<
Get Radiology Tree app to read full this article<
MR Imaging Protocol
Get Radiology Tree app to read full this article<
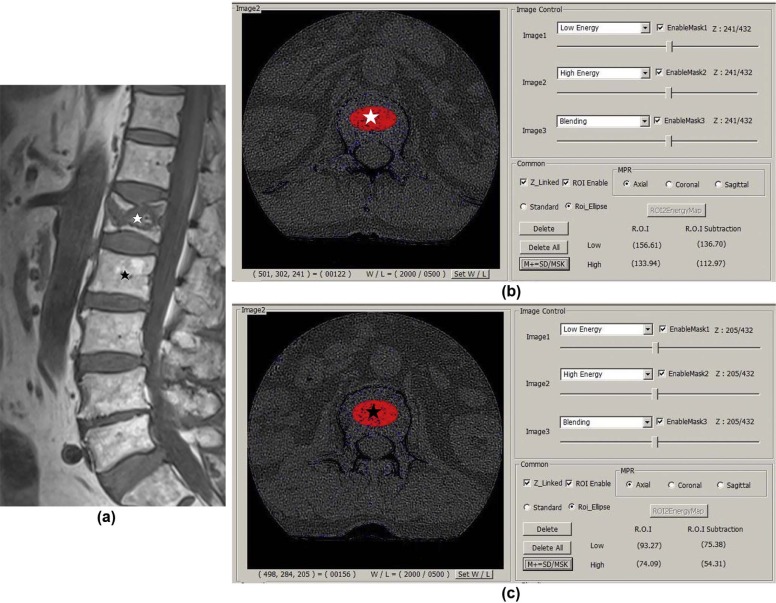
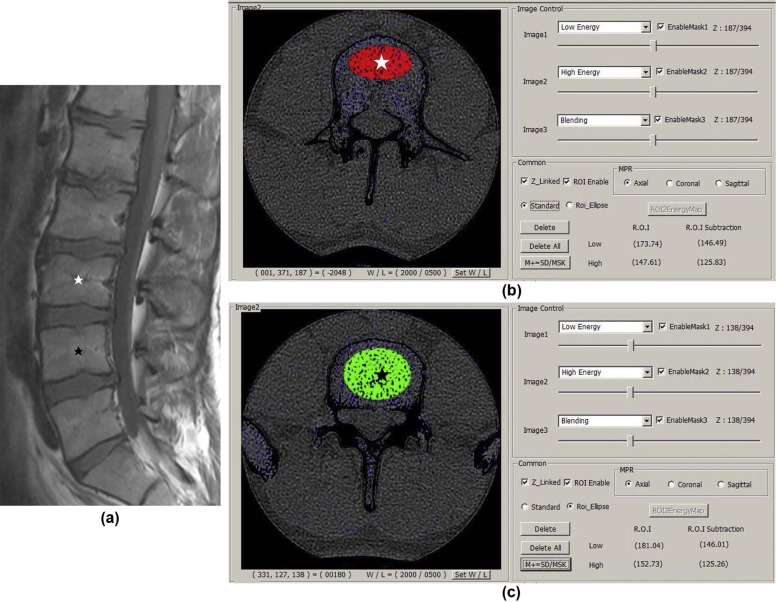
Image Analysis
Get Radiology Tree app to read full this article<
Get Radiology Tree app to read full this article<
Get Radiology Tree app to read full this article<
Statistical Analysis
Get Radiology Tree app to read full this article<
Get Radiology Tree app to read full this article<
Get Radiology Tree app to read full this article<
Results
Get Radiology Tree app to read full this article<
TABLE 1
HU Ratios Between Two Groups on Before and After Calcium Subtraction Images
Before Subtraction After Subtraction Low Energy (100 kVp) High Energy (135 kVp) Low Energy (100 kVp) High Energy (135 kVp) Fracture group ( n = 24) 1.57 ± 0.60 \* 1.59 ± 0.60 ** 1.74 ± 0.70 \* 1.76 ± 0.81 ** Non-fractured group ( n = 16) 1.07 ± 0.22 1.08 ± 0.25 1.07 ± 0.31 1.07 ± 0.31P value <0.001 <0.001 <0.001 <0.001
HU, Hounsfield unit.
Get Radiology Tree app to read full this article<
Get Radiology Tree app to read full this article<
Get Radiology Tree app to read full this article<
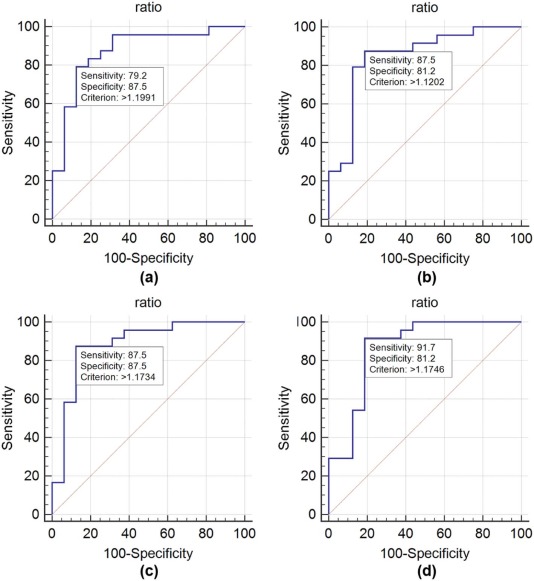
TABLE 2
Diagnostic Performances of HU Ratios From Before and After Calcium Subtraction Images in the Detection of Bone Marrow Contusion of Vertebral Compression Fractures
Sensitivity (%) Specificity (%) PPV (%) NPV (%) Accuracy (%) Before 100 kVp 79.2 87.5 90.5 73.7 82.5 135 kVp 87.5 81.2 87.5 81.2 85.0 After 100 kVp 87.5 87.5 91.3 82.4 87.5 135 kVp 91.7 81.2 88 86.7 87.5
HU, Hounsfield unit; NPV, negative predictive value; PPV, positive predictive value.
Get Radiology Tree app to read full this article<
Get Radiology Tree app to read full this article<
Get Radiology Tree app to read full this article<
TABLE 3
Mean HU Values of Fractured and Non-fractured Vertebrae on Before and After Calcium Subtraction Images in the Fracture Group ( n = 24)
Before Subtraction After Subtraction Low Energy (100 kVp) High Energy (135 kVp) Low Energy (100 kVp) High Energy (135 kVp) Fractured vertebrae 179.72 ± 52.39 154.06 ± 43.49 129.49 ± 32.70 107.39 ± 27.16 Non-fractured vertebrae 124.87 ± 50.34 107.72 ± 42.81 83.55 ± 32.96 69.29 ± 26.08P value 0.001 0.001 <0.001 <0.001
HU, Hounsfield unit.
Get Radiology Tree app to read full this article<
Get Radiology Tree app to read full this article<
Discussion
Get Radiology Tree app to read full this article<
Get Radiology Tree app to read full this article<
Get Radiology Tree app to read full this article<
Get Radiology Tree app to read full this article<
Get Radiology Tree app to read full this article<
Get Radiology Tree app to read full this article<
Conclusion
Get Radiology Tree app to read full this article<
Get Radiology Tree app to read full this article<
References
1. Agulnek A.N., O’Leary K.J., Edwards B.J.: Acute vertebral fracture. J Hosp Med 2009; 4: pp. E20-E24.
2. Longo U.G., Loppini M., Denaro L., et. al.: Conservative management of patients with an osteoporotic vertebral fracture: a review of the literature. J Bone Joint Surg Br 2012; 94: pp. 152-157.
3. Silverman S.L.: The clinical consequences of vertebral compression fracture. Bone 1992; 13: pp. S27-S31.
4. Boks S.S., Vroegindeweij D., Koes B.W., et. al.: Follow-up of occult bone lesions detected at MR imaging: systematic review. Radiology 2006; 238: pp. 853-862.
5. Wang C.K., Tsai J.M., Chuang M.T., et. al.: Bone marrow edema in vertebral compression fractures: detection with dual-energy CT. Radiology 2013; 269: pp. 525-533.
6. Mandalia V., Henson J.H.: Traumatic bone bruising–a review article. Eur J Radiol 2008; 67: pp. 54-61.
7. Thiryayi W.A., Thiryayi S.A., Freemont A.J.: Histopathological perspective on bone marrow oedema, reactive bone change and haemorrhage. Eur J Radiol 2008; 67: pp. 62-67.
8. Kazawa N.: T2WI MRI and MRI-MDCT correlations of the osteoporotic vertebral compressive fractures. Eur J Radiol 2012; 81: pp. 1630-1636.
9. Han I.H., Chin D.K., Kuh S.U., et. al.: Magnetic resonance imaging findings of subsequent fractures after vertebroplasty. Neurosurgery 2009; 64: pp. 740-744. discussion 744–745
10. Tanigawa N., Komemushi A., Kariya S., et. al.: Percutaneous vertebroplasty: relationship between vertebral body bone marrow edema pattern on MR images and initial clinical response. Radiology 2006; 239: pp. 195-200.
11. Bierry G., Venkatasamy A., Kremer S., et. al.: Dual-energy CT in vertebral compression fractures: performance of visual and quantitative analysis for bone marrow edema demonstration with comparison to MRI. Skeletal Radiol 2014; 43: pp. 485-492.
12. Henes F.O., Groth M., Kramer H., et. al.: Detection of occult vertebral fractures by quantitative assessment of bone marrow attenuation values at MDCT. Eur J Radiol 2014; 83: pp. 167-172.
13. Karaca L., Yuceler Z., Kantarci M., et. al.: The feasibility of dual-energy CT in differentiation of vertebral compression fractures. Br J Radiol 2016; 89: 20150300
14. Lell M.M., Ruehm S.G., Kramer M., et. al.: Cranial computed tomography angiography with automated bone subtraction: a feasibility study. Invest Radiol 2009; 44: pp. 38-43.
15. Johnson T.R., Krauss B., Sedlmair M., et. al.: Material differentiation by dual energy CT: initial experience. Eur Radiol 2007; 17: pp. 1510-1517.
16. Yeh B.M., Shepherd J.A., Wang Z.J., et. al.: Dual-energy and low-kVp CT in the abdomen. AJR Am J Roentgenol 2009; 193: pp. 47-54.
17. Guggenberger R., Gnannt R., Hodler J., et. al.: Diagnostic performance of dual-energy CT for the detection of traumatic bone marrow lesions in the ankle: comparison with MR imaging. Radiology 2012; 264: pp. 164-173.
18. Pache G., Krauss B., Strohm P., et. al.: Dual-energy CT virtual noncalcium technique: detecting posttraumatic bone marrow lesions–feasibility study. Radiology 2010; 256: pp. 617-624.
19. Kugel H., Jung C., Schulte O., et. al.: Age- and sex-specific differences in the 1H-spectrum of vertebral bone marrow. J Magn Reson Imaging 2001; 13: pp. 263-268.
20. Schellinger D., Lin C.S., Fertikh D., et. al.: Normal lumbar vertebrae: anatomic, age, and sex variance in subjects at proton MR spectroscopy–initial experience. Radiology 2000; 215: pp. 910-916.
21. Schick F., Einsele H., Bongers H., et. al.: Leukemic red bone marrow changes assessed by magnetic resonance imaging and localized 1H spectroscopy. Ann Hematol 1993; 66: pp. 3-13.
22. Schick F., Einsele H., Lutz O., et. al.: Lipid selective MR imaging and localized 1H spectroscopy of bone marrow during therapy of leukemia. Anticancer Res 1996; 16: pp. 1545-1551.