
Rationale and Objectives
This study aimed to compare sub-solid nodule detection performances (SSNDP) on chest computed tomography (CT) with Adaptive Iterative Dose Reduction using Three Dimensional Processing (AIDR 3D) between 7 mAs (0.21 mSv) and 42 mAs (1.28 mSv) in total and in subgroups classified by nodular size, characteristics, and location, and analyze the association of SSNDP with size-specific dose estimate (SSDE).
Materials and Methods
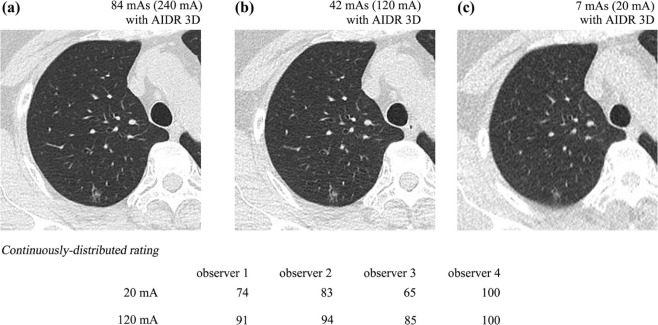
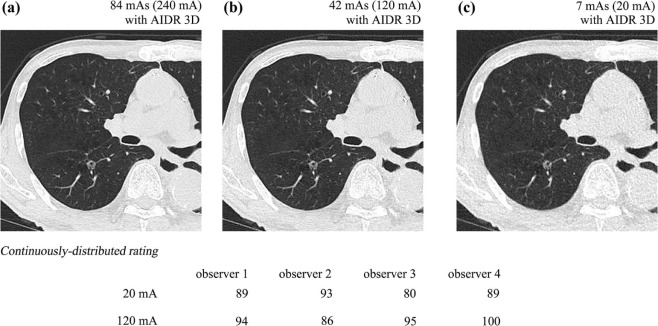
As part of the Area-detector Computed Tomography for the Investigation of Thoracic Diseases Study, a Japanese multicenter research project, 68 subjects underwent chest CT with 120 kV, 0.35 seconds per rotation, and three tube currents: 240 mA (84 mAs), 120 mA (42 mAs), and 20 mA (7 mAs). The research committee of the study project outlined and approved our study protocols. The institutional review board of each institution approved this study. Axial 2-mm-thick CT images were reconstructed using AIDR 3D. Standard reference was determined by CT images at 84 mAs. Four radiologists recorded SSN presence by continuously distributed rating on CT at 7 mAs and 42 mAs. Receiver operating characteristic analysis was used to evaluate SSNDP at both doses in total and in subgroups classified by nodular longest diameter (LD) (≥5 mm), characteristics (pure and part-solid), and locations (ventral, intermediate, or dorsal; central or peripheral; and upper, middle, or lower). Detection sensitivity was compared among five groups of SSNs classified based on particular SSDE to nodule on CT with AIDR 3D at 7 mAs.
Results
Twenty-two part-solid and 86 pure SSNs were identified. For larger SSNs (LD ≥ 5 mm) as well as subgroups classified by nodular locations and part-solid nodules, SSNDP was similar in both methods (area under the receiver operating characteristics curve: 0.96 ± 0.02 in CT at 7 mAs and 0.97 ± 0.01 in CT at 42 mAs), with acceptable interobserver agreements in five locations. For larger SSNs (LD ≥ 5 mm), on CT at 42 mAs, no significant differences in detection sensitivity were found among the five groups classified by SSDE, whereas on CT with 7 mAs, four groups with SSDE of 0.65 or higher were superior in detection sensitivity to the other group, with SSDE less than 0.65 mGy.
Conclusions
For SSNs with 5 mm or more in cases with normal range of body habitus, CT at 7 mAs was demonstrated to have comparable SSNDP to CT at 42 mAs regardless of nodular location and characteristics, and SSDE higher than 0.65 mGy is desirable to obtain sufficient SSNDP.
Introduction
Persistent sub-solid nodules (SSNs) can be a manifestation of pulmonary malignancies at an early stage and should be followed up at least 12 months later with a chest computed tomography (CT) from initial detection in cases with the diameter of 5 mm or more according to the management guideline by the Fleischner Society . However, carcinogenesis probability is higher proportionally with effective radiation dose, and further dose reduction with maintenance of image quality would be desirable .
Considerably reduced dose CT with comparable or slightly higher dose to chest X-ray using model-based iterative reconstruction (MBIR) (0.16–0.2 mSv) demonstrated the SSN detection performance comparable to reduced-dose CT with iterative reconstruction (IR) (0.92 mSv) or standard dose CT (11.2 mSv) . However, only relatively larger SSNs in small number were analyzed in these studies. Characteristics assessment of SSNs is clinically crucial because those with more solid-type components are associated with poorer prognosis . Subgroup analysis based on SSN characteristics was also not performed in these studies. In both pulmonary apical and paravertebral regions due to relative photon deficiency associated with larger body sections, nodular detectability on considerably reduced dose CT images without IR was reported to be inferior to that on CT images under a higher radiation dose . This disadvantage could be overcome by applying IR algorithm on CT images with considerably reduced dose. General positive impact of IR on nodule detection mainly due to noise reduction has already been demonstrated in many past studies. On the other hand, size-specific dose estimate (SSDE) corresponding to an individual image plane has been recently introduced as one of the more practicable dose adjustments on body cross sections , and SSDE in the transaxial plane including SSN can vary among nodular location even in an individual patient and may have an association with SSN detection performance. To the best of our knowledge, no past assessment in terms of the association of these background factors as described previously with SSN detection performance on considerably reduced dose CT image using iterative reconstruction has been performed.
Get Radiology Tree app to read full this article<
Materials and Methods
Get Radiology Tree app to read full this article<
Patients’ Populations
Get Radiology Tree app to read full this article<
Image Data Acquisition
Get Radiology Tree app to read full this article<
Get Radiology Tree app to read full this article<
Nodule Detection Study
Get Radiology Tree app to read full this article<
Association of SSDE with Image Noise Measurement
Get Radiology Tree app to read full this article<
Get Radiology Tree app to read full this article<
Comparison in Detection Sensitivity Among Subgroups Classified by SSDE and Nodular LD
Get Radiology Tree app to read full this article<
Get Radiology Tree app to read full this article<
Get Radiology Tree app to read full this article<
Get Radiology Tree app to read full this article<
Statistical Analyses
Get Radiology Tree app to read full this article<
Get Radiology Tree app to read full this article<
Get Radiology Tree app to read full this article<
Results
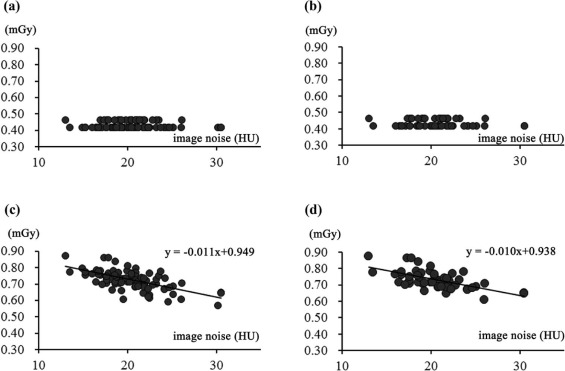
Radiation Dose Measurement and Its Association with Objective Image Noise
Get Radiology Tree app to read full this article<
Get Radiology Tree app to read full this article<
Get Radiology Tree app to read full this article<
Get Radiology Tree app to read full this article<
Get Radiology Tree app to read full this article<
Nodule Detection Study
Get Radiology Tree app to read full this article<
Get Radiology Tree app to read full this article<
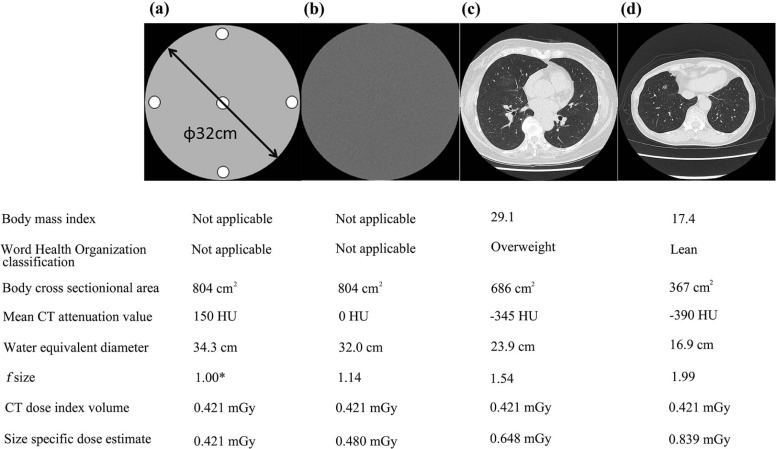
Table 1
Comparison of SSNDP Between CT with AIDR 3D at 20 mA and CT with AIDR 3D at 120 mA in Total Nodules and Nodules with LD of 5 mm or More
Total Nodules ( n = 108) Observer Area Under the ROC Curve Sensitivity Accuracy PPV 20 mA 120 mA 20 mA 120 mA 20 mA 120 mA 20 mA 120 mA Observer 1 0.900 0.924 80.5 85.2 80.5 85.2 79.8 79.3 Observer 2 0.832 0.861 67.5 72.2 63.0 68.5 74.5 74.2 Observer 3 0.891 0.910 78.7 82.4 68.5 71.3 86.7 89.0 Observer 4 0.822 0.857 64.8 71.2 52.7 59.3 87.5 77.7 Significant ( P = .029) Significant ( P = .003) Significant ( P = .029) NS ( P = .491)
Nodules with LD of 5 mm or More ( n = 64) Observer Area Under the ROC Curve Sensitivity Accuracy PPV 20 mA 120 mA 20 mA 120 mA 20 mA 120 mA 20 mA 120 mA Observer 1 0.967 0.975 93.5 95.1 93.5 95.1 86.7 91.0 Observer 2 0.957 0.966 91.9 93.5 82.8 84.4 86.7 80.0 Observer 3 0.999 0.999 100.0 100.0 84.4 81.3 91.4 92.8 Observer 4 0.927 0.951 85.4 90.3 65.6 71.9 98.2 95.1 NS ( P = .229) NS ( P = .144) NS ( P = .229) NS ( P = .834)
AIDR 3D, Adaptive Iterative Dose Reduction using Three Dimensional Processing; CT, computed tomography; LD, longest diameter; NS, not significant; PPV, positive predictive value; ROC, receiver operating characteristic; SSNDP, sub-solid nodule detection performance.
Get Radiology Tree app to read full this article<
Get Radiology Tree app to read full this article<
Table 2
Comparison of SSNDP Between CT with AIDR 3D at 20 mA and CT with AIDR 3D at 120 mA in Pure Ground-glass Nodule and Part-solid Nodule
Pure Ground-glass Nodule ( n = 86) Observer Area Under the ROC Curve Sensitivity Accuracy PPV 20 mA 120 mA 20 mA 120 mA 20 mA 120 mA 20 mA 120 mA Observer 1 0.881 0.909 76.7 82.5 76.7 82.5 78.6 77.1 Observer 2 0.804 0.834 61.6 66.3 62.8 68.6 72.6 68.4 Observer 3 0.864 0.887 63.0 77.9 64.0 67.4 85.1 88.1 Observer 4 0.789 0.839 58.1 67.4 44.2 52.3 84.7 74.3 Significant ( P = .026) Significant ( P = .032) Significant ( P = .026) NS ( P = .327)
Part-solid Nodule ( n = 22) Observer Area Under the ROC Curve Sensitivity Accuracy PPV 20 mA 120 mA 20 mA 120 mA 20 mA 120 mA 20 mA 120 mA Observer 1 0.977 0.977 95.5 95.5 95.5 95.5 84.0 87.5 Observer 2 0.953 0.977 90.9 95.4 63.6 68.2 80.0 72.4 Observer 3 0.999 0.999 100.0 100.0 86.4 86.4 91.7 91.7 Observer 4 0.955 0.931 90.9 86.3 86.4 86.4 95.2 90.5 NS ( P = .989) NS ( P = .990) NS ( P = .989) NS ( P = .437)
AIDR 3D, Adaptive Iterative Dose Reduction using Three Dimensional Processing; CT, computed tomography; NS, not significant; PPV, positive predictive value; ROC, receiver operating characteristic; SSNDP, sub-solid nodule detection performance.
Get Radiology Tree app to read full this article<
Get Radiology Tree app to read full this article<
Table 3
Comparison of SSNDP Between ULDCT and LDCT in Eight Locations
Total Nodules ( n = 108) Location Area Under the ROC Curve Sensitivity Interobserver Variance ULDCT LDCT_P_ Value ULDCT LDCT_P_ Value_P_ Value Upper (51) 0.888 ± 0.031 0.906 ± 0.022 .43 78.4 ± 9.2 82.4 ± 3.2 .28 .008 \* Middle (33) 0.849 ± 0.036 0.866 ± 0.033 .43 70.5 ± 8.3 74.2 ± 9.4 .07 .009 \* Lower (24) 0.820 ± 0.041 0.867 ± 0.048 .21 64.6 ± 7.2 72.9 ± 14.6 .28 .004 \* Central (56) 0.897 ± 0.028 0.919 ± 0.019 .24 79.9 ± 7.6 84.4 ± 5.1 .14 .005 \* Peripheral (52) 0.823 ± 0.036 0.847 ± 0.034 .25 65.4 ± 11.1 69.7 ± 8.5 .28 <.001 \* Ventral (27) 0.857 ± 0.043 0.900 ± 0.039 .07 72.2 ± 11.5 80.6 ± 13.3 .07 <.001 \* Intermediate (39) 0.837 ± 0.035 0.873 ± 0.034 .09 68.6 ± 9.0 75.6 ± 9.9 .07 <.001 \* Dorsal (42) 0.884 ± 0.030 0.886 ± 0.026 .96 77.4 ± 6.9 78.0 ± 2.3 .47 .260
Nodules with LD of 5 mm or More ( n = 64) Location Area Under the ROC Curve Sensitivity Interobserver Variance ULDCT LDCT_P_ Value ULDCT LDCT_P_ Value_P_ Value Upper (33) 0.968 ± 0.016 0.979 ± 0.013 .24 93.8 ± 4.4 96.1 ± 2.6 .18 .122 Middle (19) 0.966 ± 0.019 0.967 ± 0.011 .98 93.4 ± 4.4 93.4 ± 4.4 1.00 .227 Lower (12) 0.942 ± 0.042 0.966 ± 0.029 .33 88.6 ± 9.9 93.2 ± 7.6 .16 .027 \* Central (37) 0.972 ± 0.014 0.979 ± 0.060 .56 94.6 ± 4.3 95.9 ± 2.3 .59 .089 Peripheral (27) 0.949 ± 0.028 0.964 ± 0.023 .19 90.0 ± 7.2 93.0 ± 5.9 .18 .013 \* Ventral (16) 0.974 ± 0.016 0.982 ± 0.010 .69 95.0 ± 5.5 96.7 ± 3.3 .79 .239 Intermediate (22) 0.939 ± 0.032 0.957 ± 0.026 .42 88.1 ± 7.1 91.7 ± 6.2 .32 .042 \* Dorsal (26) 0.975 ± 0.020 0.980 ± 0.006 .70 95.2 ± 6.3 96.2 ± 2.7 .66 .073
LDCT, low-dose computed tomography obtained at 120 mA; NS, not significant; ROC, receiver operating characteristic; SSNDP, sub-solid nodule detection performance; ULDCT, ultra low-dose computed tomography obtained at 20 mA.
Values in parentheses stand for the number of ground-glass nodules identified in each of the eight locations.
Get Radiology Tree app to read full this article<
Get Radiology Tree app to read full this article<
Comparison in Detection Sensitivity Among Subgroups Classified by SSDE and Nodular LD
Get Radiology Tree app to read full this article<
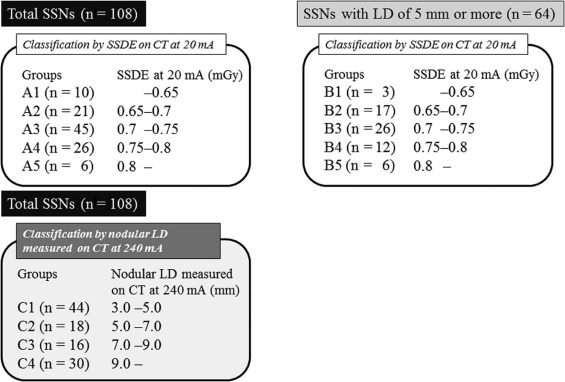
Table 4
Comparison Among Five Groups Classified by SSDE and Among Another Four Groups Classified by Nodular LD
DS Among Five Groups Classified by SSDE on CT with AIDR 3D at 20 mA Total SSNs (n = 108) SSNs with LD of 5 mm or more ( n = 64) Group A1 A2 A3 A4 A5 B1 B2 B3 B4 B5 Number 10 21 45 26 6 3 17 26 12 6 SSDE at 20 mA (mGy) <0.65 0.65–0.7 0.7–0.75 0.75–0.8 >0.8 <0.65 0.65–0.7 0.7–0.75 0.75–0.8 >0.8 DS at 20 mA (%) 38 ± 23 83 ± 20 78 ± 29 64 ± 39 100 ± 0 50 ± 20 91 ± 24 89 ± 19 96 ± 9 100 ± 0 DS at 120 mA (%) 53 ± 24 83 ± 29 81 ± 28 73 ± 33 96 ± 9 75 ± 20 93 ± 19 91 ± 21 98 ± 7 96 ± 9
Nodular LD Measured on CT with AIDR 3D at 240 mA Among Five Groups Classified by SSDE on CT with AIDR 3D at 20 mA Total SSNs ( n = 108) SSNs with LD of 5 mm or more ( n = 64) Group A1 A2 A3 A4 A5 B1 B2 B3 B4 B5 Number 10 21 45 26 6 3 17 26 12 6 SSDE at 20 mA (mGy) <0.65 0.65–0.7 0.7–0.75 0.75–0.8 >0.8 <0.65 0.65–0.7 0.7–0.75 0.75–0.8 >0.8 Nodular LD (mm) 5.5 ± 2.7 8.4 ± 3.5 7.9 ± 5.1 7.1 ± 4.8 9.3 ± 0.8 8.1 ± 3.7 9.3 ± 3.2 10.6 ± 5.3 10.6 ± 5.2 9.3 ± 0.8
DS Among Four Groups Classified by Nodular LD Measured on CT with AIDR 3D at 240 mA Total SSNs ( n = 108) Group C1 C2 C3 C4 Number 44 18 16 30 Nodular LD (mm) 3.0–5.0 5.0–7.0 7.0–9.0 >9.0 DS at 20 mA (%) 56 ± 32 83 ± 25 97 ± 8 96 ± 15 DS at 120 mA (%) 47 ± 33 74 ± 27 98 ± 6 96 ± 15
AIDR 3D, Adaptive Iterative Dose Reduction using Three Dimensional Processing; CT, computed tomography; DS, detection sensitivity; LD, longest diameter; SSDE, size-specific dose estimate; SSN, sub-solid nodule.
Get Radiology Tree app to read full this article<
Get Radiology Tree app to read full this article<
Get Radiology Tree app to read full this article<
Discussion
Get Radiology Tree app to read full this article<
Get Radiology Tree app to read full this article<
Get Radiology Tree app to read full this article<
Get Radiology Tree app to read full this article<
Get Radiology Tree app to read full this article<
Get Radiology Tree app to read full this article<
Get Radiology Tree app to read full this article<
Get Radiology Tree app to read full this article<
Acknowledgments
Get Radiology Tree app to read full this article<
Get Radiology Tree app to read full this article<
Get Radiology Tree app to read full this article<
Get Radiology Tree app to read full this article<
References
1. Naidich D.P., Bankier A.A., MacMahon H., et. al.: Recommendations for the management of subsolid pulmonary nodules detected at CT: a statement from the Fleischner Society. Radiology 2013; 266: pp. 304-317.
2. Wender R., Fontham E.T., Barrera E., et. al.: American Cancer Society lung cancer screening guidelines. CA Cancer J Clin 2013; 63: pp. 107-117.
3. Brenner D.J.: Radiation risks potentially associated with low-dose CT screening of adult smokers for lung cancer. Radiology 2004; 231: pp. 440-445.
4. Katsura M., Matsuda I., Akahane M., et. al.: Model-based iterative reconstruction technique for ultralow-dose chest CT: comparison of pulmonary nodule detectability with the adaptive statistical iterative reconstruction technique. Invest Radiol 2013; 48: pp. 206-212.
5. Neroladaki A., Botsikas D., Boudabbous S., et. al.: Computed tomography of the chest with model-based iterative reconstruction using a radiation exposure similar to chest X-ray examination: preliminary observations. Eur Radiol 2013; 23: pp. 360-366.
6. Suzuki K., Yokose T., Yoshida J., et. al.: Prognostic significance of the size of central fibrosis in peripheral adenocarcinoma of the lung. Ann Thorac Surg 2000; 69: pp. 893-897.
7. Sakao Y., Miyamoto H., Sakuraba M., et. al.: Prognostic significance of a histologic subtype in small adenocarcinoma of the lung: the impact of nonbronchioloalveolar carcinoma components. Ann Thorac Surg 2007; 83: pp. 209-214.
8. Yokose T., Suzuki K., Nagai K., et. al.: Favorable and unfavorable morphological prognostic factors in peripheral adenocarcinoma of the lung 3 cm or less in diameter. Lung Cancer 2000; 29: pp. 179-188.
9. Kim H.K., Choi Y.S., Kim J., et. al.: Management of multiple pure ground-glass opacity lesions in patients with bronchoalveolar carcinoma. J Thorac Oncol 2010; 5: pp. 206-210.
10. Kim H.K., Choi Y.S., Kim J., et. al.: Management of ground-glass opacity lesions in patients with otherwise operable non-small cell lung cancer. J Thorac Oncol 2009; 4: pp. 1242-1246.
11. Lee H.Y., Lee K.S.: Ground-glass opacity nodules: histopathology, imaging evaluation, and clinical implications. J Thorac Imaging 2011; 26: pp. 106-118.
12. Hashizume T., Yamada K., Okamoto N., et. al.: Prognostic significance of thin-section CT scan findings in small-sized lung adenocarcinoma. Chest 2008; 133: pp. 441-447.
13. Lee J.Y., Chung M.J., Yi C.A., et. al.: Ultra-low-dose MDCT of the chest: influence on automated lung nodule detection. Korean J Radiol 2008; 9: pp. 95-101.
14. Khatonabadi M., Kim H.J., Lu P., et. al.: The feasibility of a regional CTDI vol to estimate organ dose from tube current modulated CT exams. Med Phys 2013; 40: pp. 051903.
15. Christner J.A., Braun N.N., Jacobsen M.C., et. al.: Size-specific dose estimates for adult patients at CT of the torso. Radiology 2012; 265: pp. 841-847.
16. Moore B.M., Brady S.L., Mirro A.E., et. al.: Size-specific dose estimate (SSDE) provides a simple method to calculate organ dose for pediatric CT examinations. Med Phys 2014; 41: pp. 071917.
17. Leng S., Shiung M., Duan X., et. al.: Size-specific dose estimates for chest, abdominal, and pelvic CT: effect of intrapatient variability in water-equivalent diameter. Radiology 2015; 276: pp. 184-190.
18. Nagatani Y., Takahashi M., Murata K., et. al.: Lung nodule detection performance in five observers on computed tomography (CT) with adaptive iterative dose reduction using three-dimensional processing (AIDR 3D) in a Japanese multicenter study: comparison between ultra-low-dose CT and low-dose CT by receiver-operating characteristics analysis. Eur J Radiol 2015; 84: pp. 1401-1412.
19. Shrimpton P.C., Hillier M.C., Lewis M.A., et. al.: National survey of doses from CT in the UK: 2003. Br J Radiol 2006; 79: pp. 968-980.
20. McCollough C., Bakalyar D.M., Bostani M., et. al.: Use of water equivalent diameter for calculating patient size and Size-Specific Dose Estimates (SSDE) in CT. The report of AAPM Task Group 220. AAPM Rep 2014; 2014: pp. 6-23.
21. Yamashiro T., Miyara T., Honda O., et. al.: Adaptive iterative dose reduction using three dimensional processing (AIDR 3D) improves chest CT image quality and reduces radiation dose exposure. PLoS ONE 2014; 9: e105735
22. Dorfman D.D., Berbaum K.S., Metz C.E.: Receiver operating characteristic rating analysis: generalization to the population of readers and patients with the jackknife method. Invest Radiol 1992; 27: pp. 723-731.
23. Lee S.W., Kim Y.Y., Shim S.S., et. al.: Image quality assessment of ultra low-dose chest CT using sinogram-affirmed iterative reconstruction. Eur Radiol 2014; 24: pp. 817-826.
24. Karla M.K., Maher M.M., Toth T.L., et. al.: Strategies for CT radiation dose optimization. Radiology 2004; 230: pp. 619-628.
25. Karla M.K., Rizzo S.M., Novelline R.A.: Reducing radiation dose in emergency computed tomography with automatic exposure control techniques. Emerg Radiol 2005; 11: pp. 267-274.
26. McCollough C.H., Bruesewitz M.R., Kofler J.M.: CT dose reduction and dose management tools: overview of available options. Radiographics 2006; 26: pp. 503-512.
27. Rizzo S., Kalra M., Schmidt B., et. al.: Comparison of angular and combined automatic tube current modulation techniques with constant tube current CT of the abdomen and pelvis. AJR Am J Roentogenol 2006; 186: pp. 673-679.
28. Martini K., Higashigaito K., Barth B.K., et. al.: Ultralow-dose CT with tin filtration for detection of solid and sub solid pulmonary nodules: a phantom study. Br J Radiol 2015; 88: pp. 20150389.