
Rationale and Objectives
The aim of this study was to investigate the subjective similarity for pairs of images with various abnormal patterns of diffuse interstitial lung disease on thin-section computed tomography by experienced radiologists to explore a basis for selecting similar images to assist radiologists’ interpretation.
Materials and Methods
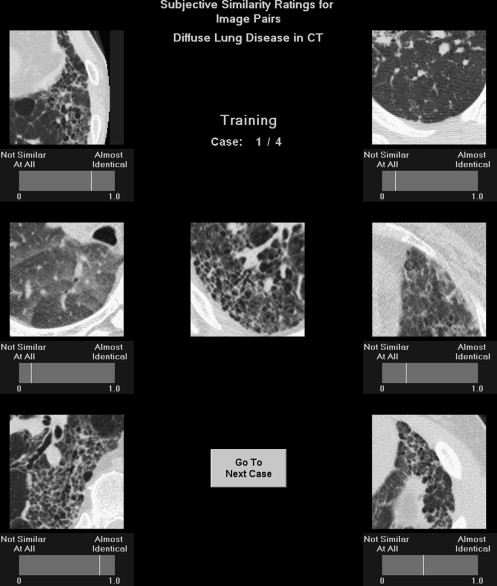
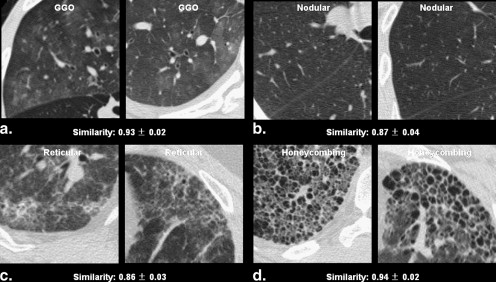
Four major patterns (ground-glass opacity, nodular opacity, reticular opacity, and honeycombing) on thin-section computed tomographic images were identified by at least two of three radiologists. One radiologist manually selected 104 image pairs, in which the images in each pair had the same pattern and were similar in appearance. An additional 208 image pairs were randomly selected and evenly divided among the four patterns. These pairs were then rated for subjective similarity (on a continuous scale ranging from 0 = not similar at all to 1.0 = almost identical) by 12 radiologists.
Results
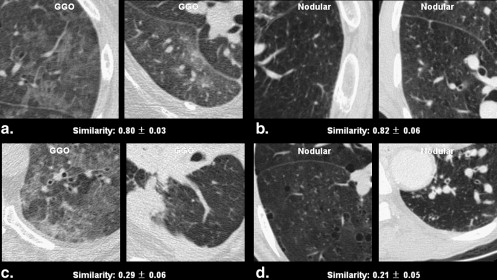
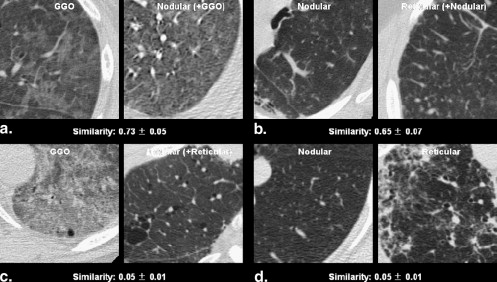
For radiologist-selected pairs, the mean similarity rated by the 12 radiologists was 0.72. For randomly selected pairs, the mean similarity was higher for the same pattern (0.47) than for the varying patterns (0.27) ( P < .001), and among the same pattern, the mean similarity was 0.63 for ground-glass opacity, 0.58 for honeycombing, 0.45 for nodular opacity, and 0.32 for reticular opacity. The mean standard deviation for similarity ratings on all pairs given by the 12 radiologists was 0.05 (rang, 0.01–0.09).
Conclusion
Subjective similarity ratings for pairs of abnormal images can be measured reliably and reproducibly by radiologists and will provide a basis for the selection of similar images to assist radiologists’ interpretation.
Computed tomography, especially thin-section computed tomography, is a major modality that has played an important role in the diagnosis of diffuse interstitial lung disease (DILD) . DILD includes a large subgroup of lung diseases with both specific and nonspecific pathologic findings. Radiologists classify these diseases into different patterns on the basis of pathologic or radiologic features determined from thin-section computed tomographic (CT) images . The differential diagnosis of DILD is a very challenging subject, even for pathologists , but there is good agreement among thoracic radiologists for the CT diagnosis of DILD with certain abnormal patterns . A previous study reported that a method for the computer recognition of regional lung disease patterns was reproducible and performed as well as experienced human observers who had been told patients’ diagnoses. However, both the observer versus the computer agreement and the interobserver agreement regarding the pattern types were not high (52% and 54%).
Subjective comparisons of two images that show similar or dissimilar categories of disease, such as comparison between two malignant lesions or between malignant and benign lesions on chest CT images or mammograms, have been investigated previously in our studies of computer-aided diagnosis (CAD) . Our previous results indicated that the subjective similarity of a pair of lesions in medical images could be quantified consistently by a group of radiologists . For assisting in differential diagnosis, we believe that it will be possible to search for and retrieve images with known pathology, which are very similar to a new unknown case, from a Picture Archiving and Communication System when a reliable and useful method has been developed for quantifying the similarity of pairs of images for visual comparison by radiologists .
Get Radiology Tree app to read full this article<
Materials and methods
Patient Database and Reference Standard
Get Radiology Tree app to read full this article<
Get Radiology Tree app to read full this article<
Get Radiology Tree app to read full this article<
Get Radiology Tree app to read full this article<
Get Radiology Tree app to read full this article<
Image Pair Selection
Get Radiology Tree app to read full this article<
Get Radiology Tree app to read full this article<
Get Radiology Tree app to read full this article<
Observer Performance Study
Get Radiology Tree app to read full this article<
Get Radiology Tree app to read full this article<
Get Radiology Tree app to read full this article<
Subjective Similarity Analysis
Get Radiology Tree app to read full this article<
Results
Radiologist-selected Image Pairs
Get Radiology Tree app to read full this article<
Table 1
Similarities of 104 Radiologist-selected Same Computed Tomographic Pattern Pairs of Diffuse Interstitial Lung Disease Rated by 12 Observers
Image Pattern Mean Similarity (range) Mean Standard Deviation (range) Selected as very similar GGO vs. GGO ( n = 9) 0.81 (0.70–0.93) 0.05 (0.02–0.07) Nodular opacity vs. nodular opacity ( n = 18) 0.68 (0.21–0.87) 0.05 (0.03–0.07) Reticular opacity vs. reticular opacity ( n = 15) 0.71 (0.44–0.86) 0.05 (0.03–0.08) Honeycombing vs. honeycombing ( n = 10) 0.83 (0.55–0.94) 0.04 (0.02–0.06) Subtotal ( n = 52) 0.74 (0.21–0.94) 0.05 (0.02–0.08) Selected as somewhat similar GGO vs GGO ( n = 9) 0.73 (0.53–0.90) 0.05 (0.02–0.08) Nodular opacity vs. nodular ( n = 18) 0.64 (0.38–0.86) 0.06 (0.04–0.08) Reticular opacity vs. reticular opacity ( n = 15) 0.65 (0.33–0.83) 0.06 (0.03–0.08) Honeycombing vs. honeycombing ( n = 10) 0.82 (0.72–0.93) 0.04 (0.01–0.06) Subtotal ( n = 52) 0.69 (0.33–0.93) 0.05 (0.01–0.08) Total ( n = 104) 0.72 (0.21–0.94) 0.05 (0.01–0.08)
GGO, ground-glass opacity.
Data are mean similarities for image pairs and mean standard deviations for ratings on each pair given by 12 observers.
Get Radiology Tree app to read full this article<
Randomly Selected Image Pairs
Get Radiology Tree app to read full this article<
Table 2
Similarities of 208 Randomly Selected Computed Tomographic Pattern Pairs of Diffuse Interstitial Lung Disease Rated by 12 Observers
Image Patterns Mean Similarity (range) Mean Standard Deviation (range) Pairs with same pattern GGO vs. GGO ( n = 9) 0.63 (0.29–0.80) 0.05 (0.03–0.08) Nodular opacity vs. nodular opacity ( n = 18) 0.45 (0.21–0.82) 0.07 (0.04–0.09) Reticular opacity vs. reticular opacity ( n = 15) 0.32 (0.13–0.58) 0.05 (0.02–0.09) Honeycombing vs. honeycombing ( n = 10) 0.58 (0.18–0.88) 0.05 (0.03–0.07) Total ( n = 52) 0.47 ∗ (0.13–0.88) 0.06 (0.02–0.09) Pairs with different pattern GGO vs. nodular opacity ( n = 27) 0.26 (0.05–0.73) 0.04 (0.01–0.09) GGO vs. reticular opacity ( n = 24) 0.37 (0.08–0.76) 0.05 (0.01–0.07) GGO vs. honeycombing opacity ( n = 19) 0.16 (0.04–0.41) 0.03 (0.01–0.07) Nodular vs. reticular opacity ( n = 33) 0.28 (0.05–0.65) 0.05 (0.01–0.09) Nodular vs. honeycombing opacity ( n = 28) 0.16 (0.04–0.48) 0.04 (0.01–0.07) Reticular vs. honeycombing opacity ( n = 25) 0.36 (0.08–0.82) 0.05 (0.01–0.08) Total ( n = 156) 0.27 ∗ (0.04–0.82) 0.04 (0.01–0.09)
GGO, ground-glass opacity.
Data are mean similarities for image pairs and mean standard deviations for ratings on each pair given by 12 observers.
Get Radiology Tree app to read full this article<
Get Radiology Tree app to read full this article<
All Image Pairs (reliability and reproducibility)
Get Radiology Tree app to read full this article<
Get Radiology Tree app to read full this article<
Get Radiology Tree app to read full this article<
Discussion
Get Radiology Tree app to read full this article<
Get Radiology Tree app to read full this article<
Get Radiology Tree app to read full this article<
Get Radiology Tree app to read full this article<
Get Radiology Tree app to read full this article<
Get Radiology Tree app to read full this article<
Acknowledgment
Get Radiology Tree app to read full this article<
References
1. Grenier P., Valeyre D., Cluzel P., Brauner M.W., Lenoir S., Chastang C.: Chronic diffuse interstitial lung disease: diagnostic value of chest radiography and high-resolution CT. Radiology 1991; 179: pp. 123-132.
2. Remy-Jardin M., Remy J., Deffontaines C., Duhamel A.: Assessment of diffuse infiltrative lung disease: comparison of conventional CT and high-resolution CT. Radiology 1991; 181: pp. 151-162.
3. Aziz Z.A., Wells A.U., Bateman E.D., et. al.: Interstitial lung disease: effects of thin-section CT on clinical decision making. Radiology 2006; 238: pp. 725-733.
4. Akira M., Hamada H., Sakatani M., Kobayashi C., Nishioka M., Yamamoto S.: CT findings during phase of accelerated deterioration in patients with idiopathic pulmonary fibrosis. AJR Am J Roentgenol 1997; 168: pp. 79-83.
5. Akira M., Atafi S., Kawahara M., Luchi K., Johkoh T.: High-resolution CT findings of diffuse bronchioloalveolar carcinoma in 38 patients. AJR Am J Roentgenol 1999; 173: pp. 1623-1629.
6. Abehsera M., Valeyre D., Grenier P., Jaillet H., Battesti J.P., Brauner M.W.: Sarcoidosis with pulmonary fibrosis: CT patterns and correlation with pulmonary function. AJR Am J Roentgenol 2000; 174: pp. 1751-1757.
7. Rossi S.E., Erasmus J.J., Volpacchio M., Franquet T., Castiglioni T., McAdams H.P.: Crazy-paving” pattern at thin-section CT of the lungs: radiologic-pathologic overview. RadioGraphics 2003; 23: pp. 1509-1519.
8. Paul N.S., Roberts H., Butany J., et. al.: Radiologic patterns of disease in patients with severe acute respiratory syndrome: the Toronto experience. RadioGraphics 2004; 24: pp. 553-563.
9. Marchiori E., Souza A.S., Franquest T., Muller N.L.: Diffuse high-attenuation pulmonary abnormalities: a pattern-oriented diagnostic approach on high-resolution CT. AJR Am J Roentgenol 2005; 184: pp. 273-282.
10. Lynch D.A., Travis W.D., Muller N.L., Galvin J.R., Hansell D.M., Grenier P.A., King T.E.: Idiopathic interstitial pneumonias: CT features. Radiology 2005; 236: pp. 10-21.
11. Raoof S., Amchentsev A., Vlahos I., Goud A., Naidich D.P.: Pictorial essay: multinodular disease: a high-resolution CT scan diagnostic algorithm. Chest 2006; 129: pp. 805-815.
12. Mueller-Mang C., Grosse C., Schmid K., Stiebellehner L., Bankier A.A.: What every radiologist should know about idiopathic interstitial pneumonias. RadioGraphics 2007; 27: pp. 595-615.
13. Beigelman-Aubry C., Hill C., Guibal A., Savatovsky J., Grenier P.A.: Multi-detector row CT and postprocessing techniques in the assessment of diffuse lung disease. RadioGraphics 2005; 25: pp. 1639-1652.
14. Nicholson A.G., Addis B.J., Bharucha H., et. al.: Inter-observer variation between pathologists in diffuse parenchymal lung disease. Thorax 2004; 59: pp. 500-505.
15. Aziz Z.A., Wells A.U., Hansell D.M., et. al.: HRCT diagnosis of diffuse parenchymal lung disease: inter-observer variation. Thorax 2004; 59: pp. 506-511.
16. Uppaluri R., Hoffman E.A., Sonka M., Hartley P.G., Hunninghake G.W.: McLennan. Computer recognition of regional lung disease patterns. Am J Respir Crit Care Med 1999; 160: pp. 648-654.
17. Li Q., Li F., Shiraishi J., Katsuragawa S., Sone S., Doi K.: Investigation of new psychophysical measures for evaluation of similar images on thoracic CT for distinction between benign and malignant nodules. Med Phys 2003; 30: pp. 2584-2588.
18. Muramatsu C., Li Q., Suzuki K., et. al.: Investigation of psychophysical measure for evaluation of similar images for mammographic masses: preliminary results. Med Phys 2005; 32: pp. 2295-2304.
19. Kumazawa S., Muramatsu C., Li Q., et. al.: An investigation of radiologists’ perception of lesion similarity: observations with paired breast masses on mammograms and paired lung nodules on CT images. Acad Radiol 2008; 15: pp. 887-894.
20. Doi K.: Current status and future potential of computer-aided diagnosis in medical imaging. Br J Radiol 2005; 78: pp. s3-s19.
21. Doi K.: Computer-aided diagnosis in medical imaging: historical review, current status and future potential. Comput Med Imaging Graph 2007; 31: pp. 198-211.
22. Uchiyama Y., Katsuragawa S., Abe H., et. al.: Quantitative computerized analysis of diffuse lung disease in high-resolution computed tomography. Med Phys 2003; 30: pp. 2440-2454.
23. Chabat F., Yang G.Z., Hansell D.M.: Obstructive lung diseases: texture classification for differentiation at CT. Radiology 2003; 228: pp. 871-877.
24. Fukushima A., Ashizawa K., Yamaguchi T., et. al.: Application of an artificial neural network to high-resolution CT: usefulness in differential diagnosis of diffuse lung disease. AJR Am J Roentgenol 2004; 183: pp. 506-511.
25. Zavaletta V.A., Bartholmai B.J., Robb R.A.: High resolution multidetector CT-aided tissue analysis and quantification of lung fibrosis. Acad Radiol 2007; 14: pp. 772-787.
26. Muramatsu C., Li Q., Schmidt R.A., et. al.: Experimental determination of subjective similarity for pairs of clustered microcalcifications on mammograms: observer study results. Med Phys 2006; 33: pp. 3460-3468.