
Rationale and Objectives
The purposes of this study were to assess the association between superficial siderosis (SS) and subdural hematoma (SDH) and to evaluate the magnetic resonance imaging (MR) characteristics of SS in patients with the presence or histories of SDH compared to those with histories of aneurysmal subarachnoid hemorrhage (SAH).
Materials and Methods
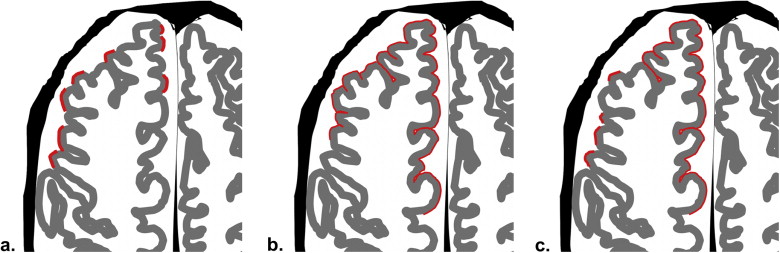
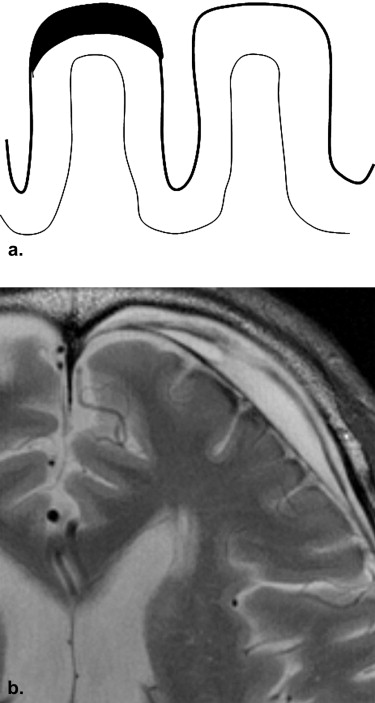
A radiology database for a 4-year period contained data on patients with diagnoses of SDH. From these patients, 47 patients were further selected who underwent brain MR examinations using a 3-T MR system (the SDH group). Using T2-weighted images, two neuroradiologists evaluated the presence or absence and the characteristics of SS findings by comparing the patients with histories of aneurysmal subarachnoid hemorrhage (the SAH group; n = 36). The SS findings were classified into three types: apical (SS at the top of the surface of the gyrus of the cerebral hemisphere), gyral (SS surrounding the gyrus), and mixed.
Results
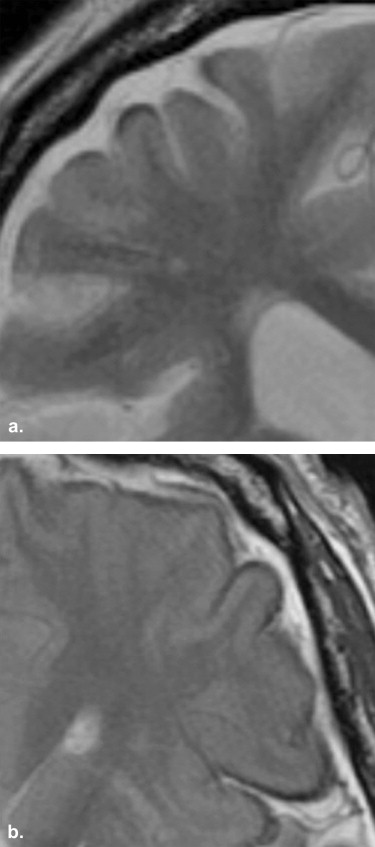
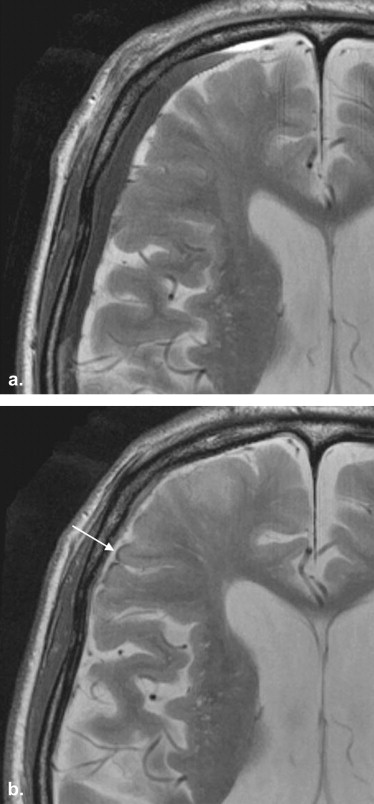
SS findings were seen in 13 patients (27.7%) in the SDH group (SS-SDH) and 13 patients (36.1%) in the SAH group (SS-SAH); all 13 cases of SS-SDH were the apical type, whereas the 13 cases of SS-SAH were either the gyral ( n = 9 [69.2%]) or mixed ( n = 4 [30.8%]) type. SS-SDH was seen only in the cerebral hemisphere ipsilateral to the side of the SDH (12 of 13 [92.3%]). All 13 cases of SS-SDH were accompanied by thinning of gray-matter intensity in the cerebral cortex, which was more frequently seen than in SS-SAH ( P < .01).
Conclusion
SDH occasionally causes the SS-like MR findings, and the pathogenesis of SS-SDH may be also different from that of SS-SAH.
Superficial siderosis (SS) of the central nervous system is caused by repeated hemorrhage into the subarachnoid space, with resultant hemosiderin deposition along the leptomeninges, subpial tissues, and subependyma of the ventricles . The diagnosis can be confirmed with brain magnetic resonance (MR) imaging (MRI). T2-weighted and, in particular, gradient-echo susceptibility imaging reveals characteristic hypointensity along the pial surface or subarachnoid space of the brain and spinal cord . Although the most common neurologic manifestation includes slowly progressive gait ataxia and impaired hearing, a recent study found that in many patients, abnormal MRI results were present in the absence of secondary symptoms of SS . Recently, high–field strength (3-T) MRI has become available for clinical practice. In comparison to 1.5-T MRI, 3-T MRI has several theoretical advantages, such as an increased signal-to-noise ratio and a greater relative T1-shortening effect, which may be used to improve image quality . Another major feature at 3 T is the increased magnetic susceptibility effect , which would be expected to precisely improve the depiction of SS on T2-weighted images.
SS is associated with a spectrum of lesions, including trauma (such as cervical nerve root avulsions), neoplasms (ependymomas, oligodendrogliomas, and astrocytomas), and vascular abnormalities (arteriovenous malformations, aneurysms, and fragile capillary regrowth after brain surgery) . Experience has revealed that SS-like findings are frequently observed on T2-weighted images at 3 T in patients with the presence or histories of subdural hematoma (SDH), thus suggesting that SDH may be another risk factor for the development of SS. Chronic SDH generally occurs in the elderly, with a reported annual incidence of 5.3 patients treated per 100,000 individuals , and is a progressive space-occupying lesion, which may lead to reversible reduction in cerebral function due to brain compression or brain displacement. Although the causes, clinical characteristics, and therapeutic management of SDH are well established, the association between SS and SDH has not yet been characterized.
Get Radiology Tree app to read full this article<
Materials and methods
Patients
Get Radiology Tree app to read full this article<
Get Radiology Tree app to read full this article<
Get Radiology Tree app to read full this article<
MRI
Get Radiology Tree app to read full this article<
MR Image Interpretation
Get Radiology Tree app to read full this article<
Get Radiology Tree app to read full this article<
Statistical Analysis
Get Radiology Tree app to read full this article<
Results
Get Radiology Tree app to read full this article<
Get Radiology Tree app to read full this article<
Get Radiology Tree app to read full this article<
Table 1
Locations of Hemosiderin Deposition
Location SS-SDH ( n = 13) SS-SAH ( n = 13)P Cerebral hemisphere Frontal lobe 13 (100%) 12 (92.3%) NS Temporal lobe 1 (7.7%) 11 (84.6%) <.01 Parietal lobe 6 (46.2%) 8 (61.5%) NS Occipital lobe 0 (0%) 5 (38.5%) <.05 Sylvian fissure 0 (0%) 12 (92.3%) <.01 Cerebellum 0 (0%) 5 (38.5%) <.05 Brainstem 0 (0%) 3 (23.1%) NS
SAH, subarachnoid hemorrhage; SDH, subdural hematoma; SS, superficial siderosis.
Percentages may not total 100% because of rounding.
Get Radiology Tree app to read full this article<
Get Radiology Tree app to read full this article<
Table 2
Findings of Hemosiderin Deposition
Finding SS-SDH ( n = 13) SS-SAH ( n = 13)P Hemosiderin deposition Apical 13 (100%) 0 (0%) <.01 Gyral 0 (0%) 9 (69.2%) <.01 Mixed 0 (0%) 4 (30.8%) <.05 Thinning of gray-matter intensity in the cerebral cortex 13 (100%) 5 (38.5%) <.01
SAH, subarachnoid hemorrhage; SDH, subdural hematoma; SS, superficial siderosis.
Get Radiology Tree app to read full this article<
Get Radiology Tree app to read full this article<
Get Radiology Tree app to read full this article<
Discussion
Get Radiology Tree app to read full this article<
Get Radiology Tree app to read full this article<
Get Radiology Tree app to read full this article<
Get Radiology Tree app to read full this article<
Get Radiology Tree app to read full this article<
Get Radiology Tree app to read full this article<
Get Radiology Tree app to read full this article<
Get Radiology Tree app to read full this article<
Get Radiology Tree app to read full this article<
References
1. Kumar N., Cohen-Gadol A.A., Wright R.A., et. al.: Superficial siderosis. Neurology 2006; 66: pp. 1144-1152.
2. Koeppen A.H., Dickson A.C., Chu R.C., et. al.: The pathogenesis of superficial siderosis of the central nervous system. Ann Neurol 1993; 34: pp. 646-653.
3. Gomori J.M., Grossman R.I., Bilaniuk L.T., et. al.: High-field MR imaging of superficial siderosis of the central nervous system. J Comput Assist Tomogr 1985; 9: pp. 972-975.
4. Offenbacher H., Fazekas F., Schmidt R., et. al.: Superficial siderosis of the central nervous system. MRI findings and clinical significance. Neuroradiology 1996; 38: pp. 51-56.
5. Nöbauer-Huhmann I.M., Ba-Ssalamah A., Mlynarik V., et. al.: Magnetic resonance imaging contrast enhancement of brain tumors at 3 tesla versus 1.5 tesla. Invest Radiol 2002; 37: pp. 114-119.
6. Kakeda S., Korogi Y., Hiai Y., et. al.: Detection of brain metastasis at 3T: comparison among SE, IR-FSE and 3D-GRE sequences. Eur Radiol 2007; 17: pp. 2345-2351.
7. Kamada K., Kakeda S., Ohnari N., et. al.: Signal intensity of motor and sensory cortices on T2-weighted and FLAIR images: intraindividual comparison of 1.5T and 3T MRI. Eur Radiol 2008; 18: pp. 2949-2955.
8. Kakeda S., Korogi Y., Kamada K., et. al.: Signal intensity of the motor cortex on phase-weighted imaging at 3T. AJNR Am J Neuroradiol 2008; 29: pp. 1171-1175.
9. Fearnley J.M., Stevens J.M., Rudge P.: Superficial siderosis of the central nervous system. Brain 1995; 118: pp. 1051-1066.
10. Robinson R.G.: Chronic subdural hematoma: surgical treatment in 133 patients. J Neurosurg 1984; 61: pp. 263-268.
11. Nomura S., Kashiwagi S., Fujisawa H., et. al.: Characterization of local hyperfibrinolysis in chronic subdural hematomas by SDS-PAGE and immunoblot. J Neurosurg 1994; 81: pp. 910-913.
12. Imaizumi T., Chiba M., Honma T., et. al.: Detection of hemosiderin deposition by T2∗-weighted MRI after subarachnoid hemorrhage. Stroke 2003; 34: pp. 1693-1698.
13. Haacke E.M., Cheng N.Y., House M.J., et. al.: Imaging iron stores in the brain using magnetic resonance imaging. Magn Reson Imaging 2005; 23: pp. 1-25.
14. Reichenbach J.R., Venkatesan R., Schillinger D.J., et. al.: Small vessels in the human brain: MR venography with deoxyhemoglobin as an intrinsic contrast agent. Radiology 1997; 204: pp. 272-277.
15. van Harskamp N.J., Rudge P., Cipolotti L.: Cognitive and social impairments in patients with superficial siderosis. Brain 2005; 128: pp. 1082-1092.