
Rationale and Objectives
To assess the impact of an alternative preprocessing workflow on noncontrast- and contrast-enhanced abdominal four-dimensional flow magnetic resonance imaging (4D flow MRI) data consistency.
Materials and Methods
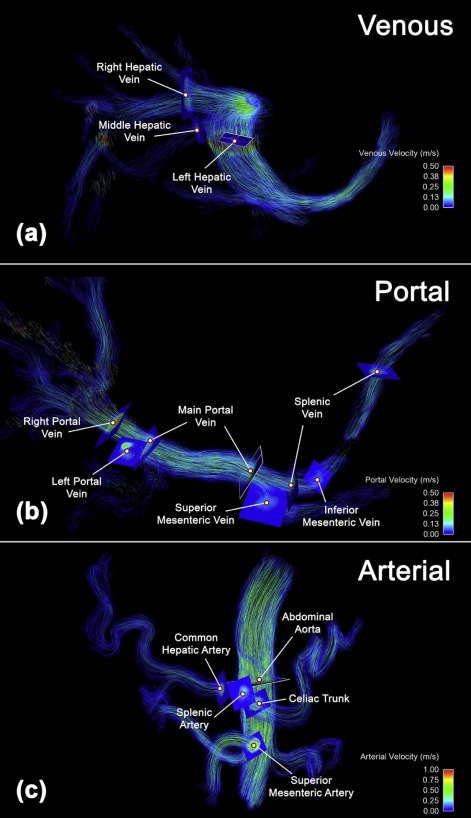
Twenty patients with cirrhosis and portal hypertension (5 women; 53 ± 10 years old) underwent 4D flow MRI at 3.0T before and after administration of 0.03 mmol/kg of gadofosveset trisodium with velocity sensitivities of 100 and 50 cm/s for arterial and venous flow quantifications, respectively. 4D flow MRI data were preprocessed using the conventional workflow (workflow 1), applying noise filters prior to eddy current correction, and an alternative workflow (workflow 2), first correcting for eddy currents and using noise filtering only if needed for anti-aliasing. Vessel segmentation quality was ranked by independent reviewers and compared via Wilcoxon signed-rank tests. Flow quantification and conservation of mass at two portal and one arterial branch points were compared via paired t tests.
Results
Segmentation quality was significantly higher for workflow 2 ( P < 0.05) with excellent interobserver agreement (κ = 0.92). Workflow 2 resulted in larger flow values ( P < 0.05) with improved conservation of mass (7.3 ± 6.1% vs. 27.7 ± 25.0%, P < 0.001 [portal]; 10.7 ± 9.0% vs. 21.7 ± 21.6%, P = 0.02 [arterial]). Peak velocities and abdominal aortic flow were similar ( P > 0.05). Noncontrast acquisitions yielded significantly smaller portal flow values ( P < 0.05) with improved conservation of mass (5.8 ± 4.7% vs. 8.7 ± 6.9%, P = 0.05 [portal]; 6.2 ± 4.5% vs. 13.7 ± 10.2%, P = 0.03 [arterial]).
Conclusions
Superior abdominal 4D flow MRI data consistency was obtained by applying eddy current correction before any other data manipulation, using noise masking and velocity anti-aliasing cautiously, and using noncontrast acquisitions.
Introduction
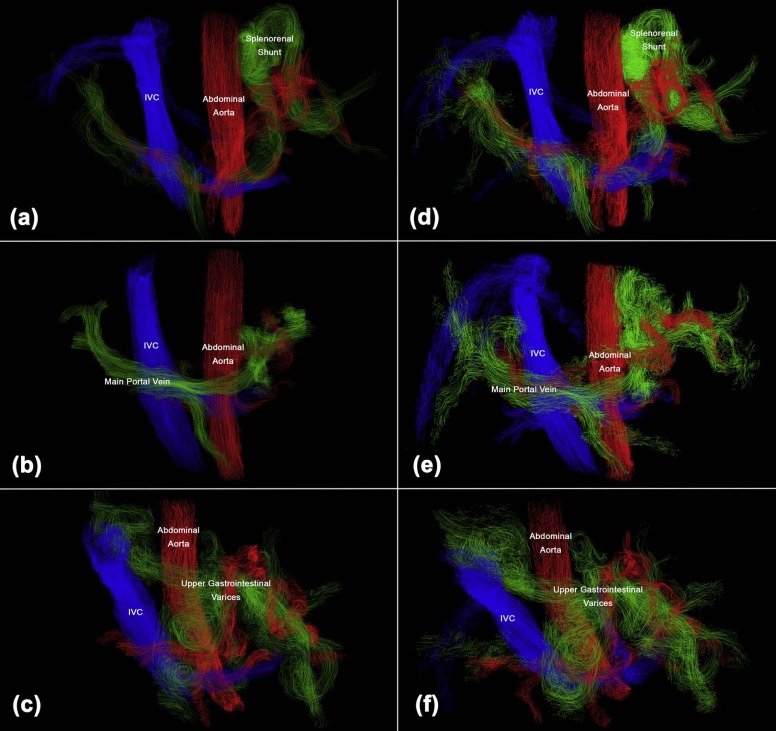
Abdominal time-resolved three-dimensional flow magnetic resonance imaging (4D flow MRI) is an emerging technology for noninvasively quantifying complex hemodynamics. Potential clinical applications include better characterization of cirrhosis-associated thrombocytopenia, quantification of portosystemic shunting prior to liver transplantation to maximize graft survival, transjugular intrahepatic portosystemic shunt function, differential hepatic segment blood flow for planning locoregional oncological therapies, diagnosing mesenteric angina, and renal artery stenosis in patients who cannot receive gadolinium .
However, fully assessing abdominal hemodynamics can be challenging due to the range of velocities, flow rates, and vessel diameters encountered. This is especially true in the setting of cirrhosis and portal hypertension where portosystemic shunts create even wider ranges of velocities and flow patterns, complex vascular anatomy, and imaging difficulties such as artifacts, irregular breathing, and ascites. These features can complicate vessel segmentation, leading to loss of vascular anatomy and flow data in abdominal 4D flow MRI studies of patients with large portosystemic shunts , limiting the transition of this promising technology into clinical workflows. To be used clinically, such as thoracic 4D flow MRI at our institution, abdominal 4D flow MRI must achieve a high degree of consistency to justify its relatively long acquisition and postprocessing times.
Get Radiology Tree app to read full this article<
Materials and Methods
Get Radiology Tree app to read full this article<
Patient Cohort
Get Radiology Tree app to read full this article<
Table 1
Patient Demographics
Age (years) 53 ± 10 Gender (M/F) 15/5 Heart rate (bpm) 71 ± 12 BSA (m 2 ) 2.1 ± 0.3 Cirrhosis etiology Hepatitis C Infection 8/20(40%) \* Alcoholic steatohepatitis 5/20(25%) \* Primary sclerosing cholangitis 3/20(15%) \* Nonalcohol steatohepatitis 2/20(10%) Hepatitis B Infection 2/20(10%) Autoimmune hepatitis 1/20(5%) \* Cryptogenic 1/20(5%)
All values reported as mean ± standard deviation unless indicated otherwise.
Get Radiology Tree app to read full this article<
Get Radiology Tree app to read full this article<
Magnetic Resonance Imaging
Get Radiology Tree app to read full this article<
Magnetic Resonance Data Processing
Get Radiology Tree app to read full this article<
Get Radiology Tree app to read full this article<
Get Radiology Tree app to read full this article<
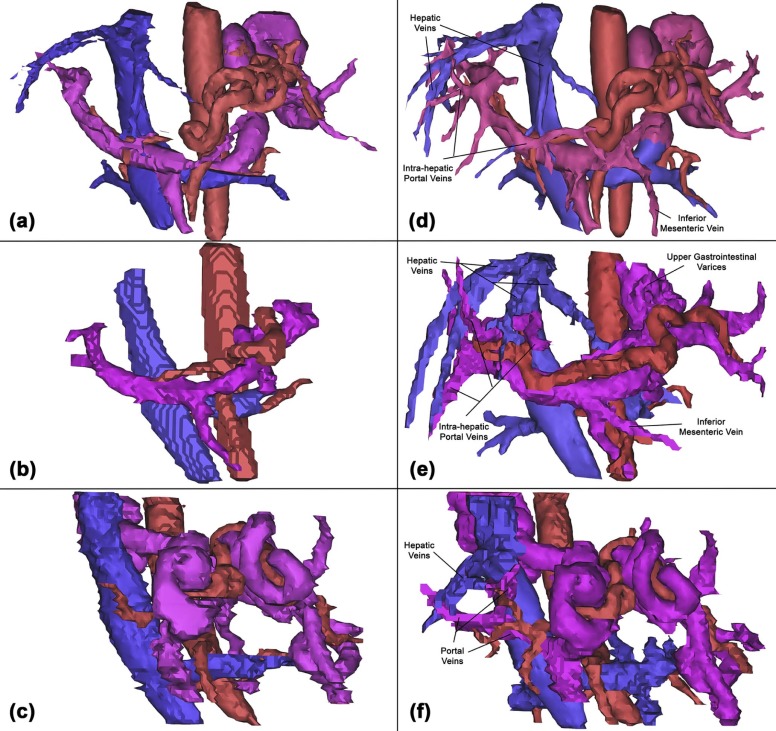
Semi-qualitative Vessel Ranking
Get Radiology Tree app to read full this article<
Statistical Analysis
Get Radiology Tree app to read full this article<
Results
Get Radiology Tree app to read full this article<
Get Radiology Tree app to read full this article<
Get Radiology Tree app to read full this article<
Table 2
Summary of Velocity, Flow, and Segmentation Quality Comparisons
 Open full size image
 Open full size image
venc, velocity encoding sensitivities.
Significant P values ≤ 0.05 are highlighted. Low venc (50 cm/s) datasets were used for venous flow quantification. High venc (100 cm/s) datasets were used for arterial flow quantification. Low venc postcontrast datasets were used for segmentation quality.
Get Radiology Tree app to read full this article<
Get Radiology Tree app to read full this article<
Table 3
Preprocessing Workflow Comparison Summary
Parameter Workflow 1 Workflow 2P Value Preprocessing steps random noise correction → eddy current correction → anti-aliasing (for all acquisitions) eddy current correction → random noise correction and anti-aliasing (only for high venc acquisitions) — Hepatic veins segmentation quality 1.3 ± 1.3 2.6 ± 0.9 <0.001 Portal system segmentation quality 2.2 ± 1.1 2.9 ± 0.4 <0.001 Arterial segmentation quality 2.7 ± 0.7 3.0 ± 0.0 <0.001 Relative error in portal flow 27.7 ± 25.0% 7.3 ± 6.1% <0.001 Relative error in arterial flow 21.7 ± 21.6% 10.7 ± 9.0% 0.02
venc, velocity encoding sensitivities.
Segmentation quality rankings: completely absent (0); small vessel remnant captured (1); vessel captured with rough borders and/or no branches (2); and vessel captured with clear borders and/or branches (3).
Get Radiology Tree app to read full this article<
Discussion
Get Radiology Tree app to read full this article<
Get Radiology Tree app to read full this article<
Get Radiology Tree app to read full this article<
Get Radiology Tree app to read full this article<
Get Radiology Tree app to read full this article<
Get Radiology Tree app to read full this article<
Get Radiology Tree app to read full this article<
Get Radiology Tree app to read full this article<
Get Radiology Tree app to read full this article<
Acknowledgments
Get Radiology Tree app to read full this article<
References
1. Roldan-Alzate A., Francois C.J., Wieben O., et. al.: Emerging applications of abdominal 4D flow MRI. AJR Am J Roentgenol 2016; 207: pp. 58-66.
2. Stankovic Z.: Four-dimensional flow magnetic resonance imaging in cirrhosis. World J Gastroenterol 2016; 22: pp. 89-102.
3. Stankovic Z., Rossle M., Euringer W., et. al.: Effect of TIPS placement on portal and splanchnic arterial blood flow in 4-dimensional flow MRI. Eur Radiol 2015; 25: pp. 2634-2640.
4. Stankovic Z., Jung B., Collins J., et. al.: Reproducibility study of four-dimensional flow MRI of arterial and portal venous liver hemodynamics: influence of spatio-temporal resolution. Magn Reson Med 2014; 72: pp. 477-484.
5. Collins J.D., Semaan E., Barker A., et. al.: Comparison of hemodynamics after aortic root replacement using valve-sparing or bioprosthetic valved conduit. Ann Thorac Surg 2015;
6. Semaan E., Markl M., Malaisrie S.C., et. al.: Haemodynamic outcome at four-dimensional flow magnetic resonance imaging following valve-sparing aortic root replacement with tricuspid and bicuspid valve morphology. Eur J Cardiothorac Surg 2014; 45: pp. 818-825.
7. Schnell S., Markl M., Entezari P., et. al.: k-t GRAPPA accelerated four-dimensional flow MRI in the aorta: effect on scan time, image quality, and quantification of flow and wall shear stress. Magn Reson Med 2014; 72: pp. 522-533.
8. Bock J., Kreher B., Hennig J., et. al.: Optimized pre-processing of time-resolved 2D and 3D phase contrast MRI data. Paper presented at: Proceedings of the 15th Scientific Meeting. International Society for Magnetic Resonance in Medicine, Berlin, Germany2007.
9. Roldan-Alzate A., Frydrychowicz A., Niespodzany E., et. al.: In vivo validation of 4D flow MRI for assessing the hemodynamics of portal hypertension. J Magn Reson Imaging 2013; 37: pp. 1100-1108.
10. Roldan-Alzate A., Frydrychowicz A., Said A., et. al.: Impaired regulation of portal venous flow in response to a meal challenge as quantified by 4D flow MRI. J Magn Reson Imaging 2015; 42: pp. 1009-1017.
11. Stankovic Z., Allen B.D., Garcia J., et. al.: 4D flow imaging with MRI. Cardiovasc Diagn Ther 2014; 4: pp. 173-192.
12. Walker P.G., Cranney G.B., Scheidegger M.B., et. al.: Semiautomated method for noise reduction and background phase error correction in MR phase velocity data. J Magn Reson Imaging 1993; 3: pp. 521-530.
13. Lagerstrand K.M., Vikhoff-Baaz B., Starck G., et. al.: Contrast agent influences MRI phase-contrast flow measurements in small vessels. Magn Reson Med 2010; 64: pp. 42-46.
14. System USRD : USRDS 2015 Annual Data Report: atlas of chronic kidney disease and end-stage renal disease in the United States.2015.National Institute of Diabetes and Digestive and Kidney DiseasesBethesda, MD
15. Deo A., Fogel M., Cowper S.E.: Nephrogenic systemic fibrosis: a population study examining the relationship of disease development to gadolinium exposure. Clin J Am Soc Nephrol 2007; 2: pp. 264-267.
16. Shabana W.M., Cohan R.H., Ellis J.H., et. al.: Nephrogenic systemic fibrosis: a report of 29 cases. AJR Am J Roentgenol 2008; 190: pp. 736-741.
17. Wang Y., Alkasab T.K., Narin O., et. al.: Incidence of nephrogenic systemic fibrosis after adoption of restrictive gadolinium-based contrast agent guidelines. Radiology 2011; 260: pp. 105-111.
18. Radbruch A., Weberling L.D., Kieslich P.J., et. al.: Gadolinium retention in the dentate nucleus and globus pallidus is dependent on the class of contrast agent. Radiology 2015; 275: pp. 783-791.
19. Rigsby C.K., Popescu A.R., Nelson P., et. al.: Safety of blood pool contrast agent administration in children and young adults. AJR Am J Roentgenol 2015; 205: pp. 1114-1120.