
Rationale and Objectives
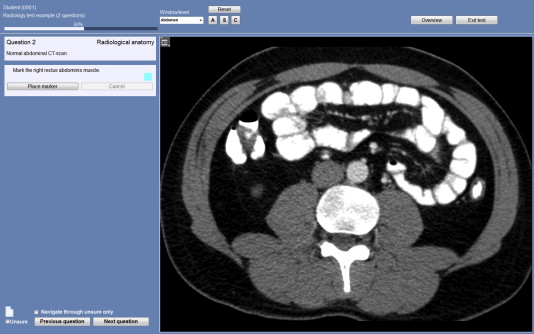
Radiology practice has become increasingly based on volumetric images (VIs), but tests in medical education still mainly involve two-dimensional (2D) images. We created a novel, digital, VI test and hypothesized that scores on this test would better reflect radiological anatomy skills than scores on a traditional 2D image test. To evaluate external validity we correlated VI and 2D image test scores with anatomy cadaver–based test scores.
Materials and Methods
In 2012, 246 medical students completed one of two comparable versions (A and B) of a digital radiology test, each containing 20 2D image and 20 VI questions. Thirty-three of these participants also took a human cadaver anatomy test. Mean scores and reliabilities of the 2D image and VI subtests were compared and correlated with human cadaver anatomy test scores. Participants received a questionnaire about perceived representativeness and difficulty of the radiology test.
Results
Human cadaver test scores were not correlated with 2D image scores, but significantly correlated with VI scores ( r = 0.44, P < .05). Cronbach’s α reliability was 0.49 (A) and 0.65 (B) for the 2D image subtests and 0.65 (A) and 0.71 (B) for VI subtests. Mean VI scores (74.4%, standard deviation 2.9) were significantly lower than 2D image scores (83.8%, standard deviation 2.4) in version A ( P < .001). VI questions were considered more representative of clinical practice and education than 2D image questions and less difficult (both P < .001).
Conclusions
VI tests show higher reliability, a significant correlation with human cadaver test scores, and are considered more representative for clinical practice than tests with 2D images.
Radiologists and other medical specialists involved in interpreting radiological images are confronted with large datasets and ample options for image manipulation . Although radiologists used to view cross-sectional images as single slices presented next to each other (ie, tile viewing), nowadays, the use of innovative image displaying software is the norm. This allows the radiologist to scroll through three-dimensional (3D) datasets (stack viewing), adjust window level, and use advanced image reconstruction tools, such as on the fly multiplanar reformatting. The data for one cross-sectional patient investigation involve a volumetric image (VI) containing up to hundreds of slices, which can be scrolled through in various planes and contrast settings. A vast amount of visual information must be processed and interpreted by the observer . Radiological image interpretation has changed significantly and consequently requires different skills . It is therefore important that radiology education should change accordingly .
Acquiring basic radiological knowledge and image interpretation skills for medical students is increasingly important, as diagnostic imaging has become a prominent diagnostic tool in daily clinical practice . Specifically, the knowledge of radiological anatomy is required for medical doctors of various specialisms to recognize abnormalities on radiological images and to understand the radiology report . Efforts are made to innovate and digitalize radiology education; however, the contents of these curricula vary and are often not supported by empirical evidence . In particular, studies on the development of high quality radiology tests are scarce. Furthermore, most radiology tests do not do justice to the major developments in radiological image interpretation practice. For example, most radiology tests or self-assessment tools do not contain VIs or allow for image manipulation (2D image test) . Pass or fail decisions in traditional radiology tests might therefore become increasingly meaningless given they may reflect measures of irrelevant competence. High quality radiology tests are consequently essential to ensure adequate levels of radiological performance among medical doctors.
Get Radiology Tree app to read full this article<
Get Radiology Tree app to read full this article<
Materials and methods
Study Design
Get Radiology Tree app to read full this article<
Population
Get Radiology Tree app to read full this article<
Instrumentation
Radiology test
Get Radiology Tree app to read full this article<
Get Radiology Tree app to read full this article<
Get Radiology Tree app to read full this article<
Testing program
Get Radiology Tree app to read full this article<
Human cadaver anatomy test
Get Radiology Tree app to read full this article<
Get Radiology Tree app to read full this article<
Questionnaire radiology test
Get Radiology Tree app to read full this article<
Analysis
Get Radiology Tree app to read full this article<
Results
Radiology Test
Get Radiology Tree app to read full this article<
Table 1
Radiology Test Results, Baseline Characteristics, Including Mean Test Scores and Standard Deviations (SDs), Cronbach’s α as Reliability Estimates of Two-Dimensional (2D) Image and Volumetric Image (VI) Test Scores (20 and 40 Questions) per Test Version
Test characteristics Version A Version B Number of participants 121 125 2D image questions ( k = 20) α 0.49 0.65 α predicted for k = 40 ∗ 0.66 0.79 Mean score % (SD) 78.8 (10.8) 83.8 † (11.8) VI questions ( k = 20) α 0.65 0.71 α predicted for k = 40 ∗ 0.79 0.83 Mean score % (SD) 78.8 (13.0) 74.7 † (14.4)
k = Number of questions.
Get Radiology Tree app to read full this article<
Get Radiology Tree app to read full this article<
Get Radiology Tree app to read full this article<
Correlation Radiology and Human Cadaver Test Scores
Get Radiology Tree app to read full this article<
Table 2
Human Cadaver Test Results, and Correlations with Two-Dimensional (2D) Image and Volumetric Image (VI) Radiology Test Scores
Test characteristics Version A ( k = 40) Version B ( k = 40) Number of participants 19 14 α 0.62 0.81 Mean score (standard deviation) 60.3 (2.5) 73.0 (3.5) Correlation (Pearson) with radiology subtest scores 2D image questions 0.07 VI questions 0.44 ∗
k = Number of questions.
Get Radiology Tree app to read full this article<
Get Radiology Tree app to read full this article<
Questionnaire Responses
Get Radiology Tree app to read full this article<
Table 3
Means ( M ) and Standard Deviations (SDs) of Responses on Questionnaire Items Concerning Perceived Representativeness and Scale of Difficulty Items of Two-Dimensional (2D) Image and Volumetric Image (VI) Questions
Questionnaire items_M_ Number of Responses 2D Image VI Perceived representativeness Scale: 1–5 (“completely disagree” to “completely agree”) 2D image/VI questions reflect radiology education ∗ 3.2 (1.2) 4.2 (0.9) 130 2D image/VI questions reflect clinical practice ∗ 3.2 (1.2) 4.3 (0.8) 129 Difficulty Scale: 1–5 (“very easy” to “very difficult”) Mean scale of items on difficulty of 2D image/VI questions ∗ 3.5 (0.7) 2.7 (0.7) 131
Get Radiology Tree app to read full this article<
Get Radiology Tree app to read full this article<
Discussion
Get Radiology Tree app to read full this article<
Get Radiology Tree app to read full this article<
Get Radiology Tree app to read full this article<
Get Radiology Tree app to read full this article<
Get Radiology Tree app to read full this article<
Get Radiology Tree app to read full this article<
Acknowledgments
Get Radiology Tree app to read full this article<
Supplementary Data
Get Radiology Tree app to read full this article<
Digital Supplement
Get Radiology Tree app to read full this article<
Get Radiology Tree app to read full this article<
References
1. Andriole K.P., Wolfe J.M., Khorasani R., et. al.: Optimizing analysis, visualization, and navigation of large image data sets: one 5000-section ct scan can ruin your whole day. Radiology 2011; 259: pp. 346-362.
2. Reiner B.I., Siegel E.L., Siddiqui K.: Evolution of the digital revolution: a radiologist perspective. J Digit Imaging 2003; 16: pp. 324-330.
3. Wang X.H., Durick J.E., Lu A., et. al.: Characterization of radiologists’ search strategies for lung nodule detection: slice-based versus volumetric displays. J Digit Imaging 2008; 21: pp. S39-S49.
4. Venjakob A, Marnitz T, Mahler J, et al. Radiologists’ eye gaze when reading cranial CT images. SPIE Proceedings, volume 8318, Medical Imaging 2012; 83180B.
5. Pascual T.N.B., Chhem R., Wang S.C., et. al.: Undergraduate radiology education in the era of dynamism in medical curriculum: an educational perspective. Eur J Radiol 2011; 78: pp. 319-325.
6. Gunderman R.B., Siddiqui A.R., Heitkamp D.E., et. al.: The vital role of radiology in the medical school curriculum. AJR Am J Roentgenol 2003; 180: pp. 1239-1242.
7. van der Gijp A., van der Schaaf M.F., van der Schaaf I.C., et. al.: Interpretation of radiological images: towards a framework of knowledge and skills. Adv Health Sci Educ Theory Pract 2014; 19: pp. 565-580.
8. Erkonen W.E., Albanese M.A., Smith W.L., et. al.: Effectiveness of teaching radiologic image interpretation in gross anatomy. A long-term follow-up. Invest Radiol 1992; 27: pp. 264-266.
9. Kourdioukova E.V., Valcke M., Derese A., et. al.: Analysis of radiology education in undergraduate medical doctors training in Europe. Eur J Radiol 2011; 78: pp. 309-318.
10. Lee J.S., Aldrich J.E., Eftekhari A., et. al.: Implementation of a new undergraduate radiology curriculum: experience at the University of British Columbia. Can Assoc Radiol J 2007; 58: pp. 272-278.
11. Scarsbrook A.F., Graham R.N.J., Perriss R.W.: Radiology education: a glimpse into the future. Clin Radiol 2006; 61: pp. 640-648.
12. Messick S.: Validity.Linn L.R.Educational measurement.1989.pp. 13-103.
13. van der Vleuten C.P., Schuwirth L.W.: Assessing professional competence: from methods to programmes. Med Educ 2005; 39: pp. 309-317.
14. Ravesloot C.J., Van der Schaaf M.F., Van Schaik J.P.J., et. al.: Volumetric Images improve the testing of Radiological Image Interpretation Skills. Eur J of Radiol 2015;
15. Poldner E., Simons P.R.J., Wijngaards G., et. al.: Quantitative content analysis procedures to analyse students reflective essays: a methodological review of psychometric and edumetric aspects. Educ Res Rev 2012; 7: pp. 19-37.
16. van den Berk I.A., van de Ridder J.M., van Schaik J.P.: Radiology as part of an objective structured clinical examination on clinical skills. Eur J Radiol 2011; 78: pp. 363-367.
17. Ebel R.L.: Measuring educational achievement.1965.Prentice-HallNew Jersey
18. Barros de N., Rodrigues C.J., Rodrigues A.J., et. al.: The value of teaching sectional anatomy to improve CT scan interpretation. Clin Anat 2001; 14: pp. 36-41.
19. Dale V.H., Wieland B., Pirkelbauer B., et. al.: Value and benefits of open-book examinations as assessment for deep learning in a post-graduate animal health course. J Vet Med Educ 2009; 36: pp. 403-410.
20. Messick S.: Validity of psychological assessment: validation of inferences from Persons’ responses and performances as scientific inquiry into score meaning. Am Psychol 1995; 50: pp. 741-749.