
Rationale and Objectives
Benefits of iterative reconstruction (IR) algorithms combined with dose-reduction techniques have been shown at computed tomography pulmonary angiography (CTPA) in several medium to small patient collectives. In this study, we performed a systematic comparison of image quality to combinations of reduced tube current (RC) and IR for both standard-pitch (SP) single-source and high-pitch (HP) dual-source CTPA in a large, single-center population.
Materials and Methods
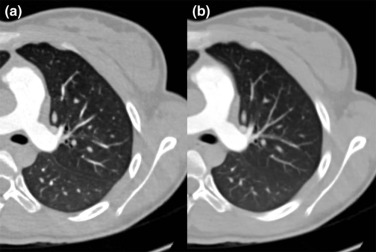
Three hundred eighty-two consecutive patients (October 2010 through December 2012) received clinically indicated CTPA with one of four consecutively changed protocols: (1) HP SC : 180 mAs, weighted filtered back projection, pitch = 3; (2) HP RC : 90 mAs, IR, pitch = 3; (3) SP SC : 180 mAs, weighted filtered back projection, pitch = 1.2; and (4) HP RC : 90 mAs, IR, pitch = 1.2. Tube potential was 100 kV. Vascular attenuation and standardized signal-to-noise ratio (sSNR) were measured in the pulmonary trunk (sSNR PT ) and on segmental artery level (sSNR S1 , sSNR S10 ). Dose-length-product was recorded per series. Two independent investigators rated image quality. Kolmogorov-Smirnov test, Kruskal-Wallis test, and kappa statistics were used for statistical analysis. Median values are presented per group.
Results
Image quality was consistent between all groups (observer 1: P = 0.118; observer 2: P = 0.122). Inter-reader consistency was very good (κ = 0.866, P < 0.001). Dose-length-product was significantly reduced in HP and RC groups ( P < 0.001 for each; SP SC : 139.5 mGycm; HP RC : 92 mGycm; SP SC : 211 mGycm; HP RC : 137 mGycm). sSNR was comparable (sSNR PT overall: P = 0.052; sSNR S1 overall: P = 0.161; and sSNR S10 overall: P = 0.259).
Conclusions
Substantial dose reduction can be within a routine clinical setting without quantifiable loss of image quality either by HP pulmonary angiography or by a combination of IR and RC in either HP or SP acquisition.
Introduction
Pulmonary embolism (PE) is considered the third most common cause of acute cardiovascular disease, accounting for 5–10% of hospital deaths in the United States . Computed tomography (CT) pulmonary angiography (CTPA) has been established as the first-line imaging modality and the standard of care imaging test for the diagnosis of PE . CTPA is noninvasive, has a high sensitivity and specificity, is widely available, cost-effective, and can simultaneously evaluate a variety of differential diagnoses . Depending on successful evaluation of pretest likelihood, incidence of PE on CT angiography (CTA) is 5–15% . Thus, the number of patients receiving ionizing radiation in CTPA for suspected PE with a negative test result is far in excess of the true-positive cases. In addition, several studies have been suggesting that in clinical routine, inadequate pretest screening negatively impacts this percentage . Increasing use of CTPA has therefore led to continuous efforts to optimize standard CTPA protocols and thus reduce the radiation dose (RD) of CTPA while maintaining image quality .
In recent years, several technical advances at CT have enabled significant reduction of RD at CTPA . Among these, tube voltage reduction from 120 kV to 100 kV can lower radiation exposure by 50% alone . High-pitch (HP) protocols with pitch values up to 3.4 are available on dual-source CT scanners through use of simultaneous data acquisition from both x-ray tubes and detectors. This can reduce RD on the order of 30% . Model-based iterative reconstruction algorithms substantially reduce image noise and are therefore ideal for use in combination with low-dose acquisitions . Because of the increasing use of CTPA, implementation of these dose-saving techniques in standard clinical protocols has become a relevant factor to reduce medical radiation exposure . Benefits of individual protocol changes have been well demonstrated in medium- and small-size patient populations. However, a systematic confirmation of a combination of these dose-reduction techniques against standard dose protocols in both dual-source and single-source acquisitions on a large sample population in a routine clinical setting has not yet been reported.
Get Radiology Tree app to read full this article<
Materials and Methods
Get Radiology Tree app to read full this article<
Patient Population
Get Radiology Tree app to read full this article<
TABLE 1
Acquisition Parameters and Reconstruction Algorithm Corresponding to Group Number
Parameter_HP SC__HP RC__SP SC__SP RC_ Tube activation Single source Dual source Single source Dual source Collimation 128 × 0.6 mm 128 × 0.6 mm 128 × 0.6 mm 128 × 0.6 mm Rotation time (s) 0.5 0.28 0.5 0.28 Pitch 3.0 3.0 1.2 1.2 Reference tube current time product (mAs) 180 90 180 90 Tube voltage (kV) 100 100 100 100 Reconstruction algorithm wFBP SAFIRE wFBP SAFIRE
HP RC , high pitch, reduced tube current; HP SC , high pitch, standard tube current; SAFIRE, sinogram-affirmed iterative reconstruction; SP RC , standard pitch, reduced tube current; SP SC , standard pitch, standard tube current; wFBP, weighted filtered back projection.
Get Radiology Tree app to read full this article<
CT Protocols
Get Radiology Tree app to read full this article<
Get Radiology Tree app to read full this article<
Get Radiology Tree app to read full this article<
Contrast Medium Application
Get Radiology Tree app to read full this article<
Get Radiology Tree app to read full this article<
Image Reconstruction
Get Radiology Tree app to read full this article<
Get Radiology Tree app to read full this article<
Get Radiology Tree app to read full this article<
Quantitative Analysis/Objective Image Analysis
Get Radiology Tree app to read full this article<
Get Radiology Tree app to read full this article<
Get Radiology Tree app to read full this article<
Get Radiology Tree app to read full this article<
Qualitative Analysis/Subjective Image Analysis
Get Radiology Tree app to read full this article<
TABLE 2
Five-point Likert Scales for Image Quality and Overall Image Noise
Image Quality of Pulmonary Vasculature 1 Excellent to the very peripheral branches beyond the subsegmental level, i.e. arteries of the fifth order or lower 2 Good, exclusion of PE to the subsegmental level still possible 3 Moderate, exclusion of PE up to the segmental level is possible, with uncertainties beyond 4 Still diagnostic to the lobar level, but significantly reduced confidence beyond 5 Not fully diagnostic, only central PE could be excluded
Overall Image Noise 1 Excellent, even large homogenous areas are low in noise 2 Good, without degradation of the pulmonary vessel margin delineation due to image noise 3 Moderate, image noise is limiting the evaluation of the pulmonary parenchyma 4 Excessive noise, poor delineation of the bronchiolar vessel margins, considerable image noise in the chest wall and mediastinal structures, yet still diagnostic image 5 Diagnostic evaluation impracticable because of noise artifacts
Get Radiology Tree app to read full this article<
RD Measurements
Get Radiology Tree app to read full this article<
Parameter Calculation
Get Radiology Tree app to read full this article<
Statistical Analysis
Get Radiology Tree app to read full this article<
Results
Population
Get Radiology Tree app to read full this article<
TABLE 3
Group Demographics, Thorax Diameters, and Radiation Dose
Group_N_ Age (years) Gender (m/w) TD hor /TD ver CTDI vol (mGy) DLP (mGycm)HP SC \* 92 60.7 ± 18.5 45/47 36.9 ± 3.9/23.4 ± 15.4 3.99 (3.89–4.05) 139.5 (133–143)HP RC \\ 100 63.5 ± 15.7 52/48 36.4 ± 3.9/22.3 ± 6.4 2.53 (2.33–2.65) 92 (82–96)SP SC \\\* 96 59.5 ± 16.8 64/32 37.1 ± 4.3/23.0 ± 9.5 7.12 (6.66–7.30) 211 (197–220)SP RC \\\\ 94 64.2 ± 15.0 55/39 37.0 ± 4.3/23.3 ± 8.8 4.01 (3.86–4.06) 137 (116–147)
CTDI vol , CT dose index volume; DLP, dose-length-product; TD hor , horizontal thorax diameter; TD ver , vertical thorax diameter.
Get Radiology Tree app to read full this article<
Get Radiology Tree app to read full this article<
Get Radiology Tree app to read full this article<
Get Radiology Tree app to read full this article<
Get Radiology Tree app to read full this article<
Quantitative Analysis
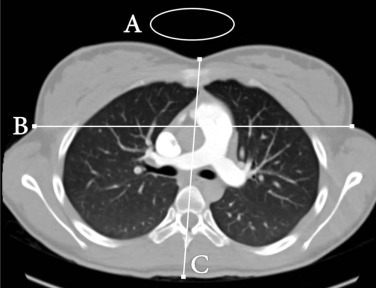
Measurements of Patient Habitus
Get Radiology Tree app to read full this article<
Vascular Attenuation
Get Radiology Tree app to read full this article<
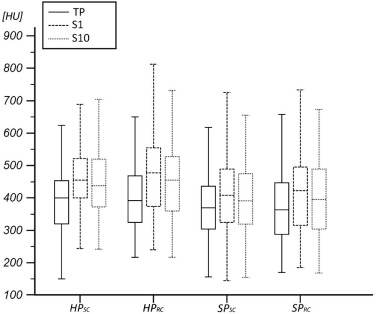
Get Radiology Tree app to read full this article<
Get Radiology Tree app to read full this article<
BN
Get Radiology Tree app to read full this article<
Image Noise
SD PT
Get Radiology Tree app to read full this article<
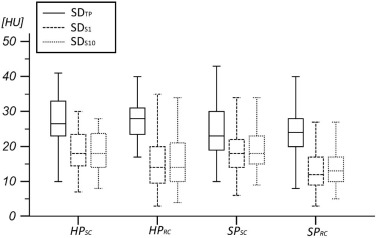
Get Radiology Tree app to read full this article<
SD S1 /SD S10
Get Radiology Tree app to read full this article<
SNR
Get Radiology Tree app to read full this article<
TABLE 4
Quantitative Image Noise per Group
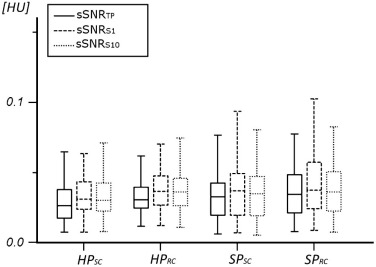
HP SC__HP RC__SP SC__SP RC SNR PT 36.40 (26.91–45.36) 38.78 (34.67–51.94) 41.95 (29.94–52.22) 44.04 (31.90–57.69) SNR S1 41.16 (34.67–51.94) 46.48 (36.38–54.94) 45.51 (31.28–60.75) 51.29 (35.73–68.36) SNR S10 41.43 (34.11–52.21) 44.89 (36.26–53.14) 44.17 (28.38–58.96) 46.03 (33.87–61.19) sSNR PT 0.027 (0.026–0.032) 0.031 (0.031–0.036) 0.033 (0.032–0.040) 0.035 (0.033–0.041) sSNR S1 0.032 (0.031–0.037) 0.037 (0.036–0.042) 0.037 (0.035–0.044) 0.038 (0.038–0.048) sSNR S10 0.030 (0.030–0.036) 0.037 (0.035–0.041) 0.035 (0.033–0.043) 0.036 (0.036–0.045)
CTDI vol , CT dose index volume; DLP, dose-length-product; HP RC , high pitch, reduced tube current; HP SC , high pitch, standard tube current; SNR, signal-to-noise ratio; SP RC , standard pitch, reduced tube current; SP SC , standard pitch, standard tube current; sSNR, standardized signal-to-noise ratio; TD hor , horizontal thorax diameter; TD ver , vertical thorax diameter.
Values are presented as median (25th–75th quartiles).
Get Radiology Tree app to read full this article<
Qualitative Analysis
Image Quality per Reader
Get Radiology Tree app to read full this article<
TABLE 5
Subjective Rating for Each Group
HP SC__HP RC__SP SC__SP RC Observer 1 Observer 2 Observer 1 Observer 2 Observer 1 Observer 2 Observer 1 Observer 2 “excellent” (1/5) to “good”(2/5) image quality 47 (94%) 47 (94%) 43 (86%) 44 (88%) 40 (80%) 41 (83%) 43 (86%) 43 (86%) “moderate”(3/5) image quality 3 (6%) 3 (6%) 7 (14%) 6 (12%) 9 (18%) 9 (18%) 6 (12%) 6 (12%) “very low” (1/5) to “low” (2/5) image noise 1 31 (64%) 32 (64%) 37 (74%) 38 (76%) 43 (86%) 44 (88%) 49 (98%) 50 (100%) “medium” (3/5) image noise a 17 (34%) 16 (32%) 13 (26%) 12 (24%) 7 (14%) 6 (12%) 1 (2%) 0 (0%) Movement artifacts \* 0 (0%) 0 (0%) 1 (2%) 1 (2%) 7 (14%) 6 (12%) 12 (24%) 13 (26%) Contrast artifacts \\ 1 (2%) 1 (2%) 2 (4%) 2 (4%) 6 (12%) 7 (14%) 2 (4%) 2 (4%)
HP RC , high pitch, reduced tube current; HP SC , high pitch, standard tube current; SP RC , standard pitch, reduced tube current; SP SC , standard pitch, standard tube current.
Get Radiology Tree app to read full this article<
Get Radiology Tree app to read full this article<
Get Radiology Tree app to read full this article<
Interobserver Agreement
Get Radiology Tree app to read full this article<
Get Radiology Tree app to read full this article<
Get Radiology Tree app to read full this article<
RD
Get Radiology Tree app to read full this article<
Discussion
Get Radiology Tree app to read full this article<
Get Radiology Tree app to read full this article<
Get Radiology Tree app to read full this article<
Get Radiology Tree app to read full this article<
Get Radiology Tree app to read full this article<
Conclusion
Get Radiology Tree app to read full this article<
References
1. Nikolaou K., Thieme S., Sommer W., et. al.: Diagnosing pulmonary embolism: new computed tomography applications. J Thorac Imaging 2010; 25: pp. 151-160.
2. Park B., Messina L., Dargon P., et. al.: Recent trends in clinical outcomes and resource utilization for pulmonary embolism in the United States: findings from the nationwide inpatient sample. Chest 2009; 136: pp. 983-990.
3. Bettmann M.A., Baginski S.G., White R.D., et. al.: ACR Appropriateness Criteria® acute chest pain—suspected pulmonary embolism. J Thorac Imaging 2012; 27: pp. W28-W31.
4. Weiss C.R., Scatarige J.C., Diette G.B., et. al.: CT pulmonary angiography is the first-line imaging test for acute pulmonary embolism: a survey of US clinicians. Acad Radiol 2006; 13: pp. 434-446.
5. Henzler T., Barraza J.M., Nance J.W., et. al.: CT imaging of acute pulmonary embolism. J Cardiovasc Comput Tomogr 2011; 5: pp. 3-11.
6. Mayo J., Thakur Y.: Pulmonary CT angiography as first-line imaging for PE: image quality and radiation dose considerations. AJR Am J Roentgenol 2013; 200: pp. 522-528.
7. Kanaan Y., Knoepp U.D., Kelly A.M.: The influence of education on appropriateness rates for CT pulmonary angiography in emergency department patients. Acad Radiol 2013; 20: pp. 1107-1114.
8. Crichlow A., Cuker A., Mills A.M.: Overuse of computed tomography pulmonary angiography in the evaluation of patients with suspected pulmonary embolism in the emergency department. Acad Emerg Med 2012; 19: pp. 1219-1226.
9. Huisman M.V., Klok F.A.: Diagnostic management of clinically suspected acute pulmonary embolism. J Thromb Haemost 2009; 7: pp. 312-317.
10. McLaughlin P.D., Liang T., Homiedan M., et. al.: High pitch, low voltage dual source CT pulmonary angiography: assessment of image quality and diagnostic acceptability with hybrid iterative reconstruction. Emerg Radiol 2015; 22: pp. 117-123.
11. Bauer R.W., Kramer S., Renker M., et. al.: Dose and image quality at CT pulmonary angiography-comparison of first and second generation dual-energy CT and 64-slice CT. Eur Radiol 2011; 21: pp. 2139-2147.
12. De Zordo T., von Lutterotti K., Dejaco C., et. al.: Comparison of image quality and radiation dose of different pulmonary CTA protocols on a 128-slice CT: high-pitch dual source CT, dual energy CT and conventional spiral CT. Eur Radiol 2012; 22: pp. 279-286.
13. Schenzle J.C., Sommer W.H., Neumaier K., et. al.: Dual energy CT of the chest: how about the dose?. Invest Radiol 2010; 45: pp. 347-353.
14. Bauer R.W., Schell B., Beeres M., et. al.: High-pitch dual-source computed tomography pulmonary angiography in freely breathing patients. J Thorac Imaging 2012; 27: pp. 376-381.
15. Sagara Y., Hara A.K., Pavlicek W., et. al.: Abdominal CT: comparison of low-dose CT with adaptive statistical iterative reconstruction and routine-dose CT with filtered back projection in 53 patients. AJR Am J Roentgenol 2010; 195: pp. 713-719.
16. Hu X.H., Ding X.F., Wu R.Z., et. al.: Radiation dose of non-enhanced chest CT can be reduced 40% by using iterative reconstruction in image space. Clin Radiol 2011; 66: pp. 1023-1029.
17. Baumueller S., Winklehner A., Karlo C., et. al.: Low-dose CT of the lung: potential value of iterative reconstructions. Eur Radiol 2012; 22: pp. 2597-2606.
18. Ebersberger U., Tricarico F., Schoepf U.J., et. al.: CT evaluation of coronary artery stents with iterative image reconstruction: improvements in image quality and potential for radiation dose reduction. Eur Radiol 2013; 23: pp. 125-132.
19. Kerl J.M., Lehnert T., Schell B., et. al.: Intravenous contrast material administration at high-pitch dual-source CT pulmonary angiography: test bolus versus bolus-tracking technique. Eur J Radiol 2012; 81: pp. 2887-2891.
20. Hou D.J., Tso D.K., Davison C., et. al.: Clinical utility of ultra high pitch dual source thoracic CT imaging of acute pulmonary embolism in the emergency department: are we one step closer towards a non-gated triple rule out?. Eur J Radiol 2013; 82: pp. 1793-1798.
21. Co S.J., Mayo J., Liang T., et. al.: Iterative reconstructed ultra high pitch CT pulmonary angiography with cardiac bowtie-shaped filter in the acute setting: effect on dose and image quality. Eur J Radiol 2013; 82: pp. 1571-1576.
22. Pontana F., Moureau D., Schmidt B., et. al.: CT pulmonary angiogram with 60% dose reduction: influence of iterative reconstructions on image quality. Diagn Interv Imaging 2015; 96: pp. 487-493.
23. Montet X., Hachulla A.L., Neroladaki A., et. al.: Image quality of low mA CT pulmonary angiography reconstructed with model based iterative reconstruction versus standard CT pulmonary angiography reconstructed with filtered back projection: an equivalency trial. Eur Radiol 2015; 25: pp. 1665-1671.