
Rationale and Objectives
To use an automatic computed tomography (CT) dose monitoring system to analyze the institutional chest and abdominopelvic CT dose data as regards the updated 2017 American College of Radiology (ACR) diagnostic reference levels (DRLs) based on water-equivalent diameter (Dw) and size-specific dose estimates (SSDE) to detect patient-size subgroups in which CT dose can be optimized.
Materials and Methods
All chest CT examinations performed between July 2016 and April 2017 with and without contrast material, CT of the pulmonary arteries, and abdominopelvic CT with and without contrast material were included in this retrospective study. Dw and SSDE were automatically calculated for all scans using a previously validated in-house developed Matlab software and stored into our CT dose monitoring system. CT dose data were analyzed as regards the updated ACR DRLs (size groups: 21–25 cm, 25–29 cm, 29–33 cm, 33–37 cm, 37–41 cm). SSDE and volumetric computed tomography dose index (CTDIvol) were used as CT dose parameter.
Results
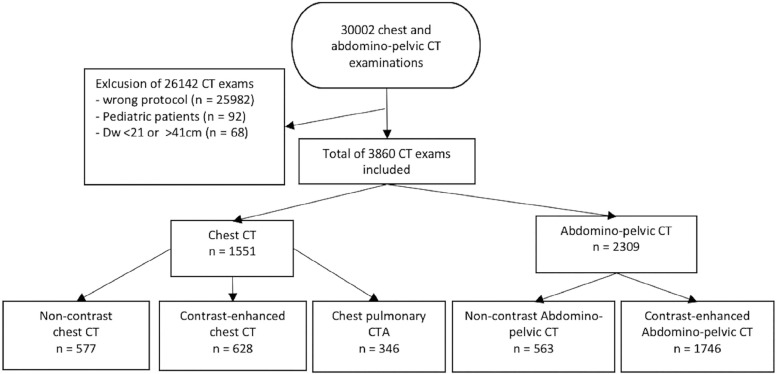
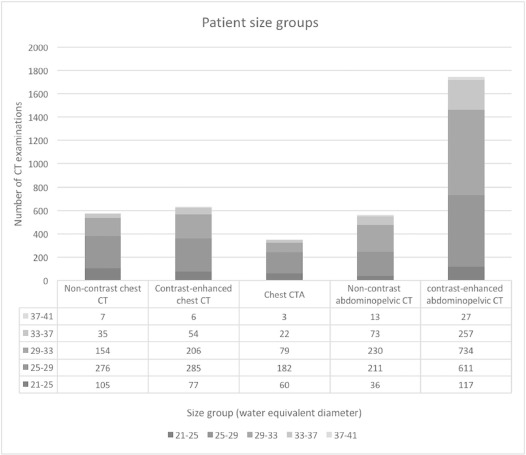
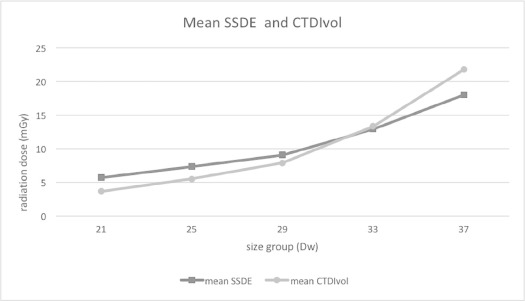
Overall, 30,002 CT examinations were performed in the study period, 3860 of which were included in the analysis (mean age 62.1 ± 16.4 years, Dw 29.0 ± 3.3 cm; n = 577 chest CT without contrast material, n = 628 chest CT with contrast material, n = 346 CT of chest pulmonary, n = 563 abdominopelvic CT without contrast material, n = 1746 abdominopelvic CT with contrast material). Mean SSDE and CTDIvol relative to the updated DRLs were 43.3 ± 26.4 and 45.1 ± 27.9% for noncontrast chest CT, 52.3 ± 23.1 and 52.0 ± 23.1% for contrast-enhanced chest CT, 68.8 ± 29.5 and 70.0 ± 31.0% for CT of pulmonary arteries, 41.9 ± 29.2 and 43.3 ± 31.3% for noncontrast abdominopelvic CT, and 56.8 ± 22.2 and 58.8 ± 24.4% for contrast-enhanced abdominopelvic CT. Lowest dose compared to the DRLs was found for the Dw group of 21–25 cm in noncontrast abdominopelvic CT (SSDE 30.4 ± 21.8%, CTDIvol 30.8 ± 21.4%). Solely the group of patients with a Dw of 37–41 cm undergoing noncontrast abdominopelvic CT exceeded the ACR DRL (SSDE 100.3 ± 59.0%, CTDIvol 107.1 ± 63.5%).
Conclusions
On average, mean SSDE and CTDIvol of our institutional chest and abdominopelvic CT protocols were lower than the updated 2017 ACR DRLs. Size-specific subgroup analysis revealed a wide variability of SSDE and CTDIvol across CT protocols and patient size groups with a transgression of DRLs in noncontrast abdominopelvic CT of large patients (Dw 37–41 cm).
Introduction
In computed tomography (CT), radiation output has to be adapted to patient size to achieve reasonable image quality while complying with the “as low as reasonably achievable” principle . Different methods can be used to adapt CT dose to patient size. This includes the implementation of specific CT protocols adapted to different patient size groups or automated CT dose exposure control techniques such as automated tube current modulation and automated tube voltage selection . The dose adaption process of automated CT dose exposure control is vendor dependent. In the CT scanners used in this study (Siemens Healthineers, Forchheim, Germany), a reference milliampere time product (ref. mAs) determines the mAs used for the tube current modulation along the z-axis. However, different strength levels can also be selected to adjust the strength of the mAs adaption to patient size . This allows for adaption of one CT protocol to different patient size groups.
Diagnostic reference levels (DRLs) are provided in various countries and may help to perform quality assurance and dose optimization in CT . Usually, DRLs are provided for body regions and normal weight patients and include a reference volumetric computed tomography dose index (CTDIvol) and dose length product (DLP) . CTDIvol and DLP represent CT dose output and are automatically provided by modern CT scanners. The limited complexity of the current DRLs allows for an easy analysis of CT dose data; however, a limitation may be the level of detail when using such DRLs for dose analysis and optimization.
Get Radiology Tree app to read full this article<
Get Radiology Tree app to read full this article<
Get Radiology Tree app to read full this article<
Methods
Get Radiology Tree app to read full this article<
Get Radiology Tree app to read full this article<
CT Protocols
Get Radiology Tree app to read full this article<
Get Radiology Tree app to read full this article<
Get Radiology Tree app to read full this article<
Get Radiology Tree app to read full this article<
TABLE 1
Institutional Contrast Material Administration Protocol
<60 kg 60–80 kg 80–100 kg >100 kg Chest CT 60 mL 70 mL 80 mL 90 mL Abdominopelvic CT 80 mL 90 mL 100 mL 120 mL
TABLE 2
Scan Parameters of the CT Protocols Included in this Study
Protocol Scan Region Reference Tube Voltage (kVp) Reference Tube Current Time Product (mAs) Pitch Noncontrast chest CT Thoracic inlet–costodiaphragmatic recesses 100 60 1.2 Contrast-enhanced chest CT Thoracic inlet–costodiaphragmatic recesses 100 60–140 \* 0.6 Chest CTA Thoracic inlet–costodiaphragmatic recesses 100 130–160 \* 1.2 Non-contrast abdominal CT Diaphragm–ischium 120 120–150 \* 0.6 Contrast-enhanced abdominal CT Diaphragm–ischium 120 150 0.6
Get Radiology Tree app to read full this article<
Get Radiology Tree app to read full this article<
SSDE Calculation
Get Radiology Tree app to read full this article<
Get Radiology Tree app to read full this article<
Comparison of Institutional SSDE and CTDIvol Values to the ACR DRLs
Get Radiology Tree app to read full this article<
Results
Examinations and Patient Characteristics
Get Radiology Tree app to read full this article<
TABLE 3
Patient Characteristics and Radiation Dose Parameters
Noncontrast Chest CT Contrast-enhanced Chest CT Chest CTA Noncontrast Abdominopelvic CT Contrast-enhanced Abdominopelvic CT All_N_ 577 628 346 563 1746 3860 Mean age 62.3 ± 15.2 61.9 ± 16.7 66.1 ± 16.0 57.1 ± 19.2 63.1 ± 15.8 62.1 ± 16.4 Mean Dw 279.4 ± 31.8 280.6 ± 31.9 277.6 ± 31.5 296.9 ± 32.0 297.6 ± 32.9 290.2 ± 33.5 Mean SSDE 5.8 ± 3.7 7.3 ± 3.6 10.9 ± 5.1 7.7 ± 6.0 9.8 ± 4.6 8.6 ± 4.9 Mean CTDIvol 4.6 ± 3.5 5.9 ± 3.5 8.6 ± 4.9 6.8 ± 6.5 8.6 ± 5.2 7.3 ± 5.1
CT, computed tomography; CTA, computed tomography angiography; CTDIvol, volumetric computed tomography dose index; Dw, water equivalent diameter; SSDE, size-specific dose estimate.
Get Radiology Tree app to read full this article<
SSDE and CTDIvol
Get Radiology Tree app to read full this article<
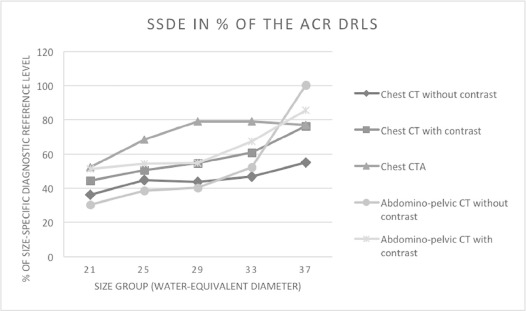
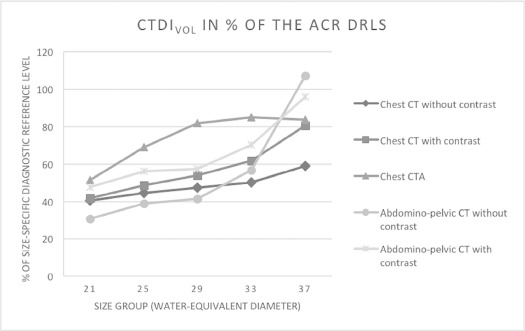
TABLE 4
Detailed Findings Across the Different CT Protocols and Patient Size Groups
Noncontrast Chest CT Size Group_n_ Age (y) SSDE (mGy) CTDIvol (mGy) SSDE% CTDIvol% 21–25 cm 105 59.6 ± 17.3 4.4 ± 2.3 2.8 ± 1.6 36.3 ± 19.4 40.4 ± 22.2 25–29 cm 276 61.9 ± 15.8 5.4 ± 3.3 4.0 ± 2.5 44.9 ± 27.5 44.6 ± 27.9 29–33 cm 154 64.8 ± 13.2 6.6 ± 3.9 5.7 ± 3.5 43.9 ± 26.3 47.5 ± 29.0 33–37 cm 35 63.6 ± 9.6 8.4 ± 5.6 8.5 ± 5.9 46.7 ± 31.1 50.2 ± 34.4 37–41 cm 7 55.5 ± 9.9 10.5 ± 6.6 12.4 ± 7.7 55.1 ± 34.8 58.9 ± 36.9
Contrast-enhanced Chest CT Size Group_n_ Age (y) SSDE (mGy) CTDIvol (mGy) SSDE% CTDIvol% 21–25 cm 77 57.8 ± 17.9 5.3 ± 2.5 3.3 ± 1.6 44.5 ± 21.0 41.7 ± 20.0 25–29 cm 285 61.8 ± 16.9 6.5 ± 2.7 4.8 ± 2.0 50.6 ± 20.9 48.6 ± 20.5 29–33 cm 206 63.1 ± 13.1 8.1 ± 3.7 6.9 ± 3.1 54.7 ± 24.7 53.9 ± 24.5 33–37 cm 54 58.6 ± 14.5 10.6 ± 4.7 10.4 ± 4.7 60.9 ± 26.5 61.7 ± 27.2 37–41 cm 6 55.1 ± 10.3 14.6 ± 4.0 16.9 ± 4.5 76.2 ± 22.0 80.6 ± 24.9
Chest CTA Size Group_n_ Age (y) SSDE (mGy) CTDIvol (mGy) SSDE% CTDIvol% 21–25 cm 60 64.5 ± 19.4 7.3 ± 3.2 4.6 ± 2.1 52.2 ± 23.1 51.3 ± 23.1 25–29 cm 182 67.5 ± 15.7 10.2 ± 4.1 7.6 ± 3.1 68.3 ± 27.6 69.0 ± 28.3 29–33 cm 79 67.3 ± 14.1 13.5 ± 5.5 11.4 ± 4.9 79.2 ± 32.5 81.7 ± 34.7 33–37 cm 22 56.5 ± 10.6 15.8 ± 6.3 16.1 ± 6.5 79.2 ± 31.4 84.9 ± 34.0 37–41 cm 3 51.3 ± 14.2 17.7 ± 1.5 20.9 ± 2.6 77.0 ± 6.5 83.7 ± 10.4
Noncontrast Abdominopelvic CT Size Group_n_ Age (y) SSDE (mGy) CTDIvol (mGy) SSDE% CTDIvol% 21–25 cm 36 43.5 ± 19.4 4.3 ± 3.1 2.8 ± 1.9 30.4 ± 21.8 30.8 ± 21.4 25–29 cm 211 55.5 ± 21.9 6.2 ± 3.7 4.7 ± 2.9 38.5 ± 23.1 38.9 ± 24.1 29–33 cm 230 60.1 ± 16.7 7.6 ± 4.7 6.6 ± 4.1 40.2 ± 25.1 41.4 ± 25.8 33–37 cm 73 58.7 ± 15.8 11.5 ± 8.4 11.9 ± 9.1 52.2 ± 38.2 56.8 ± 43.5 37–41 cm 13 60.6 ± 11.6 22.1 ± 12.0 26.8 ± 15.9 100.3 ± 59.0 107.1 ± 63.5
Contrast-enhanced Abdominopelvic CT Size Group_n_ Age (y) SSDE (mGy) CTDIvol (mGy) SSDE% CTDIvol% 21–25 cm 117 56.2 ± 18.8 6.7 ± 1.9 4.3 ± 1.3 51.5 ± 14.3 47.8 ± 14.0 25–29 cm 611 61.8 ± 16.7 8.2 ± 2.8 6.2 ± 2.2 54.5 ± 18.6 56.0 ± 20.1 29–33 cm 734 65.6 ± 14.4 9.9 ± 3.6 8.6 ± 3.3 54.8 ± 19.8 57.5 ± 21.8 33–37 cm 257 62.7 ± 14.5 14.2 ± 6.5 14.8 ± 7.1 67.6 ± 31.1 70.3 ± 33.8 37–41 cm 27 56.3 ± 14.0 18.8 ± 7.1 23.0 ± 8.7 85.4 ± 32.3 95.8 ± 36.3
cm, centimeter; CT, computed tomography; CTA, computed tomography angiography; CTDIvol, volumetric computed tomography dose index; Dw, water equivalent diameter; mGy, milligray; SSDE, size-specific dose estimate.
Get Radiology Tree app to read full this article<
Discussion
Get Radiology Tree app to read full this article<
Get Radiology Tree app to read full this article<
Get Radiology Tree app to read full this article<
Get Radiology Tree app to read full this article<
Get Radiology Tree app to read full this article<
Get Radiology Tree app to read full this article<
Get Radiology Tree app to read full this article<
Conclusions
Get Radiology Tree app to read full this article<
References
1. Willis C.E., Slovis T.L.: The ALARA concept in radiographic dose reduction. Radiol Technol 2004; 76: pp. 150-152.
2. Boos J., Kröpil P., Lanzman R.S., et. al.: CT pulmonary angiography: simultaneous low-pitch dual-source acquisition mode with 70 kVp and 40 ml of contrast medium and comparison with high-pitch spiral dual-source acquisition with automated tube potential selection. Br J Radiol 2016; 89: 20151059
3. MacDougall R.D., Kleinman P.L., Callahan M.J.: Size-based protocol optimization using automatic tube current modulation and automatic kV selection in computed tomography. J Appl Clin Med Phys 2016; 17: pp. 328-341.
4. Diagnostic reference levels in medical imaging: review and additional advice. Ann ICRP 2001; 31: pp. 33-52.
5. Valentin J.: Radiation and your patient: a guide for medical practitioners. Ann ICRP 2001; 31: pp. 5-31.
6. Rosenstein M.: Diagnostic reference levels for medical exposure of patients: ICRP guidance and related ICRU quantities. Health Phys 2008; 95: pp. 528-534.
7. Kanal K.M., Butler P.F., Sengupta D., et. al.: U.S. diagnostic reference levels and achievable doses for 10 adult CT examinations. Radiology 2017; 284: pp. 120-133.
8. AAPM : Report No. 204 - Size-Specific Dose Estimates (SSDE) in Pediatric and Adult Body CT Examinations. Available at: https://www.aapm.org/pubs/reports/RPT_204.pdf
9. Boos J., Kröpil P., Bethge O.T., et. al.: Accuracy of size-specific dose estimate calculation from center slice in computed tomography. Radiat Prot Dosimetry 2018 Jan 1; 178: pp. 8-19. Erratum in: Radiat Prot Dosimetry. 2018 Feb 1;178(3):343
10. Newman B., Callahan M.J.: ALARA (as low as reasonably achievable) CT 2011—executive summary. Pediatr Radiol 2011; pp. 453-455.
11. Parikh R.A., Wien M.A., Novak R.D., et. al.: A comparison study of size-specific dose estimate calculation methods. Pediatr Radiol 2017; 265: 3rd ed. Springer Berlin Heidelberg; 832–10
12. Jucius R.A., Kambic G.X.: Radiation Dosimetry In Computed Tomography (CT).1977.pp. 286-295.
13. Huda W., Mettler F.A.: Volume CT dose index and dose-length product displayed during CT: what good are they?. Radiology 2011; 258: pp. 236-242. Radiological Society of North America, Inc
14. McCollough C.H., Leng S., Yu L., et. al.: CT dose index and patient dose: they are not the same thing. Radiology 2011; 259: pp. 311-316. Radiological Society of North America, Inc
15. Brink J.A., Morin R.L.: Size-specific dose estimation for CT: how should it be used and what does it mean?. Radiology 2012; 265: pp. 666-668. Radiological Society of North America, Inc
16. Christianson O., Li X., Frush D., et. al.: Automated size-specific CT dose monitoring program: assessing variability in CT dose. Med Phys 2012; 39: pp. 7131-7139.
17. European Commission : Diagnostic Reference Levels in Thirty-six European Countries. European Commission. 2014 Dec pp. 1–73; Available at: https://ec.europa.eu/energy/sites/ener/files/documents/RP180%20part2.pdf Accessed March 15, 2018
18. Ikuta I., Warden G.I., Andriole K.P., et. al.: Estimating patient dose from x-ray tube output metrics: automated measurement of patient size from CT images enables large-scale size-specific dose estimates. Radiology 2014; 270: pp. 472-480. Radiological Society of North America
19. Leng S., Shiung M., Duan X., et. al.: Size-specific dose estimates for chest, abdominal, and pelvic CT: effect of intrapatient variability in water-equivalent diameter. Radiology 2015; 277: pp. 308-309. Radiological Society of North America
20. Anam C., Haryanto F., Widita R., et. al.: The impact of patient table on size-specific dose estimate (SSDE). Australas Phys Eng Sci Med 2017; 40: pp. 153-158. Springer Netherlands
21. Abdollahi H., Shiri I., Salimi Y., et. al.: Radiation dose in cardiac SPECT/CT: An estimation of SSDE and effective dose. Eur J Radiol 2016; 85: pp. 2257-2261.
22. Baker M.E., Karim W., Bullen J.A., et. al.: Estimated patient dose indexes in adult and pediatric MDCT: comparison of automatic tube voltage selection with fixed tube current, fixed tube voltage, and weight-based protocols. AJR Am J Roentgenol 2015; 205: pp. 592-598.
23. Fujii K., McMillan K., Bostani M., et. al.: Patient size-specific analysis of dose indexes from CT lung cancer screening. AJR Am J Roentgenol 2017; 208: pp. 144-149.
24. Imai R., Miyazaki O., Horiuchi T., et. al.: Local diagnostic reference level based on size-specific dose estimates: assessment of pediatric abdominal/pelvic computed tomography at a Japanese national children’s hospital. Pediatr Radiol 2015; 45: pp. 345-353. Springer Berlin Heidelberg
25. Boos J., Meineke A., Rubbert C., et. al.: Cloud-based CT dose monitoring using the DICOM-structured report: fully automated analysis in regard to national diagnostic reference levels. Rofo. © Georg Thieme Verlag KG 2016; 188: pp. 288-294.
26. Boos J., Meineke A., Bethge O.T., et. al.: Dose monitoring in radiology departments: status quo and future perspectives. Rofo. © Georg Thieme Verlag KG 2016; 188: pp. 443-450.
27. German Federal Office for Radiation Protection : Publication of the updated diagnostic reference levels for diagnostic and interventional x-ray examinations. Available at: http://www.bfs.de/EN/topics/ion/medicine/diagnostics/reference-values/reference-values.html
28. Jaffe T.A., Hoang J.K., Yoshizumi T.T., et. al.: Radiation dose for routine clinical adult brain CT: Variability on different scanners at one institution. AJR Am J Roentgenol 2010; 195: pp. 433-438.
29. Mileto A., Nelson R.C., Larson D.G., et. al.: Variability in radiation dose from repeat identical CT examinations: longitudinal analysis of 2851 patients undergoing 12,635 thoracoabdominal CT scans in an academic health system. AJR Am J Roentgenol 2017; 208: pp. 1285-1296.
30. Harri P.A., Moreno C.C., Nelson R.C., et. al.: Variability of MDCT dose due to technologist performance: impact of posteroanterior versus anteroposterior localizer image and table height with use of automated tube current modulation. AJR Am J Roentgenol 2014; 203: pp. 377-386.