
Rationale and Objectives
Existing cardiac imaging methods do not allow for improved temporal resolution when considering a targeted region of interest (ROI). The imaging method presented here enables improved temporal resolution for ROI imaging (namely, a reconstruction volume smaller than the complete field of view). Clinically, temporally targeted reconstruction would not change the primary means of reconstructing and evaluating images, but rather would enable the adjunct technique of ROI imaging, with improved temporal resolution compared with standard reconstruction (∼20% smaller temporal scan window). In gated cardiac computed tomography (CT) scans improved temporal resolution directly translates into a reduction in motion artifacts for rapidly moving objects such as the coronary arteries.
Materials and Methods
Retrospectively electrocardiogram gated coronary angiography data from a 64-slice CT system were used. A motion phantom simulating the motion profile of a coronary artery was constructed and scanned. Additionally, an in vivo study was performed using a porcine model. Comparisons between the new reconstruction technique and the standard reconstruction are given for an ROI centered on the right coronary artery, and a pulmonary ROI.
Results
In both a well-controlled motion model and a porcine model results show a decrease in motion induced artifacts including motion blur and streak artifacts from contrast enhanced vessels within the targeted ROIs, as assessed through both qualitative and quantitative observations.
Conclusion
Temporally targeted reconstruction techniques demonstrate the potential to reduce motion artifacts in coronary CT. Further study is warranted to demonstrate the conditions under which this technique will offer direct clinical utility. Improvement in temporal resolution for gated cardiac scans has implications for improving: contrast enhanced CT angiography, calcium scoring, and assessment of the pulmonary anatomy.
The use of electrocardiogram (ECG)-gated computed tomography (CT) in the assessment of coronary artery disease has been rapidly escalating in recent years, and is increasingly recognized as an accurate, noninvasive means to detect obstructive coronary artery disease ( ). The utility of cardiac CT has been demonstrated in both calcium scoring and contrast enhanced coronary angiography ( ). It has been recommended that calcium scoring be applied to the asymptomatic population for risk assessment; while CT angiography may serve as an alternative or adjunct to invasive coronary catheterizations for a subset of symptomatic patients ( ). Scanning with state-of-the-art 64-slice multidetector (MD)CT scanners has demonstrated a high negative predictive value for the identification of significant lesions (ie, those stenoses that are greater than 50%) ( ), thereby demonstrating significant clinical utility of 64-slice MDCT scanners. To lower the heart rate, β-blocker medication is routinely prescribed to the patient before scanning. However, because of the intrinsic requirement for mechanical rotation of both the source and detector in MDCT scanners, motion blurring can still occur in the reconstructed coronary angiography images. In a recent study using a state-of-the-art 64-slice scanner, some motion artifacts were present in approximately half of the examined coronary segments, and moderate motion artifacts were present in 14% of the examined coronary segments ( ). To combat these artifacts, one vendor recently released a dual source scanner ( ) that offers significant gains in temporal resolution. However, because there is a large installation base of single source scanners the task of improving image quality on these scanners is of significant consequence. Therefore a need remains to improve on the current image reconstruction techniques for single source CT scanners. The technique proposed in this work enables improved temporal resolution for regions of interest (ROIs).
Standard clinical reconstruction of the entire field of view (FOV) requires projection data acquired over an angular range of 180° plus the angle covered by the fan beam (“fan angle”) ( ). Current state-of-the-art cardiac imaging methods do not allow for improved temporal resolution when considering a targeted ROI. Recently, it has been shown that reconstruction of an ROI is possible with a reduced angular scan range ( ). By reducing the angular range required to reconstruct ROI images, the temporal resolution is improved and motion artifacts are reduced. Thus, we refer to this technique as spatially and temporally targeted reconstruction (STTaR).
Get Radiology Tree app to read full this article<
Get Radiology Tree app to read full this article<
Get Radiology Tree app to read full this article<
Materials and methods
Controlled Motion Phantom
Get Radiology Tree app to read full this article<
Get Radiology Tree app to read full this article<
Porcine Model
Get Radiology Tree app to read full this article<
Get Radiology Tree app to read full this article<
Scan Parameters
Get Radiology Tree app to read full this article<
Image Reconstruction
Get Radiology Tree app to read full this article<
Get Radiology Tree app to read full this article<
Get Radiology Tree app to read full this article<
Get Radiology Tree app to read full this article<
Get Radiology Tree app to read full this article<
Get Radiology Tree app to read full this article<
Get Radiology Tree app to read full this article<
Get Radiology Tree app to read full this article<
Results
Controlled Motion Phantom
Get Radiology Tree app to read full this article<
Get Radiology Tree app to read full this article<
Get Radiology Tree app to read full this article<
Get Radiology Tree app to read full this article<
Get Radiology Tree app to read full this article<
Get Radiology Tree app to read full this article<
Porcine Model
Get Radiology Tree app to read full this article<
Table 1
The Temporal Parameters of the Projection Data Used for the Temporally Targeted and the Standard Short Scan Reconstruction
Temporally Targeted Short Scan Angular range 180° 235° Cardiac window (% RR) 27 36 Acquisition time 200 ms 261 ms
Note that the cardiac window is heart-rate dependent (ie, if the heart rate was reduced this ratio of the data acquisition period to the time between R waves would be reduced).
Get Radiology Tree app to read full this article<
Coronary ROI
Get Radiology Tree app to read full this article<
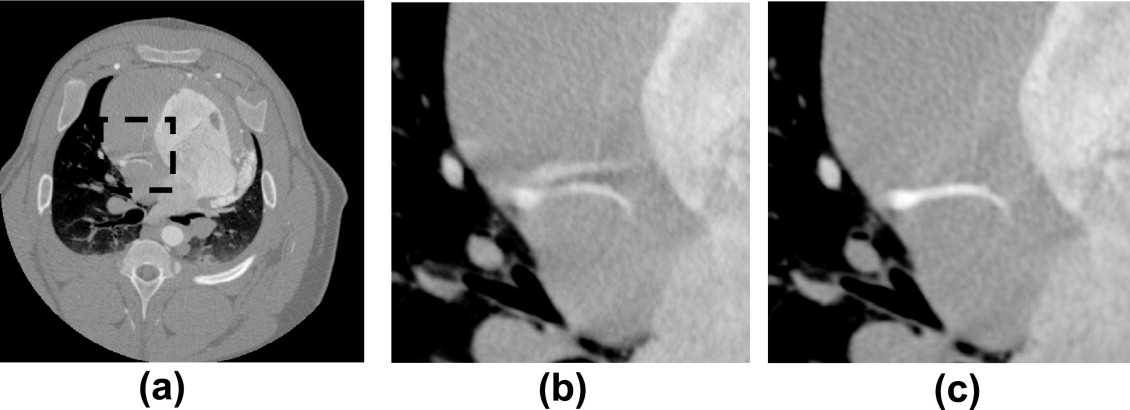
![Figure 8, Comparison of the maximum intensity projection images through the coronary region of interest (ROI) in the z (SI) direction: (a) through the full field of view (0 Hounsfield units [HU] to 900 HU), (b) through the coronary ROI (dashed line) without temporal targeting (−590 HU to 780 HU), and (c) through the coronary ROI with temporal targeting (−590 HU 780 HU). Additionally, in (a) the pulmonary ROI used is denoted by the solid line.](https://storage.googleapis.com/dl.dentistrykey.com/clinical/TemporallyTargetedImagingMethodAppliedtoECGGatedComputedTomography/7_1s20S1076633207003947.jpg)
Get Radiology Tree app to read full this article<
Pulmonary Region of Interest
Get Radiology Tree app to read full this article<
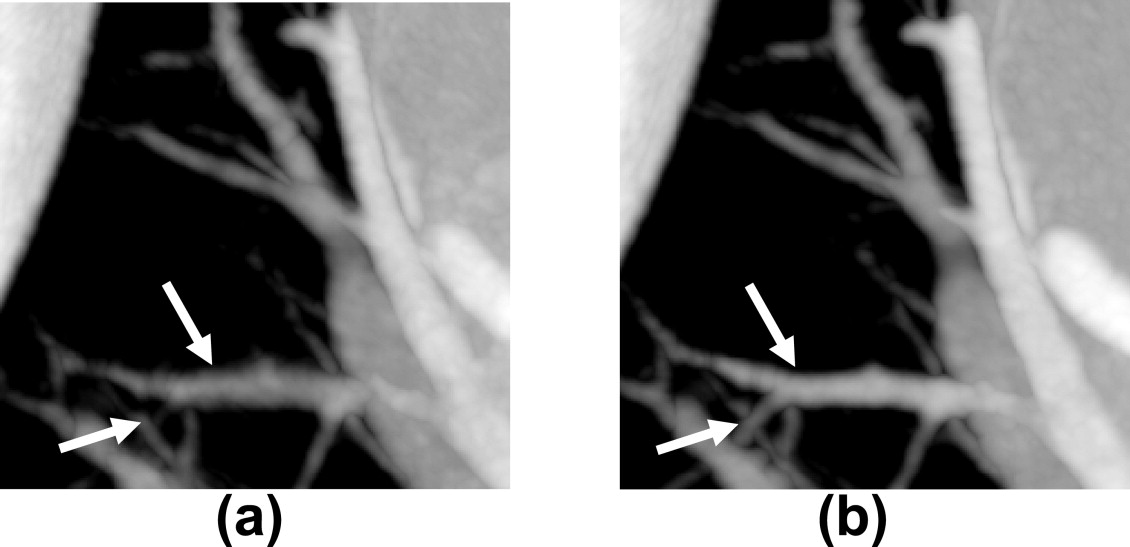
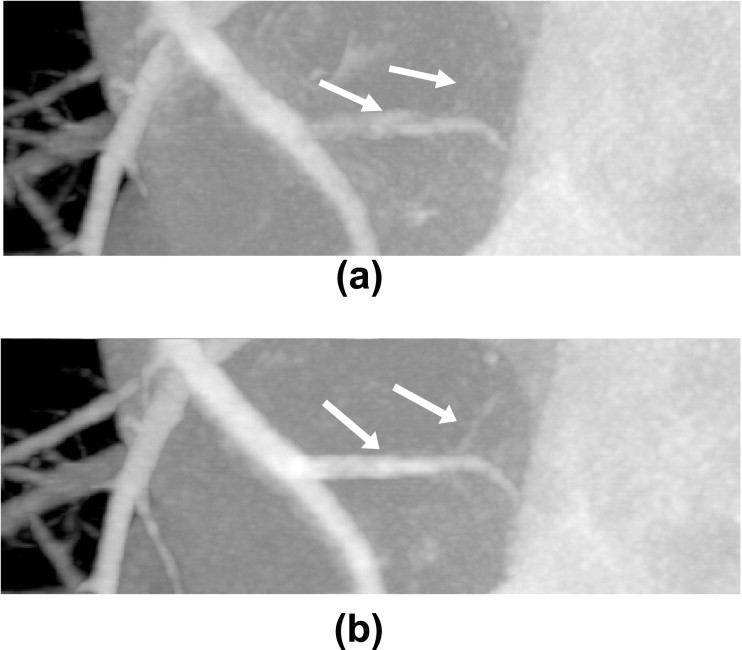
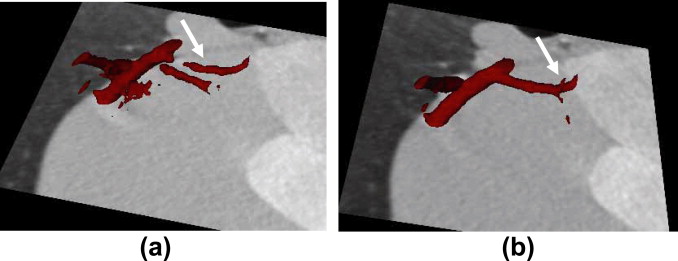
![Figure 12, Minimum intensity projections through: the entire field of view −50 Hounsfield units [HU] to 650 HU), the pulmonary region of interest without temporal targeting (−920 HU to −400 HU) and the pulmonary ROI with temporal targeting (−920 HU to −400 HU).
![−50 Hounsfield units [HU] to 650 HU), the pulmonary region of interest without temporal targeting (−920 HU to −400 HU) and the pulmonary ROI with temporal targeting (−920 HU to −400 HU).](https://storage.googleapis.com/dl.dentistrykey.com/clinical/TemporallyTargetedImagingMethodAppliedtoECGGatedComputedTomography/11_1s20S1076633207003947.jpg)
Get Radiology Tree app to read full this article<
Discussion
Get Radiology Tree app to read full this article<
Get Radiology Tree app to read full this article<
Get Radiology Tree app to read full this article<
Get Radiology Tree app to read full this article<
Get Radiology Tree app to read full this article<
Get Radiology Tree app to read full this article<
Get Radiology Tree app to read full this article<
Get Radiology Tree app to read full this article<
Get Radiology Tree app to read full this article<
Get Radiology Tree app to read full this article<
Acknowledgments
Get Radiology Tree app to read full this article<
Appendix
Get Radiology Tree app to read full this article<
Get Radiology Tree app to read full this article<
gc(γ,v,t)=DD2+v2√gm(γ,v,t) g
c
(
γ
,
v
,
t
)
=
D
D
2
+
v
2
g
m
(
γ
,
v
,
t
)
Get Radiology Tree app to read full this article<
Get Radiology Tree app to read full this article<
gd(γ,v,t)=(−∂∂y+∂∂t)gc(γ,v,t). g
d
(
γ
,
v
,
t
)
=
(
−
∂
∂
y
+
∂
∂
t
)
g
c
(
γ
,
v
,
t
)
.
Get Radiology Tree app to read full this article<
Get Radiology Tree app to read full this article<
Q(γ,v,t)=hH(sinγ)*gd(γ,v,t),where Q
(
γ
,
v
,
t
)
=
h
H
(
sin
γ
)
*
g
d
(
γ
,
v
,
t
)
,
where
hH⎛⎝⎜s⎞⎠⎟=∫−kN2kN2dkisgn(k)ei2πks. h
H
(
s
)
=
∫
−
k
N
2
k
N
2
d
k
i
sgn
(
k
)
e
i
2
π
k
s
.
Get Radiology Tree app to read full this article<
Get Radiology Tree app to read full this article<
Qw(γ,v,t)=w(γ,t)Q(γ,v,t), Q
w
(
γ
,
v
,
t
)
=
w
(
γ
,
t
)
Q
(
γ
,
v
,
t
)
,
w(γ,t)=c(t)c(t)+c(t+π+2γ), w
(
γ
,
t
)
=
c
(
t
)
c
(
t
)
+
c
(
t
+
π
+
2
γ
)
,
c(t)=cos2π(t−ti−d)2d1cos2π(t−tf+d)2difififti<t<(ti+d)(ti+d)<t<(tf−d)(tf−d)<t<tf. c
(
t
)
=
cos
2
π
(
t
−
t
i
−
d
)
2
d
i
f
t
i
<
t
<
(
t
i
+
d
)
1
i
f
(
t
i
+
d
)
<
t
<
(
t
f
−
d
)
cos
2
π
(
t
−
t
f
+
d
)
2
d
i
f
(
t
f
−
d
)
<
t
<
t
f
.
Get Radiology Tree app to read full this article<
Get Radiology Tree app to read full this article<
f(x,y,z)=12π∫titfdtQw(γ¯,v¯,t)(x−Rcost)2+(y−Rsint)2√,where f
(
x
,
y
,
z
)
=
1
2
π
∫
t
i
t
f
d
t
Q
w
(
γ
¯
,
v
¯
,
t
)
(
x
−
R
cos
t
)
2
+
(
y
−
R
sin
t
)
2
,
where
Υ¯¯¯=⎧⎩⎨⎪⎪tan−1(y−Rsintx−Rcost),x−Rcost>0tan−1(y−Rsintx−Rcost)+π,x−Rcost≤0,and ϒ
¯
=
{
tan
−
1
(
y
−
R
sin
t
x
−
R
cos
t
)
,
x
−
R
cos
t
0
tan
−
1
(
y
−
R
sin
t
x
−
R
cos
t
)
+
π
,
x
−
R
cos
t
≤
0
,
and
v¯=zD(x−Rcost)2+(y−Rsint)2√. v
¯
=
z
D
(
x
−
R
cos
t
)
2
+
(
y
−
R
sin
t
)
2
.
Get Radiology Tree app to read full this article<
Get Radiology Tree app to read full this article<
Get Radiology Tree app to read full this article<
Get Radiology Tree app to read full this article<
References
1. Hoffmann M.H., Shi H., Schmitz B.L., et. al.: Noninvasive coronary angiography with multislice computed tomography. JAMA 2005; 293: pp. 2471-2478.
2. Budoff M.J., Achenbach S., Blumenthal R.S., et. al.: Assessment of coronary artery disease by cardiac computed tomography: a scientific statement from the American Heart Association Committee on Cardiovascular Imaging and Intervention, Council on Cardiovascular Radiology and Intervention, and Committee on Cardiac Imaging, Council on Clinical Cardiology. Circulation 2006; 114: pp. 1761-1791.
3. Leschka S., Alkadhi H., Plass A., et. al.: Accuracy of MSCT coronary angiography with 64-slice technology: first experience. Eur Heart J 2005; 26: pp. 1482-1487.
4. Leschka S., Wildermuth S., Boehm T., et. al.: Noninvasive coronary angiography with 64-section CT: effect of average heart rate and heart rate variability on image quality. Radiology 2006; 241: pp. 378-385.
5. Flohr T.G., McCollough C.H., Bruder H., et. al.: First performance evaluation of a dual-source CT (DSCT) system. Eur Radiol 2006; 16: pp. 256-268.
6. Kak A.C., Slaney M.: Principles of computerized tomographic imaging.1988.IEEEBellingham, WA
7. Noo F., Defrise M., Clackdoyle R., Kudo H.: Image reconstruction from fan-beam projections on less than a short scan. Phys Med Biol 2002; 47: pp. 2525-2546.
8. Chen G.-H.: A new framework of image reconstruction from fan beam projections. Med Phys 2003; 30: pp. 1151-1161.
9. Pan X., Zou Y., Xia D.: Image reconstruction in peripheral and central regions-of-interest and data redundancy. Med Phys 2005; 32: pp. 673-684.
10. Savino G., Herzog C., Costello P., et. al.: 64 slice cardiovascular CT in the Emergency Department: concepts and first experiences. Radiol Med 2006; 111: pp. 481-496.
11. Mayer F., Nguyen S.A., Schoepf U.J., et. al.: Extra-cardiac findings at cardiac CT.RSNA Annual Meeting.2006. 207
12. Kachelrieβ M., Kalender W.A.: Electrocardiogram-correlated image reconstruction from subsection spiral computed tomography scans of the heart. Med Phys 1998; 25: pp. 2417-2431.
13. Shechter G., Resar J.R., McVeigh E.R.: Rest period duration of the coronary arteries: implications for magnetic resonance coronary angiography. Med Phys 2005; 32: pp. 255-262.
14. Mao S., Lu B., Oudiz R.J., et. al.: Coronary artery motion in electron beam tomography. J Comput Assist Tomogr 2000; 24: pp. 253-258.
15. Vembar M., Garcia M.J., Heuscher D.J., et. al.: A dynamic approach to identifying desired physiological phases for cardiac imaging using multislice spiral CT. Med Phys 2003; 30: pp. 1683-1693.
16. Parker D.L.: Optimal short-scan convolution reconstruction for fan beam CT. Med Phys 1982; 9: pp. 254-257.
17. Feldkamp L.A., Davis L.C., Kress J.W.: Practical cone-beam algorithm. J Opt Soc Am A 1984; 1: pp. 612-619.
18. Kudo H., Noo F., Defrise M., et. al.: New super-short-scan algorithm for fan-beam and cone-beam reconstruction. IEEE NS-MIC 2002; M5-3: pp. 902-906.
19. Chen G.H., Tokalkanahalli R., Zhuang T., et. al.: Development and evaluation of an exact fan-beam reconstruction algorithm using an equal weighting scheme via locally compensated filtered backprojection (LCFBP). Med Phys 2006; 33: pp. 475-481.
20. Yu H., Wang G.: Feldkamp-type VOI reconstruction from super-short-scan cone-beam data. Med Phys 2004; 31: pp. 1357-1362.
21. Nett B.E., Zhuang T.-L., Leng S., et. al.: Arc based cone-beam reconstruction algorithm using an equal weighting scheme. J X-Ray Sci Tech 2007; 15: pp. 19-48.
22. Chesler D.A., Riederer S.J., Pelc N.J.: Noise due to photon counting statistics in computed X-ray tomography. J Comput Assist Tomogr 1977; 1: pp. 64-74.
23. Brooks R.A., Di Chiro G.: Statistical limitations in x-ray reconstructive tomography. Med Phys 1976; 3: pp. 237-240.
24. Chung C.S., Karamanoglu M., Kovacs S.J.: Duration of diastole and its phases as a function of heart rate during supine bicycle exercise. Am J Physiol Heart Circ Physiol 2004; 287: pp. H2003-H2008.
25. Hofmann L.K., Zou K.H., Costello P., et. al.: Electrocardiographically gated 16-section CT of the thorax: cardiac motion suppression. Radiology 2004; 233: pp. 927-933.
26. Zou Y., Pan X.: Exact image reconstruction on PI-lines from minimum data in helical cone-beam CT. Phys Med Biol 2004; 49: pp. 941-959.
27. Zhuang T., Leng S., Nett B.E., et. al.: Fan-beam and cone-beam image reconstruction via filtering the backprojection image of differentiated projection data. Phys Med Biol 2004; 49: pp. 5489-5503.
28. Ye Y., Zhao S., Yu H., Wang G.: A general exact reconstruction for cone-beam CT via backprojection-filtration. IEEE Trans Med Imaging 2005; 24: pp. 1190-1198.
29. Pack J.D., Noo F., Clackdoyle R.: Cone-beam reconstruction using the backprojection of locally filtered projections. IEEE Trans Med Imaging 2005; 24: pp. 70-85.
30. King M., Pan X., Yu L., Giger M.: Region-of-interest reconstruction of motion-contaminated data using a weighted backprojection filtration algorithm. Med Phys 2006; 33: pp. 1222-1238.
31. Hu H.: Multi-slice helical CT: scan and reconstruction. Med Phys 1999; 26: pp. 5-18.
32. Noo F., Defrise M., Clackdoyle R.: Single-slice rebinning method for helical cone-beam CT. Phys Med Biol 1999; 44: pp. 561-570.
33. Kachelriess M., Schaller S., Kalender W.A.: Advanced single-slice rebinning in cone-beam spiral CT. Med Phys 2000; 27: pp. 754-772.
34. Taguchi K., Aradate H.: Algorithm for image reconstruction in multi-slice helical CT. Med Phys 1998; 25: pp. 550-561.
35. Wang G., Lin T.H., Cheng P.C., et. al.: A general cone-beam reconstruction algorithm. IEEE Trans Med Imaging 1993; 12: pp. 486-496.
36. Hein I., Taguchi K., Silver M.D., et. al.: Feldkamp-based cone-beam reconstruction for gantry-tilted helical multislice CT. Med Phys 2003; 30: pp. 3233-3242.
37. Tang X., Hsieh J.: A filtered backprojection algorithm for cone beam reconstruction using rotational filtering under helical source trajectory. Med Phys 2004; 31: pp. 2949-2960.
38. Hsieh J., Londt J., Vass M., et. al.: Step-and-shoot data acquisition and reconstruction for cardiac x-ray computed tomography. Med Phys 2006; 33: pp. 4236-4248.
39. Kido T., Kurata A., Higashino H., et. al.: Cardiac imaging using 256-detector row four-dimensional CT: preliminary clinical report. Radiat Med 2007; 25: pp. 38-44.