
Rationale and Objectives
The effect of smoking cessation on centrilobular emphysema (CLE) and centrilobular nodularity (CN), two manifestations of smoking-related lung injury on computed tomography (CT) images, has not been clarified. The objective of this study is to leverage texture analysis to investigate differences in extent of CLE and CN between current and former smokers.
Materials and Methods
Chest CT scans from 350 current smokers, 401 former smokers, and 25 control subjects were obtained from the multicenter COPDGene Study, a Health Insurance Portability and Accountability Act–compliant study approved by the institutional review board of each participating clinical study center. Additionally, for 215 of these subjects, a follow-up CT scan was obtained approximately 5 years later. For each CT scan, 5000 circular regions of interest (ROIs) of 35-pixel diameter were randomly selected throughout the lungs. The patterns present in each ROI were summarized by 50 computer-extracted texture features. A logistic regression classifier was leveraged to classify each ROI as normal lung, CLE, or CN, and differences in the percentages of normal lung, CLE, and CN by study group were assessed.
Results
Former smokers had significantly more CLE ( P < 0.01) but less CN ( P < 0.001) than did current smokers, even after adjustment for important covariates such as patient age, GOLD stage, smoking history, forced expiratory volume in 1 second, gas trapping, and scanner model. Among patients with longitudinal CT scans, continued smoking led to a slight increase in CLE ( P = 0.13), whereas sustained abstinence from smoking led to further reduction in CN ( P < 0.05).
Conclusions
The proposed texture-based approach quantifies the extent of CN and CLE with high precision. Differences in smoking-related lung disease between longitudinal scans of current smokers and longitudinal scans of former smokers suggest that CN may be reversible on smoking cessation.
Introduction
Chronic obstructive pulmonary disease (COPD) is the third leading cause of mortality in the United States and is projected to be the fourth leading cause of mortality worldwide by 2030 . COPD, which is strongly associated with smoking, is characterized by persistent airflow obstruction and a reduced ratio of forced expiratory volume in 1 second (FEV 1 ) to forced vital capacity. Currently, the most effective treatment for COPD is smoking cessation, which slows down the progressive decline in lung function and leads to a transient improvement in FEV 1 .
Smoking-related lung injury manifests on computed tomography (CT) images as centrilobular nodularity (CN) and centrilobular emphysema (CLE). CN, or micronodules centered in the pulmonary lobule , is generally thought to represent smoking-related respiratory bronchiolitis and is the earliest and most common manifestation of smoking-related lung inflammation , which may subsequently lead to emphysema. CLE is associated with low attenuation values similar to the density of air because of the destruction of alveolar walls in lung tissue. The severity and extent of CLE and CN in patients with COPD is commonly assessed by radiologists reading CT images. Nevertheless, qualitative assessment of CT images for extent of CLE and, more notably, CN is associated with high interobserver variability . For example, when 9–11 pulmonologists and radiologistsreviewed each of 395 CT scans at the COPDGene Study CT Imaging Workshop in 2010, average κ values for quantifying CLE and CN were 0.33 and 0.12, respectively .
Get Radiology Tree app to read full this article<
Get Radiology Tree app to read full this article<
Get Radiology Tree app to read full this article<
Materials and Methods
Subjects
Get Radiology Tree app to read full this article<
Get Radiology Tree app to read full this article<
Table 1
Description of Subjects From the COPDGene Study Cohort Used in this Study
Variable Nonsmokers Former Smokers Current Smokers Training Application Training Application Training Application ( n = 19) ( n = 25) ( n = 18) ( n = 401) ( n = 22) ( n = 350) Subject data Men/women 8/11 12/13 9/9 203/198 11/11 173/177 Age at enrollment (y) 63.1 ± 8.0 65.0 ± 9.2 62.1 ± 8.0 65.3 ± 8.0 56.9 ± 7.3 58.0 ± 8.3 Smoking history Cigarettes/day NA NA 34.3 ± 14.0 27.4 ± 12.1 17.2 ± 10.1 18.9 ± 10.6 Smoking duration (y) NA NA 34.1 ± 13.0 34.5 ± 11.4 41.1 ± 8.2 41.2 ± 8.7 Time since smoking cessation (y) NA NA 11.6 ± 10.6 13.4 ± 10.9 NA NA GOLD stage Unclassified \* NA NA — 64 — 64 0 NA NA 7 91 4 76 1 NA NA 2 96 8 90 2 NA NA 1 92 7 84 3 NA NA 4 29 3 17 4 NA NA 4 29 — 19 Scanner Siemens Definition 14 11 13 81 11 85 Siemens Definition AS+ 1 3 2 27 1 40 Siemens Definition Flash 3 11 1 38 — 28 Siemens Sensation 64 1 — 2 104 10 97 Measurements FEV 1 3.0 ± 0.7 2.9 ± 0.8 2.0 ± 1.1 2.3 ± 0.7 2.3 ± 0.8 2.2 ± 0.8 FEV 1 % predicted 106.2 ± 11.7 98.9 ± 13.4 66.0 ± 34.1 74.1 ± 23.8 76.9 ± 20.3 76.4 ± 21.7 FEV 1 /FVC 0.80 ± 0.05 0.79 ± 0.05 0.55 ± 0.21 0.63 ± 0.15 0.66 ± 0.07 0.66 ± 0.14 % Emphysema † 1.3 ± 0.9 1.7 ± 1.8 14.6 ± 14.8 9.7 ± 10.7 2.4 ± 2.8 5.0 ± 7.7 % Gas trapping ‡ 6.6 ± 4.3 7.0 ± 6.0 35.8 ± 24.9 26.2 ± 19.0 16.9 ± 12.7 18.2 ± 17.5
Data are expressed as mean ± standard deviation or as numbers.
CT, computed tomography; FEV 1 , forced expiratory volume in 1 second; FVC forced vital capacity; NA, not applicable.
Get Radiology Tree app to read full this article<
Get Radiology Tree app to read full this article<
Get Radiology Tree app to read full this article<
Get Radiology Tree app to read full this article<
Image Acquisition
Get Radiology Tree app to read full this article<
Radiologist Assessment
Get Radiology Tree app to read full this article<
Get Radiology Tree app to read full this article<
Classifier Training
Get Radiology Tree app to read full this article<
Get Radiology Tree app to read full this article<
Classifier Precision Analysis
Get Radiology Tree app to read full this article<
Get Radiology Tree app to read full this article<
Texture-based CT Analysis
Get Radiology Tree app to read full this article<
Statistical Analysis
Get Radiology Tree app to read full this article<
Results
Get Radiology Tree app to read full this article<
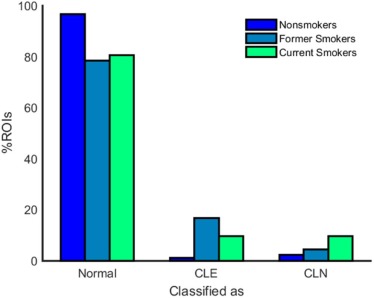
Table 2
Texture-based %CLE and %CN Are Shown for Nonsmokers, Former Smokers, and Current Smokers as Mean ± Standard Deviation
Nonsmokers Former Smokers Current Smokers_P_ (NS vs. FS)P (NS vs. CS)P (FS vs. CS) % Normal ROIs 96.6 ± 2.7 78.6 ± 23.4 80.6 ± 19.5P < 10 −4 P < 10 −5 P < 0.21 \* % CLE ROIs 1.1 ± 1.2 16.9 ± 23.5 9.6 ± 17.0P < 10 −4 P = 0.01P < 10 −6 % CN ROIs 2.3 ± 2.9 4.5 ± 8.4 9.8 ± 13.7P < 0.18 \* P < 0.01P < 10 −10
CLE, centrilobular emphysema; CN, centrilobular nodularity; CS, current smokers; FS, former smokers; NS, nonsmokers; ROIs, regions of interest.
Two-sample t tests were used to evaluate the statistical significance of differences between groups.
Get Radiology Tree app to read full this article<
Get Radiology Tree app to read full this article<
Get Radiology Tree app to read full this article<
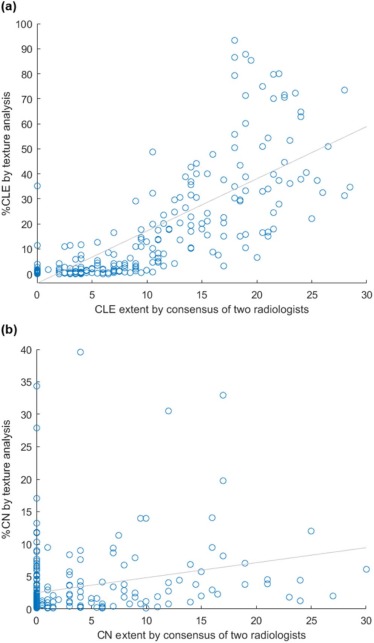
Table 3
Correlations Between %CLE and %CN and Pertinent Variables in 401 Former Smokers and 350 Current Smokers
Correlation With Variable %CLE %CN Mean of two radiologists ( n = 250) CLE extent 0.84( P < 0.01) NA CN extent NA 0.31( P < 0.01) Densitometry( n = 776) % Emphysema 0.75( P < 0.01) −0.29( P < 0.01) % Gas trapping 0.58( P < 0.01) −0.34( P < 0.01) Clinical variables( n = 776) GOLD stage 0.44( P < 0.01) −0.30( P < 0.01) FEV 1 −0.32( P < 0.01) 0.01( P = 0.73) Time since smoking cessation −0.16( P < 0.01) 0.07( P = 0.16) Smoking pack-years 0.26( P < 0.01) −0.10( P = 0.12)
CLE, centrilobular emphysema; CN, centrilobular nodularity; FEV 1 , forced expiratory volume in 1 second; NA, not applicable.
Correlation coefficients and P values were computed using Pearson correlation.
Get Radiology Tree app to read full this article<
Get Radiology Tree app to read full this article<
Table 4
For 215 Subjects With CT Scans From Both Phases 1 and 2, %CLE and %CN Are Listed as Mean ± Standard Deviation
Phase 1 Phase 2P Value Former smokers in P1 and P2 ( n = 134) % Normal ROIs 79.5 ± 22.8 76.1 ± 27.5 0.27 % CLE ROIs 15.7 ± 22.8 20.9 ± 28.3 0.10 % CN ROIs 4.9 ± 8.5 3.1 ± 5.6 0.04 Current smokers in P1 and P2 ( n = 52) % Normal ROIs 81.5 ± 18.7 77.9 ± 23.3 0.39 % CLE ROIs 8.9 ± 15.9 14.7 ± 22.5 0.13 % CN ROIs 9.7 ± 10.5 7.4 ± 11.5 0.30 Former smokers in P1, current smokers in P2 ( n = 5) % Normal ROIs 78.5 ± 22.4 59.0 ± 42.4 0.39 % CLE ROIs 10.6 ± 16.4 23.0 ± 36.5 0.51 % CN ROIs 10.9 ± 22.1 18.0 ± 37.7 0.72 Current smokers in P1, former smokers in P2 ( n = 24) % Normal ROIs 71.9 ± 25.6 62.5 ± 32.5 0.27 % CLE ROIs 19.4 ± 26.0 29.5 ± 34.4 0.26 % CN ROIs 8.7 ± 16.3 8.0 ± 18.3 0.90
CLE, centrilobular emphysema; CN, centrilobular nodularity; CT, computed tomography; P1, phase 1; P2, phase 2; ROIs, regions of interest.
Two-sample t tests were used to evaluate the statistical significance of differences between phase 1 and phase 2 measurements.
Get Radiology Tree app to read full this article<
Discussion
Get Radiology Tree app to read full this article<
Get Radiology Tree app to read full this article<
Get Radiology Tree app to read full this article<
Get Radiology Tree app to read full this article<
Get Radiology Tree app to read full this article<
Get Radiology Tree app to read full this article<
Get Radiology Tree app to read full this article<
Appendix
Get Radiology Tree app to read full this article<
Get Radiology Tree app to read full this article<
Get Radiology Tree app to read full this article<
Get Radiology Tree app to read full this article<
Appendix
Supplementary Data
Get Radiology Tree app to read full this article<
Figure S1
Get Radiology Tree app to read full this article<
Get Radiology Tree app to read full this article<
Get Radiology Tree app to read full this article<
Table S1
Get Radiology Tree app to read full this article<
Get Radiology Tree app to read full this article<
Get Radiology Tree app to read full this article<
References
1. Hoyert D.L., Xu J.Q.: Deaths: preliminary data for 2011. Natl Vital Stat Rep 2012; 61: pp. 1-65.
2. Mathers C.D., Loncar D.: Projections of global mortality and burden of disease from 2002 to 2030. PLoS Med 2006; 3: e442
3. Scanlon P.D., Connett J.E., Waller L.A., et. al.: Smoking cessation and lung function in mild-to-moderate chronic obstructive pulmonary disease. Am J Respir Crit Care Med 2000; 161: pp. 381-390.
4. Kanner R.E., Connett J.E., Williams D.E., et. al.: Effects of randomized assignment to a smoking cessation intervention and changes in smoking habits on respiratory symptoms in smokers with early chronic obstructive pulmonary disease: the Lung Health Study. Am J Med 1999; 106: pp. 410-416.
5. Dhariwal J., Tennant R.C., Hansell D.M., et. al.: Smoking cessation in COPD causes a transient improvement in spirometry and decreases micronodules on high-resolution CT imaging. Chest 2014; 145: pp. 1006-1015.
6. Hansell D.M., Bankier A.A., MacMahon H., et. al.: Fleischner Society: glossary of terms for thoracic imaging. Radiology 2008; 246: pp. 697-722.
7. Cosio M.G., Hale K.A., Niewoehner D.E.: Morphologic and morphometric effects of prolonged cigarette smoking on the small airways. Am Rev Respir Dis 1980; 122: pp. 265-271.
8. Gruden J.F., Webb W.R.: CT findings in a proved case of respiratory bronchiolitis. AJR Am J Roentgenol 1993; 161: pp. 44-46.
9. Guckel C., Hansell D.M.: Imaging the “dirty lung”—has high resolution computed tomography cleared the smoke?. Clin Radiol 1998; 53: pp. 717-722.
10. Heyneman L.E., Ward S., Lynch D.A., et. al.: Respiratory bronchiolitis, respiratory bronchiolitis-associated interstitial lung disease, and desquamative interstitial pneumonia: different entities or part of the spectrum of the same disease process?. AJR Am J Roentgenol 1999; 173: pp. 1617-1622.
11. Moon J., du Bois R.M., Colby T.V., et. al.: Clinical significance of respiratory bronchiolitis on open lung biopsy and its relationship to smoking related interstitial lung disease. Thorax 1999; 54: pp. 1009-1014.
12. Remy-Jardin M., Edme J.L., Boulenguez C., et. al.: Longitudinal follow-up study of smoker’s lung with thin-section CT in correlation with pulmonary function tests. Radiology 2002; 222: pp. 261-270.
13. Mastora I., Remy-Jardin M., Sobaszek A., et. al.: Thin-section CT finding in 250 volunteers: assessment of the relationship of CT findings with smoking history and pulmonary function test results. Radiology 2001; 218: pp. 695-702.
14. Hersh C.P., Washko G.R., Jacobson F.L., et. al.: Interobserver variability in the determination of upper lobe-predominant emphysema. Chest 2007; 131: pp. 424-431.
15. Lynch D.A., Murphy J.R., Crapo J.D., et. al.: A combined pulmonary-radiology workshop for visual evaluation of COPD: study design, chest CT findings and concordance with quantitative evaluation. COPD 2012; 9: pp. 151-159.
16. Heussel C.P., Herth F.J.F., Kappes J., et. al.: Fully automatic quantitative assessment of emphysema in computed tomography: comparison with pulmonary function testing and normal values. Eur Radiol 2009; 19: pp. 2391-2402.
17. Regan E.A., Hokanson J.E., Murphy J.R., et. al.: Genetic epidemiology of COPD (COPDGene) study design. COPD 2010; 7: pp. 32-43.
18. Nakano Y., Muro S., Sakai H., et. al.: Computed tomographic measurements of airway dimensions and emphysema in smokers. Am J Respir Crit Care Med 2000; 162: pp. 1102-1108.
19. Coxson H.O., Dirksen A., Edwards L.D., et. al.: The presence and progression of emphysema in COPD as determined by CT scanning and biomarker expression: a prospective analysis from the ECLIPSE study. Lancet Respir Med 2013; 1: pp. 129-136.
20. Xu Y., Sonka M., McLennan G., et. al.: MDCT-based 3-D texture classification of emphysema and early smoking related lung pathologies. IEEE Trans Med Imaging 2006; 25: pp. 464-475.
21. Park Y.S., Seo J.B., Kim N., et. al.: Texture-based quantification of pulmonary emphysema on high-resolution computed tomography: comparison with density-based quantification and correlation with pulmonary function tests. Invest Radiol 2008; 43: pp. 395-402.
22. Sorensen L., Shaker S.B., de Bruijne M.: Quantitative analysis of pulmonary emphysema using local binary patterns. IEEE Trans Med Imaging 2010; 29: pp. 559-569.
23. Ginsburg S.B., Lynch D.A., Bowler R.P., et. al.: Automated texture-based quantification of centrilobular nodularity and centrilobular emphysema in chest CT images. Acad Radiol 2012; 19: pp. 1241-1251.
24. Niewoehner D.E., Kleinerman J., Rice D.B.: Pathologic changes in the peripheral airways of young cigarette smokers. N Engl J Med 1974; 291: pp. 755-758.
25. McGregor A., Roberts H.C., Dong Z.: Repeated low-dose computed tomography in current and former smokers for quantification of emphysema. J Comput Assist Tomogr 2010; 34: pp. 933-938.
26. Ashraf H., Lo P., Shaker S.B., et. al.: Short-term effect of changes in smoking behavior on emphysema quantification by CT. Thorax 2011; 66: pp. 55-60.
27. Zach J.A., Newell J.D., Schroeder J., et. al.: Quantitative computed tomography of the lungs and airways in healthy nonsmoking adults. Invest Radiol 2012; 47: pp. 596-602.
28. Zach J.A., Williams A., Jou S.S., et. al.: Current smoking status is associated with lower quantitative CT measures of emphysema and gas trapping. J Thorac Imaging 2016; 31: pp. 29-36.
29. Han M.K., Kazerooni E.A., Lynch D.A., et. al.: Chronic obstructive pulmonary disease exacerbations in the COPDGene study: associated radiologic phenotypes. Radiology 2011; 261: pp. 274-282.
30. Hastie T., Tibshirani R., Friedman J.: The elements of statistical learning: data mining, inference, and prediction.2001.SpringerNew York
31. Becklake M.R., Lalloo U.: The “healthy smoker”: a phenomenon of health selection?. Respiration 1990; 57: pp. 137-144.
32. Kemerink G.J., Lamers R.J.S., Pellis B.J., et. al.: On segmentation of lung parenchyma in quantitative computed tomography of the lung. Med Phys 1997; 25: pp. 2432-2439.
33. Boedeker K.L., McNitt-Gray M.F., Rogers S.R., et. al.: Emphysema: effect of reconstruction algorithm on CT imaging measures. Radiology 2004; 232: pp. 295-301.
34. Genevois P.A., Vuyst P.D., de Maerelaer V., et. al.: Comparison of computed density and microscopic morphometry in pulmonary emphysema. Am J Respir Crit Care Med 1996; 154: pp. 187-192.
35. Coxson H.O., Rogers R.M., Whittall K.P., et. al.: A quantification of the lung surface area in emphysema using computed tomography. Am J Respir Crit Care Med 1999; 159: pp. 851-856.