
Rationale and Objectives
To elucidate the characteristics of four types of tumors, including squamous cell carcinoma (SCC), malignant lymphoma (ML), malignant salivary gland tumors (MSGTs), and pleomorphic adenoma (Pleo), in the maxillofacial region using dynamic contrast-enhanced magnetic resonance imaging (DCE-MRI) and diffusion-weighted MRI (DW-MRI)data.
Materials and Methods
A total of 59 tumors were included in this research. DCE-MRI and DW-MRI were performed. We applied the Tofts and Kermode model (TK model) for the DCE-MRI data and obtained three dependent parameters: the influx forward volume transfer constant into the extravascular extracellular space from the plasma ( K trans ), the fractional volume of extravascular extracellular space per unit volume of tissue ( v e ), and the fractional volume of plasma ( v p ).
Results
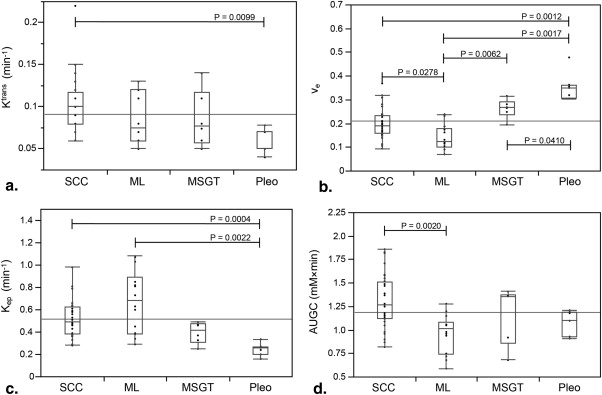
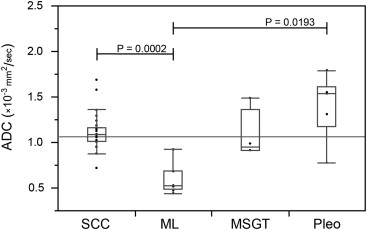
Among the K trans values, there were no significant differences between the three types of malignant tumors; however, there was a significant difference between the SCC and Pleo ( P = .0099). The v e values of the Pleo were highest, with significant differences compared to the other categories (SCC, P = .0012; ML, P = .0017; and MSGT, P = .041). The ML had the lowest v e values, and there were significant differences between ML and the other two types of malignant tumors (SCC, P = .0278 and MSGT, P = .0062). In 14 (24%) cases, apparent diffusion coefficient (ADC) could not be measured because of poor image quality. The ADC values of the ML were lowest, whereas those of Pleo were highest, similar to that observed for v e .
Conclusions
The Pleo tumors had lower K trans values and higher v e values, which are useful for differentiating them from the malignant tumors. Moreover, the v e was also useful for establishing a diagnosis of ML.
Squamous cell carcinoma (SCC), malignant lymphoma (ML), and salivary gland tumors (SGTs) are commonly found in the maxillofacial region. The treatment choice for SCC and SGT is complete surgical removal, whereas benign SGTs are sometimes treated with long-term follow-up. Meanwhile, ML is treated with chemotherapy, radiotherapy, or a combination of these modalities. Therefore, it is important to differentiate ML from other tumors as soon as possible in the early stage .
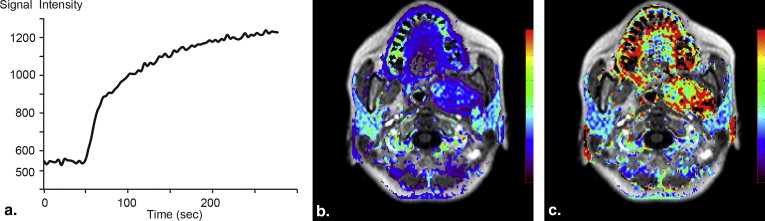
Magnetic resonance imaging (MRI) is effective for diagnosing tumors and has some advantages over traditional techniques, especially in identifying soft tissue lesions . The validity of dynamic contrast-enhanced MRI (DCE-MRI) has previously been established in SGT . The most conventional assessment with DCE-MRI involves the use of characteristics of the time-intensity curves (TICs) of regions of interest (ROIs). The simple quantification of TIC, such as the use of parameters including the time to peak enhancement ( T__p eak ) and washout ratio (WR), is commonly used . The T peak is considered to represent the microvessel count, and the threshold between benign and malignant tumors has been described in previous articles to be approximately 120 seconds . The WR represents the difference in the concentration of contrast medium (CM) between the intravascular (arterial) and extravascular (equilibrium) phases; therefore, tumors with high cellularity exhibit higher WR values. However, the WR depends on the scan parameters .
Get Radiology Tree app to read full this article<
Get Radiology Tree app to read full this article<
Get Radiology Tree app to read full this article<
Get Radiology Tree app to read full this article<
Materials and Methods
Study Population
Get Radiology Tree app to read full this article<
Get Radiology Tree app to read full this article<
Table 1
Characteristics of the Patients ( n = 55) and Lesions ( n = 59)
Sex ( n = 55) Male 26 Female 29 Primary site ( n = 59) Tongue 25 Maxilla 6 Mandible 6 Buccal mucosa 7 Oral floor 7 Submandibular gland 4 Parotid gland area 2 Parapharyngeal space 1 Neck 1 Diagnosis ( n = 59) SCC 32 ML 14 Adenoid cystic carcinoma 2 Mucoepidermoid carcinoma 4 Pleomorphic adenoma 7 SCC T stage ( n = 32) T4 15 T3 10 T2 7
ML, malignant lymphoma; SCC, squamous cell carcinoma.
Get Radiology Tree app to read full this article<
MRI Protocol
Get Radiology Tree app to read full this article<
Get Radiology Tree app to read full this article<
Get Radiology Tree app to read full this article<
Get Radiology Tree app to read full this article<
Get Radiology Tree app to read full this article<
Tofts and Kermode Model Analysis
Get Radiology Tree app to read full this article<
Get Radiology Tree app to read full this article<
Ct(t)=Ktrans∫t0Cp(t′)exp{−Ktrans(t−t′)ve}ⅆt′+vpCp(t), C
t
(
t
)
=
K
trans
∫
0
t
C
p
(
t
′
)
exp
{
−
K
trans
(
t
−
t
′
)
v
e
}
ⅆ
t
′
+
v
p
C
p
(
t
)
,
where t is the time, t ′ is the time as an integration variable, C__t ( t ) is the concentration of CM in the tissue, C p ( t ) is the concentration of CM in the plasma, K trans is the influx forward volume transfer constant (into the EES from the plasma), v e is the fractional volume of EES per unit volume of tissue, and v p is the fractional volume of plasma per unit volume of tissue.
Get Radiology Tree app to read full this article<
Get Radiology Tree app to read full this article<
Δ(1T1)=r1⋅Ct(t). Δ
(
1
T
1
)
=
r
1
⋅
C
t
(
t
)
.
Get Radiology Tree app to read full this article<
Get Radiology Tree app to read full this article<
Get Radiology Tree app to read full this article<
Get Radiology Tree app to read full this article<
Get Radiology Tree app to read full this article<
ADC Analysis
Get Radiology Tree app to read full this article<
Statistical Analysis
Get Radiology Tree app to read full this article<
Results
TK Model Analysis
Get Radiology Tree app to read full this article<
Table 2
Results of the TK Model Analysis
Diagnosis_K_ trans v e v p K ep AUGC Mean ± SD Mean ± SD Mean ± SD Mean ± SD Mean ± SD Pleo 0.064 ± 0.014 0.354 ± 0.060 0.013 ± 0.016 0.246 ± 0.055 1.089 ± 0.123 Malignant tumor 0.095 ± 0.032 0.194 ± 0.067 0.030 ± 0.019 0.552 ± 0.217 1.201 ± 0.301P value .0089 <.0001 .0193 <.0001 .308
AUGC, area under the gadolinium concentration curve; EES, extravascular extracellular space; ML, malignant lymphoma; MSGT, malignant salivary gland tumor; Pleo, pleomorphic adenoma; SCC, squamous cell carcinoma.
K trans , influx forward volume transfer constant in the EES from the plasma; K ep , efflux rate constant from the EES to the plasma; v e , fractional volume of the EES per unit volume of tissue; v p , fractional volume of plasma per unit volume of tissue.
The Wilcoxon signed rank test was performed to compare the parameters of the Pleo lesions to those of malignant tumors.
Table 3
Results of the TK Model Analysis
Diagnosis_K_ trans v e v p K ep AUGC Mean ± SD Mean ± SD Mean ± SD Mean ± SD Mean ± SD SCC 0.100 ± 0.032 a 0.199 ± 0.062 a 0.032 ± 0.019 a 0.527 ± 0.176 a 1.309 ± 0.280 a ML 0.086 ± 0.030 a,b 0.143 ± 0.052 b 0.026 ± 0.012 a 0.676 ± 0.278 a 0.962 ± 0.206 b MSGT 0.086 ± 0.034 a,b 0.263 ± 0.040 a 0.030 ± 0.031 a 0.395 ± 0.095 a,b 1.183 ± 0.307 a,b Pleo 0.064 ± 0.014 b 0.354 ± 0.060 c 0.013 ± 0.016 a 0.246 ± 0.055 b 1.089 ± 0.123 a,b
AUGC, area under the gadolinium concentration curve; EES, extravascular extracellular space; ML, malignant lymphoma; MSGT, malignant salivary gland tumor; Pleo, pleomorphic adenoma; SCC, squamous cell carcinoma.
K trans , influx forward volume transfer constant in the EES from the plasma; K ep , efflux rate constant from the EES to the plasma; v e , fractional volume of the EES per unit volume of tissue; v p , fractional volume of plasma per unit volume of tissue.
The Steel-Dwass test was performed to evaluate the parameters with significant differences ( P < .05) among the four categories. The pairs without the same subscripts indicate significant differences.
Get Radiology Tree app to read full this article<
Get Radiology Tree app to read full this article<
Get Radiology Tree app to read full this article<
Get Radiology Tree app to read full this article<
Get Radiology Tree app to read full this article<
ADC Analysis
Get Radiology Tree app to read full this article<
Get Radiology Tree app to read full this article<
Discussion
Get Radiology Tree app to read full this article<
Get Radiology Tree app to read full this article<
Get Radiology Tree app to read full this article<
Get Radiology Tree app to read full this article<
Get Radiology Tree app to read full this article<
Conclusions
Get Radiology Tree app to read full this article<
Acknowledgments
Get Radiology Tree app to read full this article<
References
1. Barnes L., International Agency for Research, on Cancer: Pathology and genetics of head and neck tumours.2005.IARC PressLyon
2. Hermans R., Reiser M.F.: Head and neck cancer imaging.2nd ed.2012.Springer Berlin Heidelberg
3. Asaumi J., Yanagi Y., Hisatomi M., et. al.: The value of dynamic contrast-enhanced MRI in diagnosis of malignant lymphoma of the head and neck. Eur J Radiol 2003; 48: pp. 183-187.
4. Asaumi J., Yanagi Y., Konouchi H., et. al.: Application of dynamic contrast-enhanced MRI to differentiate malignant lymphoma from squamous cell carcinoma in the head and neck. Oral Oncol 2004; 40: pp. 579-584.
5. Yabuuchi H., Fukuya T., Tajima T., et. al.: Salivary gland tumors: diagnostic value of gadolinium-enhanced dynamic MR imaging with histopathologic correlation. Radiology 2003; 226: pp. 345-354.
6. Hisatomi M., Asaumi J., Yanagi Y., et. al.: Assessment of pleomorphic adenomas using MRI and dynamic contrast enhanced MRI. Oral Oncol 2003; 39: pp. 574-579.
7. Hisatomi M., Asaumi J., Yanagi Y., et. al.: Diagnostic value of dynamic contrast-enhanced MRI in the salivary gland tumors. Oral Oncol 2007; 43: pp. 940-947.
8. Eida S., Ohki M., Sumi M., et. al.: MR factor analysis: improved technology for the assessment of 2D dynamic structures of benign and malignant salivary gland tumors. J Magn Reson Imaging 2008; 27: pp. 1256-1262.
9. Eida S., Sumi M., Nakamura T.: Multiparametric magnetic resonance imaging for the differentiation between benign and malignant salivary gland tumors. J Magn Reson Imaging 2010; 31: pp. 673-679.
10. Matsuzaki H., Yanagi Y., Hara M., et. al.: Minor salivary gland tumors in the oral cavity: diagnostic value of dynamic contrast-enhanced MRI. Eur J Radiol 2012; 81: pp. 2684-2691.
11. Harrer J.U., Parker G.J., Haroon H.A., et. al.: Comparative study of methods for determining vascular permeability and blood volume in human gliomas. J Magn Reson Imaging 2004; 20: pp. 748-757.
12. Oto A., Yang C., Kayhan A., et. al.: Diffusion-weighted and dynamic contrast-enhanced MRI of prostate cancer: correlation of quantitative MR parameters with Gleason score and tumor angiogenesis. AJR Am J Roentgenol 2011; 197: pp. 1382-1390.
13. Li X., Arlinghaus L.R., Ayers G.D., et. al.: DCE-MRI analysis methods for predicting the response of breast cancer to neoadjuvant chemotherapy: pilot study findings. Magn Reson Med 2014; 71: pp. 1592-1602.
14. Lee F.K., King A.D., Ma B.B., et. al.: Dynamic contrast enhancement magnetic resonance imaging (DCE-MRI) for differential diagnosis in head and neck cancers. Eur J Radiol 2012; 81: pp. 784-788.
15. Van Cann E.M., Rijpkema M., Heerschap A., et. al.: Quantitative dynamic contrast-enhanced MRI for the assessment of mandibular invasion by squamous cell carcinoma. Oral Oncol 2008; 44: pp. 1147-1154.
16. Jansen J.F., Koutcher J.A., Shukla-Dave A.: Non-invasive imaging of angiogenesis in head and neck squamous cell carcinoma. Angiogenesis 2010; 13: pp. 149-160.
17. Jansen J.F., Carlson D.L., Lu Y., et. al.: Correlation of a priori DCE-MRI and (1)H-MRS data with molecular markers in neck nodal metastases: initial analysis. Oral Oncol 2012; 48: pp. 717-722.
18. Chikui T., Kawano S., Kawazu T., et. al.: Prediction and monitoring of the response to chemoradiotherapy in oral squamous cell carcinomas using a pharmacokinetic analysis based on the dynamic contrast-enhanced MR imaging findings. Eur Radiol 2011; 21: pp. 1699-1708.
19. Chikui T., Kitamoto E., Kawano S., et. al.: Pharmacokinetic analysis based on dynamic contrast-enhanced MRI for evaluating tumor response to preoperative therapy for oral cancer. J Magn Reson Imaging 2012; 36: pp. 589-597.
20. Chikui T., Obara M., Simonetti A.W., et. al.: The principal of dynamic contrast enhanced MRI, the method of pharmacokinetic analysis, and its application in the head and neck region. Int J Dent 2012; 2012: pp. 480659.
21. Thoeny H.C., De Keyzer F., King A.D.: Diffusion-weighted MR imaging in the head and neck. Radiology 2012; 263: pp. 19-32.
22. Yabuuchi H., Matsuo Y., Kamitani T., et. al.: Parotid gland tumors: can addition of diffusion-weighted MR imaging to dynamic contrast-enhanced MR imaging improve diagnostic accuracy in characterization?. Radiology 2008; 249: pp. 909-916.
23. Habermann C.R., Arndt C., Graessner J., et. al.: Diffusion-weighted echo-planar MR imaging of primary parotid gland tumors: is a prediction of different histologic subtypes possible?. AJNR Am J Neuroradiol 2009; 30: pp. 591-596.
24. Tofts P.S.: Modeling tracer kinetics in dynamic Gd-DTPA MR imaging. J Magn Reson Imaging 1997; 7: pp. 91-101.
25. Tofts P.S., Brix G., Buckley D.L., et. al.: Estimating kinetic parameters from dynamic contrast-enhanced T(1)-weighted MRI of a diffusable tracer: standardized quantities and symbols. J Magn Reson Imaging 1999; 10: pp. 223-232.
26. Wang H.Z., Riederer S.J., Lee J.N.: Optimizing the precision in T1 relaxation estimation using limited flip angles. Magn Reson Med 1987; 5: pp. 399-416.
27. Murase K.: Efficient method for calculating kinetic parameters using T1-weighted dynamic contrast-enhanced magnetic resonance imaging. Magn Reson Med 2004; 51: pp. 858-862.
28. Tofts P.S., Berkowitz B., Schnall M.D.: Quantitative analysis of dynamic Gd-DTPA enhancement in breast tumors using a permeability model. Magn Reson Med 1995; 33: pp. 564-568.
29. Parker G.J., Suckling J., Tanner S.F., et. al.: Probing tumor microvascularity by measurement, analysis and display of contrast agent uptake kinetics. J Magn Reson Imaging 1997; 7: pp. 564-574.
30. Parker G.J., Roberts C., Macdonald A., et. al.: Experimentally-derived functional form for a population-averaged high-temporal-resolution arterial input function for dynamic contrast-enhanced MRI. Magn Reson Med 2006; 56: pp. 993-1000.