
Rationale and Objectives
Evidence on breast infrared (IR) imaging and its association with estrogen receptor (ER), progesterone receptor (PR), human epidermal growth factor receptor 2 (HER2) statuses of breast cancers is limited. The aim of this study was to investigate the association of IR imaging findings and ER, PR, and HER2 status in breast cancers.
Materials and Methods
A total of 163 women with 171 pathologically proven breast cancers underwent IR imaging of the breast before surgery. Five IR signs were used to score the lesions: IR1, the temperature difference (Δ T ) of the lesion site from that of the contralateral mirror image site; IR2, Δ T of the lesion site from that of the adjacent normal breast tissue in the same breast; IR3, abnormal vascular morphologic patterns; IR4, focal bulge or edge sign with back heat at the lesion site; and IR5, asymmetric thermographic pattern between the lesion site and the contralateral breast. The association of different IR signs with ER, PR, and HER2 status was evaluated using Fisher’s exact test.
Results
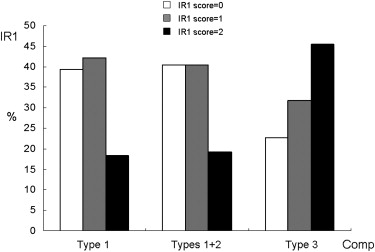
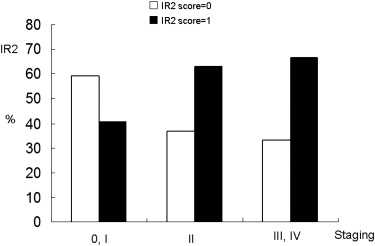
IR1 was inversely associated with ER ( P = .010) and PR status ( P = .039). IR2 was inversely related to PR status ( P = .020). IR5 was inversely associated with ER ( P = .037) and PR ( P = .022) status. No IR sign was associated with HER2 status. Triple-negative (ER-negative, PR-negative, and HER2-negative) cancers tended to show higher IR1 scores compared to other types of cancers ( P = .029).
Conclusion
Breast IR findings were associated with ER and PR status of breast cancers. Triple-negative cancers more frequently featured higher IR1 scores than other types of cancers.
Determination of the hormone receptor (HR) (estrogen receptor [ER] and progesterone receptor [PR]) and human epidermal growth factor receptor 2 (HER2) status of primary breast cancers has been shown to be important in treatment planning and the prediction of clinical prognosis for breast cancer patients . Studies have been undertaken to evaluate the associations of ER, PR, and HER2 status and those of imaging modalities, including mammography, magnetic resonance imaging (MRI) and 18 F-fluorodeoxyglucose positron emission tomography, to investigate the possible roles of diagnostic imaging findings as predictors of clinical outcomes of breast cancers . However, the association of infrared (IR) imaging of the breast with ER, PR, and HER2 status of breast cancers has rarely been studied. IR imaging of the breast, or breast thermography, is an examination that measures the surface temperature of the breast via IR radiation emitted by breast tissue . IR imaging can be used for breast cancer detection, because the surface temperature at the breast cancer site is higher than that of other breast tissue because of the increased blood flow of the malignancy . The diagnostic accuracy of IR imaging to detect breast malignancies varies among different series, with reported sensitivity ranging from 75% to 97% and specificity from 12% to 81%, according to the study design and target population . The prognostic implications of IR imaging for breast cancer remain controversial, although it has been reported that an abnormal IR finding indicates a worse prognosis, possibly because of increased metabolic rate, faster tumor growth, and tumor hypervascularity . Head et al reported that no definite association of IR findings with ER and PR status was found. However, the authors did not include HER2 status in their analysis. Our study was conducted to explore the association of IR manifestations of the breast with the ER, PR, and HER2 status of breast cancers.
Materials and methods
Patients
From March 2005 to June 2007, a total of 171 pathologically proven breast cancers in 163 patients (age range, 27–81 years; mean age, 54.2 ± 10.9 years) with immunohistochemical results available were included in this study. The patients were enrolled for suspicious findings on mammography or breast ultrasound and underwent IR imaging of the breast 1 day before surgery. Patients who received fine needle aspiration of the breast within 2 days or core biopsy within 2 weeks or who had undergone partial or total mastectomy were excluded from this study. The study participants were from a subgroup of patients in our previous study, which investigated the diagnostic performance of IR imaging of the breast (298 lesions from 276 women) . This study was approved by the institutional review board of the research ethics committee of our hospital, and all participants provided written informed consent before the IR examination of the breast.
IR Procedures, Processing, and Interpretation
Get Radiology Tree app to read full this article<
Get Radiology Tree app to read full this article<
Table 1
IR Imaging Signs Used in the Present Study
Sign Description IR1 Δ T (° C ), difference in temperature of the lesion site with that of the contralateral mirror image site IR1 = 0 when Δ T ≤ 1°C; IR1 = 1 when 1°C < Δ T ≤ 2°C; IR1 = 2 when Δ T > 2°C IR2 Δ T (° C), difference in temperature of the lesion site with that of the adjacent normal breast tissue at the same side IR2 = 0 when Δ T ≤ 1°C; IR2 = 1 when Δ T > 1°C IR3 Abnormal vascular morphologic pattern, including dilated, tortuous, aberrant vasculature at and around the lesion site IR3 = 0 when the sign is absent; IR3 = 1 when the sign is present IR4 Focal edge or bulge of the surface contour with back heat at and around the lesion site IR4 = 0 when the sign is absent; IR4 = 1 when the sign is present IR5 Asymmetrically elevated surface temperature and vascular pattern at the lesion site IR5 = 0 when the sign is absent; IR5 = 1 when the sign is present
IR, infrared.
IR signs were modified from those reported by Wang et al and also from other reported series .
Get Radiology Tree app to read full this article<
Analysis of Clinical and Histopathologic Results
Get Radiology Tree app to read full this article<
Get Radiology Tree app to read full this article<
Get Radiology Tree app to read full this article<
Get Radiology Tree app to read full this article<
Statistical Analysis
Get Radiology Tree app to read full this article<
Results
Get Radiology Tree app to read full this article<
Table 2
Lesion Characteristics
ER PR HER2 Composite Type ∗ Variable Positive ( n = 122) Negative ( n = 49) Positive ( n = 90) Negative ( n = 80) Positive ( n = 37) Negative ( n = 131) 1 ( n = 109) 2 ( n = 37) 3 ( n = 22) Age (y) 54.0 ± 11.5 55.2 ± 9.4 53.3 ± 10.9 55.6 ± 10.9 52.5 ± 8.7 54.9 ± 11.5 54.4 ± 11.9 52.5 ± 8.7 57.2 ± 9.2 Lesion size (cm) 2.7 ± 1.7 3.3 ± 2.5 2.6 ± 1.6 3.2 ± 2.3 3.2 ± 2.3 2.9 ± 1.9 2.8 ± 1.7 3.2 ± 2.3 3.4 ± 2.7 Conventional imaging † 1 15 (14.1%) 8 (18.2%) 9 (11.4%) 13 (18.6%) 6 (18.2%) 14 (12.3%) 11 (11.7%) 6 (18.2%) 3 (15.0%) 2 27 (25.5%) 15 (34.1%) 20 (25.3%) 22 (31.4%) 13 (39.4%) 29 (25.4%) 22 (23.4%) 13 (39.4%) 7 (35.0%) 3 64 (60.4%) 21 (47.7%) 50 (63.3%) 35 (50.0%) 14 (42.4%) 71 (62.3%) 61 (64.9%) 14 (42.4%) 10 (50.0%) Staging 0, I 48 (39.3%) 21 (42.9%) 38 (42.2%) 30 (37.5%) 16 (43.3%) 50 (38.2%) 44 (40.4%) 16 (43.3%) 6 (27.3%) II 40 (32.8%) 17 (34.7%) 33 (36.7%) 24 (30.0%) 12 (32.4%) 45 (34.3%) 36 (33.0%) 12 (32.4%) 9 (40.9%) III, IV 34 (27.9%) 11 (22.4%) 19 (21.1%) 26 (32.5%) 9 (24.3%) 36 (27.5%) 29 (26.6%) 9 (24.3%) 7 (31.8%)
ER, estrogen receptor; HER2, human epidermal growth factor receptor 2; HR, hormone receptor; PR, progesterone receptor.
Data are expressed as mean ± standard deviation or as number (percentage). Age and lesion size between ER-positive and ER-negative, PR-positive and PR-negative, and HER2-positive and HER2-negative lesions were evaluated using Student’s t test and among composite types by analysis of variance. The associations of conventional imaging, staging, and ER, PR, HER2, and composite type results were evaluated using Fisher’s exact test. All results were nonsignificant ( P > .05).
Get Radiology Tree app to read full this article<
Get Radiology Tree app to read full this article<
Get Radiology Tree app to read full this article<
Get Radiology Tree app to read full this article<
Table 3
Associations of IR Findings with ER, PR, and HER2 Status and Three Composite Types
ER PR HER2 Composite Type ∗ IR Finding Positive ( n = 122) Negative ( n = 49)P Positive ( n = 90) Negative ( n = 80)P Positive ( n = 37) Negative ( n = 131)P 1 ( n = 109) 2 ( n = 37) 3 ( n = 22)P IR1 score 0 51 (41.8%) 15 (30.6%) .010 40 (44.4%) 25 (31.2%) .039 16 (43.3%) 48 (36.6%) .79 43 (39.4%) 16 (43.3%) 5 (22.7%) .11 1 51 (41.8%) 15 (30.6%) 36 (40.0%) 30 (37.5%) 13 (35.1%) 53 (40.5%) 46 (42.2%) 13 (35.1%) 7 (31.8%) 2 20 (16.4%) 19 (38.8%) 14 (15.6%) 25 (31.2%) 8 (21.6%) 30 (22.9%) 20 (18.4%) 8 (21.6%) 10 (45.5%) IR2 score 0 56 (45.9%) 21 (42.9%) .74 48 (53.3%) 28 (35.0%) .020 19 (51.4%) 56 (42.7%) .36 48 (44.0%) 19 (51.4%) 8 (36.4%) .52 1 66 (54.1%) 28 (57.1%) 42 (46.7%) 52 (65.0%) 18 (48.6%) 75 (57.3%) 61 (56.0%) 18 (48.6%) 14 (63.6%) IR3 score 0 13 (10.7%) 5 (10.2%) 1.0 10 (11.1%) 7 (8.8%) .80 5 (13.5%) 11 (8.4%) .35 9 (8.3%) 5 (13.5%) 2 (9.1%) .58 1 109 (89.3%) 44 (89.8%) 80 (88.9%) 73 (91.2%) 32 (86.5%) 120 (91.6%) 100 (91.7%) 32 (86.5%) 20 (90.9%) IR4 score 0 99 (81.1%) 38 (77.6%) .67 72 (80.0%) 64 (80.0%) 1.0 30 (81.1%) 104 (79.4%) 1.0 88 (80.7%) 30 (81.1%) 16 (72.7%) .66 1 23 (18.9%) 11 (22.4%) 18 (20.0%) 16 (20.0%) 7 (18.9%) 27 (20.6%) 21 (19.3%) 7 (18.9%) 6 (27.3%) IR5 score 0 31 (25.4%) 5 (10.2%) .037 25 (27.8%) 10 (12.5%) .022 4 (10.8%) 30 (22.9%) .16 27 (24.8%) 4 (10.8%) 3 (13.6%) .17 1 91 (74.6%) 44 (89.8%) 65 (72.2%) 70 (87.5%) 33 (89.2%) 101 (77.1%) 82 (75.2%) 33 (89.2%) 19 (86.4%)
ER, estrogen receptor; HER2, human epidermal growth factor receptor 2; HR, hormone receptor; IR, infrared; PR, progesterone receptor.
The IR interpretation system is illustrated in Table 1 . All P values were evaluated using Fisher’s exact test.
Get Radiology Tree app to read full this article<
Get Radiology Tree app to read full this article<
Get Radiology Tree app to read full this article<
Get Radiology Tree app to read full this article<
Get Radiology Tree app to read full this article<
Table 4
Histologic Grade and ER, PR, and HER2 Status and Composite Types of Invasive Breast Carcinomas
Grade Variable I ( n = 18) II ( n = 72) III ( n = 38)P Age (y) 57.3 ± 12.5 52.7 ± 10.8 54.4 ± 9.5 .25 Lesion size (cm) 2.6 ± 1.6 2.6 ± 1.8 3.1 ± 2.1 .39 Conventional imaging ( n = 112) ∗ 1 2 (12.5%) 4 (6.4%) 3 (8.8%) .32 2 2 (12.5%) 23 (37.1%) 9 (26.5%) 3 12 (75.0%) 35 (56.5%) 22 (64.7%) ER Positive ( n = 91) 18 (100%) 61 (84.7%) 12 (31.6%) <.001 Negative ( n = 37) 0 (0.0%) 11 (15.3%) 26 (68.4%) PR Positive ( n = 68) 14 (77.8%) 44 (61.1%) 10 (26.3%) <.001 Negative ( n = 60) 4 (22.2%) 28 (38.9%) 28 (73.7%) HER2 Positive ( n = 27) 0 (0.0%) 15 (20.8%) 12 (31.6%) .014 Negative ( n = 101) 18 (100%) 57 (79.2%) 26 (68.4%) Composite type † 1 ( n = 80) 18 (100%) 52 (72.2%) 10 (26.3%) <.001 2 ( n = 27) 0 (0.0%) 15 (20.8%) 12 (31.6%) 3 ( n = 21) 0 (0.0%) 5 (7.0%) 16 (42.1%)
ER, estrogen receptor; HER2, human epidermal growth factor receptor 2; HR, hormone receptor. PR, progesterone receptor.
Data are expressed as mean ± standard deviation or as number (percentage). Histological grades were available in 128 invasive ductal carcinomas, and 112 had conventional imaging (mammography or ultrasound) available for correlation. P values were evaluated using analysis of variance for age and lesion size and using Fisher’s exact test for conventional imaging, ER, PR, and HER2 status, and composite types.
Get Radiology Tree app to read full this article<
Get Radiology Tree app to read full this article<
Table 5
IR Findings and Histologic Grades of Invasive Breast Carcinomas
Grade IR Finding I ( n = 18) II ( n = 72) III ( n = 38)P ∗ IR1 score .037 0 8 (44.5%) 31 (43.1%) 9 (23.7%) 1 6 (33.3%) 32 (44.4%) 15 (39.5%) 2 4 (22.2%) 9 (12.5%) 14 (36.8%) IR2 score .34 0 8 (44.4%) 33 (45.8%) 12 (31.6%) 1 10 (55.6%) 39 (54.2%) 26 (68.4%) IR3 score .53 0 3 (16.7%) 6 (8.3%) 3 (7.9%) 1 15 (83.3%) 66 (91.7%) 35 (92.1%) IR4 score .95 0 15 (83.3%) 59 (81.9%) 30 (78.9%) 1 3 (16.7%) 13 (18.1%) 8 (21.1%) IR5 score .63 0 4 (22.2%) 15 (20.8%) 5 (13.2%) 1 14 (77.8%) 57 (79.2%) 33 (86.8%)
IR, infrared.
The IR interpretation system is illustrated in Table 1 . Histologic grades were available for 128 invasive ductal carcinomas.
Get Radiology Tree app to read full this article<
Get Radiology Tree app to read full this article<
Discussion
Get Radiology Tree app to read full this article<
Get Radiology Tree app to read full this article<
Get Radiology Tree app to read full this article<
Get Radiology Tree app to read full this article<
Get Radiology Tree app to read full this article<
Get Radiology Tree app to read full this article<
Get Radiology Tree app to read full this article<
Get Radiology Tree app to read full this article<
Conclusions
Get Radiology Tree app to read full this article<
Get Radiology Tree app to read full this article<
References
1. Uematsu T., Kasami M., Yuen S.: Triple-negative breast cancer: correlation between MR imaging and pathologic findings. Radiology 2009; 250: pp. 638-647.
2. Wang Y., Ikeda D.M., Narasimhan B., et. al.: Estrogen receptor-negative invasive breast cancer: imaging features of tumors with and without human epidermal growth factor receptor type 2 overexpression. Radiology 2008; 246: pp. 367-375.
3. Makkat S., Luypaert R., Stadnik T., et. al.: Deconvolution-based dynamic contrast-enhanced MR imaging of breast tumors: correlation of tumor blood flow with human epidermal growth factor receptor 2 status and clinicopathologic findings-preliminary results. Radiology 2008; 249: pp. 471-482.
4. Karamouzis M.V., Konstantinopoulos P.A., Papavassiliou A.G.: ErbB/HER receptor family in breast cancer-the more we search the more we learn. Ann Oncol 2008; 19: pp. 1020-1021.
5. Chen J.H., Nalcioglu O., Su M.Y.: MR imaging features of invasive breast cancer correlated with hormonal receptors: does progesterone receptor matter?. Ann Oncol 2008; 19: pp. 1024-1026.
6. Katrina R.B., Monica B., Rosemary D.C., et. al.: Descriptive analysis of estrogen receptor (ER)-negative, progesterone receptor (PR)-negative, and HER2-negative invasive breast cancer, the so-called triple-negative phenotype. Cancer 2007; 109: pp. 1721-1728.
7. Konecny G.E., Meng Y.G., Untch M., et. al.: Association between HER-2/neu and vascular endothelial growth factor expression predicts clinical outcome in primary breast cancer patients. Clin Cancer Res 2004; 10: pp. 1706-1716.
8. Blackwell K.L., Dewhirst M.W., Liotcheva V., et. al.: HER-2 Gene amplification correlates with higher levels of angiogenesis and lower levels of hypoxia in primary breast tumors. Clin Cancer Res 2004; 10: pp. 4083-4088.
9. Konecny G., Pauletti G., Pegram M., et. al.: Quantitative association between HER-2/neu and steroid hormone receptors in hormone receptor-positive primary breast cancer. J Natl Cancer Inst 2003; 95: pp. 142-153.
10. Kumar R., Yarmand-Bagheri R.: The role of HER2 in angiogenesis. Semin Oncol 2001; 28: pp. 27-32.
11. Mavi A., Cermik T.F., Urhan M., et. al.: The effects of estrogen, progesterone, and C-erbB-2 receptor states on 18F-FDG uptake of primary breast cancer lesions. J Nucl Med 2007; 48: pp. 1266-1272.
12. Bo Kyoung S., Etta D.P., Cherie M.K., et. al.: Correlation of HER-2/neu overexpression with mammography and age distribution in primary breast carcinomas. Acad Radiol 2006; 13: pp. 1211-1218.
13. Ng E.Y., Ung L.N., Ng F.C., et. al.: Statistical analysis of healthy and malignant breast thermography. J Med Eng Technol 2001; 25: pp. 253-263.
14. Foster K.R.: Thermographic detection of breast cancer. IEEE Eng Med Biol Mag 1998; 17: pp. 10-14.
15. Hobbins W.B.: Thermography of the breast—a skin organ.Gautherie M.Albert E.Keith L.Thermal assessment of breast health.1983.MTP PressLancaster, United Kingdom:pp. 37-48.
16. Wang J., Chang K.J., Chen C.Y., et. al.: Evaluation of the diagnostic performance of infrared imaging of the breast: a preliminary study. Biomed Eng Online 2010; 9: pp. 3.
17. Parisky Y.R., Sardi A., Hamm R., et. al.: Efficacy of computerized infrared imaging analysis to evaluate mammographically suspicious lesions. AJR Am J Roentgenol 2003; 180: pp. 263-269.
18. Ng E.Y., Fok S.C., Peh Y.C., et. al.: Computerized detection of breast cancer with artificial intelligence and thermograms. J Med Eng Technol 2002; 26: pp. 152-157.
19. Head J.F., Wang F., Lipari C.A., et. al.: The important role of infrared imaging in breast cancer. IEEE Eng Med Biol Mag 2000; 19: pp. 52-57.
20. Ng E.Y.K., Kee E.C.: Advanced integrated technique in breast cancer thermography. J Med Eng Technol 2008; 32: pp. 103-114.
21. Arora N., Martins D., Ruggerio D., et. al.: Effectiveness of a noninvasive digital infrared thermal imaging system in the detection of breast cancer. Am J Surg 2008; 196: pp. 523-526.
22. Keyserlingk J.R., Ahlgren P.D., Yu E., et. al.: Infrared imaging of the breast: initial reappraisal using high-resolution digital technology in 100 successive cases of stage I and II breast cancer. Breast J 1998; 4: pp. 245-251.
23. Ohsumi S., Takashima S., Aogi K., et. al.: Prognostic value of thermographical findings in patients with primary breast cancer. Breast Cancer Res Treat 2002; 74: pp. 213-220.
24. Head J.F., Wang F., Elliott R.L.: Breast thermography is a noninvasive prognostic procedure that predicts tumor growth rate in breast cancer patients. Ann N Y Acad Sci 1993; 698: pp. 153-158.
25. Isard H.J., Sweitzer C.J., Edelstein G.R.: Breast thermography. A prognostic indicator for breast cancer survival. Cancer 1988; 62: pp. 484-488.
26. Gautherie M.: Improved system for the objective evaluation of breast thermograms. Prog Clin Biol Res 1982; 107: pp. 897-905.
27. Isard H.J.: Thermographic “edge sign” in breast carcinoma. Cancer 1972; 30: pp. 957-963.
28. Greene F., Page D., Fleming I., et. al.: AJCC cancer staging manual.2002.SpringerNew York
29. Lin C.H., Lien H.C., Hu F.C., et. al.: Fractionated evaluation of immunohistochemical hormone receptor expression enhances prognostic prediction in breast cancer patients treated with tamoxifen as adjuvant therapy. J Zhejiang Univ Sc B 2010; 11: pp. 1-9.
30. Lin C.H., Liau J.Y., Lu Y.S., et. al.: Molecular subtypes of breast cancer emerging in young women in Taiwan: evidence for more than just westernization as a reason for the disease in Asia. Cancer Epidemiol Biomarker Prevent 2009; 18: pp. 1807-1814.
31. Ng E.Y.K., Chen Y., Ung L.N.: Computerized breast thermography: study of image segmentation and temperature cyclic variations. J Med Eng Technol 2001; 25: pp. 12-16.
32. Xie W., McCahon P., Jakobsen K., et. al.: Evaluation of the ability of digital infrared imaging to detect vascular changes in experimental animal tumours. Int J Cancer 2004; 108: pp. 790-794.
33. Swaminathan S., Horn T.D., Pellowski D., et. al.: Nephrogenic systemic fibrosis, gadolinium, and iron mobilization. N Engl J Med 2007; 357: pp. 720-722.
34. Broome D.R., Girguis M.S., Baron P.W., et. al.: Gadodiamide-associated nephrogenic systemic fibrosis: why radiologists should be concerned. AJR Am J Roentgenol 2007; 188: pp. 586-592.
35. Jiang L., Zhan W., Loew M.H.: Dynamic thermal modeling of the normal and tumorous breast under elastic deformation. Med Image Comput Computer Assist Interv 2008; pp. 798-805.
36. Ng E.Y.K., Sudharsan N.M.: An improved three-dimensional direct numerical modelling and thermal analysis of a female breast with tumour. J Eng Med 2001; 215: pp. 25-37.